1064
Hypothesis-driven or regression-driven machine learning? What technique to choose? Insights from Professional Fighters Brain Health Study1Cleveland Clinic Lou Ruvo Center for Brain Health, Las Vegas, NV, United States, 2University of Washington - Seattle, Seattle, WA, United States
Synopsis
Whether routinely obtained T1-derived volumetric and cortical thickness measures can identify boxers with neuropsychological impairment using machine-learning (ML) techniques in active male boxers is currently unknown. We utilized conventionally acquired MPRAGE data from 72 impaired and 72 nonimpaired boxers, and identified regions that have significantly different cortical thickness, volumetric differences, and cortical thickness and brain volumes correlated with exposure to fighting and neuropsychological scores. Further, we investigated whether these regression-defined regions or prior hypothesis-defined brain regions can identify boxers with neuropsychological deficits. Hypothesis-driven regions with random forest algorithm outperformed other ML techniques with either regression of hypothesis-driven feature selection.
Introduction
Repetitive head impact (RHI) is a risk factor for various disorders1–3. Slower processing speed and difficulty in completing complex attentional tasks have been reported in neuropsychological studies of active professional fighters4,5. Various T1-derived volumetric and cortical thickness measures are found to be correlated with impairment in neuropsychological scores due to RHI4,6–9. However, whether routinely obtained T1-derived volumetric and cortical thickness measures can identify boxers with impairment on neuropsychological scores using machine-learning (ML) techniques in a cohort of active male boxers is unknown. It is also unknown whether such ML efforts to identify T1-derived measures that are predictive of impairment on neuropsychological scores with RHI will achieve maximum benefit either from hypothesis-driven prior T1-derived measures, T1-derived measures identified using conventional regression-driven techniques, or T1-derived measures identified with a combination of hypothesis-driven and regression-driven techniques.Methods
Participants: All active male boxers were selected from the Professional Fighters Brain Health Study. All boxers underwent a conventional T1-weighted MPRAGE on an in-house 3T Siemens Verio scanner (resolution: 1x1x1.2mm3, TR=2300ms, TE=2.98ms, TI=900ms). Data were preprocessed with FreeSurfer v6.0 (FS), and volume and cortical thickness on all FS-derived regions were extracted. All boxers who had a contrast-to-noise ratio>16 were deemed useful for further analysis10. All boxers also completed neuropsychological assessments using CNS vital signs11 on a computer in a quiet room supervised by a researcher on the same visit. Using two tests from the battery, namely Finger Tapping, and Digit Symbol Coding, we obtained processing speed (total correct on a Digit Symbol Coding task) and psychomotor speed (combining Digit Symbol result and average Finger Tapping on each hand) for all the boxers. Boxers that had both standardized processing speed and standardized psychomotor speed 2 standard deviations above the mean12 were classified as nonimpaired boxers, and the rest as impaired boxers. We identified 72 active impaired boxers (Age: 28.86±5.57 years, Education: 12.5±1.91 years) and 72 nonimpaired boxers (Age: 29.22±6.53 years, Education: 13.04±1.73 years) that were matched for exposure to fighting (Number of fights: 14.99±14.5 (impaired), 12.71±12.17 (nonimpaired), and years of professional fights (YOF): 5.42±3.87 (impaired), 5.76±4.38 (nonimpaired)). Processing: (i) FS was used to extract and compare whole-brain cortical thickness between the groups. (ii) Voxel-based morphometry was performed using Diffeomorphic Anatomical Registration Through Exponential Lie Algebra (DARTEL) toolbox13 to compare modulated gray-matter (GM) and white-matter (WM) density between the groups. (iii) Cortical thickness of 68 cortical regions from Desikan-Killiany atlas14 was extracted from each boxer. Topological measures of clustering coefficient, path length, small-worldness, nodal degree, global efficiency, and local efficiency were estimated from graph-theoretical (GT) analysis using the cortical regions as nodes and correlation between the nodes as edges15 for each group. (iv) Prior T1-derived measures predicting impairment in active professional fighters were extracted for each participant9. Statistical Analysis: PALM toolbox16 in FSL was used to extract significantly different or correlated volumetric, cortical thickness, and GT measures with neuropsychological scores. Of note, statistics on GT measures were done by extracting the same GT measures on 1000 random classification of samples in the cohort. ML analysis: Four ML techniques namely radial basis functional networks (RBFN)17, support vector machine (SVM) with linear and nonlinear kernel18, and random forest19 were used on (a) all FS-derived region-of-interest based cortical thickness and volume measures, (b) regression-derived brain regions significantly different or correlated with neuropsychological scores, (c) five prior identified T1-derived measures, and (d) various combinations of (b) and (c). Of note, least absolute shrinkage and selection operator (LASSO)20 was first utilized to reduce the feature space when all FS-derived measures were used. 80% of data was used as training and 20% of dataset was as independent testing dataset. Benchmark classification was set when the classifier with any feature set performed better than 95% of random assignment of participants in the testing dataset.Results
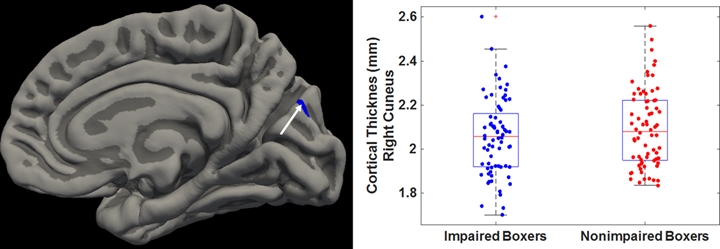
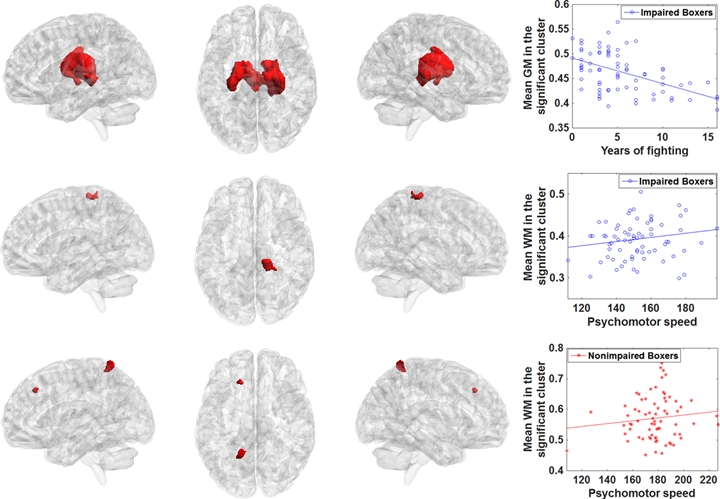
Cortical thickness of right cuneus (Fig.1) was significantly lower in impaired boxers. No volumetric measures were significantly different between the groups but modulated GM in bilateral thalamus was negatively correlated with YOF in impaired boxers (Fig.2-top), modulated WM in the right corticospinal tract (CST) was positively correlated with the psychomotor speed in impaired boxers (Fig.2-middle) and modulated WM in left CST and frontal cortex was positively correlated with the psychomotor speed in nonimpaired boxers (Fig.2-bottom). Despite the qualitative visual difference in adjacency matrices of groups (Fig.3c), none of the GT measures was significantly different (Fig.4). Prior hypothesis-driven MRI regions on ML classifier generated with the random forest as a classification algorithm was identified to be the best across all ML techniques and all features (Fig.5). Prediction accuracy and area under the receiver operating characteristic with random forest on prior hypothesis-driven MRI regions was found to be 75% and statistically significant (pcorr<0.05) against the random classification of boxers in the testing dataset.Discussion and Conclusion
Linear SVM is the best classifier when regression-driven MRI regions are used to guide ML algorithms. However, their benchmark accuracy is exactly at the 95th percentile of random assignments. Features with prior hypothesis-driven MRI regions outperform regression-based techniques or a combination of hypothesis and regression-driven techniques. However, the ML algorithms are not generalizable for small sample size cohorts, and ML-derived benchmark measures should be interpreted with caution.Acknowledgements
This study is supported by the National Institutes of Health (R01NS117547 and P20GM109025), a private grant from the Peter and Angela Dal Pezzo funds, a private grant from Lynn and William Weidner, a private grant from Stacie and Chuck Matthewson and the Keep Memory Alive Young Scientist Award at Cleveland Clinic Lou Ruvo Center for Brain Health. The Professional Fighters Brain Health Study is supported by Belator, UFC, the August Rapone Family Foundation, Top Rank, and Haymon Boxing.References
1. Bazarian JJ, Cernak I, Noble-Haeusslein L, Potolicchio S, Temkin N. Long-term neurologic outcomes after traumatic brain injury. J Head Trauma Rehabil. United States; 2009;24:439–451.
2. Bigler ED. Traumatic brain injury, neuroimaging, and neurodegeneration. Front Hum Neurosci. Frontiers Media S.A.; 2013;7:395.
3. Jordan BD. The clinical spectrum of sport-related traumatic brain injury. Nat Rev Neurol. England; 2013;9:222–230.
4. Bernick C, Banks S. What boxing tells us about repetitive head trauma and the brain. Alzheimers Res Ther. 2013;5:23.
5. Heilbronner RL, Bush SS, Ravdin LD, et al. Neuropsychological consequences of boxing and recommendations to improve safety: a National Academy of Neuropsychology education paper. Arch Clin Neuropsychol. 2009;24:11–19.
6. Bernick C, Banks SJ, Shin W, et al. Repeated head trauma is associated with smaller thalamic volumes and slower processing speed: the Professional Fighters’ Brain Health Study. Br J Sports Med. England; 2015;49:1007–1011.
7. Koerte IK, Lin AP, Willems A, et al. A review of neuroimaging findings in repetitive brain trauma. Brain Pathol. Switzerland; 2015;25:318–349.
8. Ng TSC, Lin AP, Koerte IK, et al. Neuroimaging in repetitive brain trauma. Alzheimers Res Ther. BioMed Central; 2014;6:10.
9. Mishra VR, Zhuang X, Sreenivasan KR, et al. Multimodal MR imaging signatures of cognitive impairment in active professional fighters. Radiology. 2017;285.
10. https://surfer.nmr.mgh.harvard.edu/pub/dist/freesurfer/tutorial_packages/OSX/freesurfer/bin/wm-anat-snr.
11. Gualtieri CT, Johnson LG. Reliability and validity of a computerized neurocognitive test battery, CNS Vital Signs. Arch Clin Neuropsychol. 2006;21:623–643.
12. Schinka JA, Loewenstein DA, Raj A, et al. Defining mild cognitive impairment: impact of varying decision criteria on neuropsychological diagnostic frequencies and correlates. Am. J. Geriatr. Psychiatry 2010. p. 684–691.
13. Ashburner J. A fast diffeomorphic image registration algorithm. Neuroimage. 2007;38:95–113.
14. Desikan RS, Ségonne F, Fischl B, et al. An automated labeling system for subdividing the human cerebral cortex on MRI scans into gyral based regions of interest. Neuroimage. 2006;31:968–980.
15. He Y, Chen Z, Evans A. Structural Insights into Aberrant Topological Patterns of Large-Scale Cortical Networks in Alzheimer’s Disease. J Neurosci. Society for Neuroscience; 2008;28:4756–4766.
16. Winkler AM, Ridgway GR, Webster MA, Smith SM, Nichols TE. Permutation inference for the general linear model. Neuroimage. United States; 2014;92:381–397.
17. Broomhead DS, Lowe D. Radial Basis Functions, Multi-Variable Functional Interpolation and Adaptive Networks. Complex Syst. 1988;2:321–355.
18. Ben-Hur A, Ong CS, Sonnenburg S, Schölkopf B, Rätsch G. Support Vector Machines and Kernels for Computational Biology. PLOS Comput Biol. Public Library of Science; 2008;4:1–10.
19. Liaw A, Wiener M. Classification and Regression by randomForest. R News. 2002;2:18–22.
20. Tibshirani R. Regression Shrinkage and Selection Via the Lasso. J R Stat Soc Ser B. Epub 1994.:267–288.
Figures