1059
Analysis and visualisation of physiological changes before and after a mild Traumatic Brain injury1University of Auckland, Auckland, New Zealand, 2Anatomy and Medical Imaging, Faculty of Medical and Health Sciences, University of Auckland, Auckland, New Zealand, 3Auckland Bioengineering Institute, University of Auckland, Auckland, New Zealand, 4Centre for Brain Research, University of Auckland, Auckland, New Zealand, 5Mechatronics Engineering, University of Canterbury, Christchurch, New Zealand, 6Centre for Neuroscience Studies, Queen’s University, Kingston, ON, Canada, 7Electrical Engineering, Stanford University, Stanford, CA, United States, 8Structural Biology, Stanford University, Stanford, CA, United States, 9Centre for Advanced MRI, University of Auckland, Auckland, New Zealand, 10Center for functional MRI, University of California, San Diego, CA, United States, 11Physiology, Faculty of Medical and Health Science, University of Auckland, Auckland, New Zealand
Synopsis
Three advanced sequences were used in conjunction to characterize the physiological changes associated with a mild traumatic brain injury. Amplified Magnetic Resonance Imaging (aMRI) is a motion detection and visualization technique, and is used to amplify pulsatile brain motion. Four-dimensional Flow Magnetic Resonance Imaging (4D flow MRI) is a sequence utilised to analyse and visualise blood flow, while diffusion MRI (dMRI) delineates features of tissue microstructure. Findings included diffusion changes, an increase in blood velocity, and a change in the profile of blood flow to the brain in the carotid arteries, along with increased parenchymal micro-displacements within the brain.
Introduction
Traumatic brain injury that results in hospitalisation has an incidence rate of 100-300/100000 population. The majority of these (70-90%) are mild (mTBI) (1). Primary diagnosis and expected prognosis in mild TBI (mTBI) is often clinically determined by an evaluation of the patient’s consciousness and self-reported symptoms. This has led to an approximate 50-90% of patients with mTBI going undiagnosed (2). This pilot project aimed to develop a suite of imaging techniques (diffusion MRI (dMRI), amplified MRI (aMRI), and 4D Flow MRI) as potential evidence-based diagnostic and monitoring tools for mTBI. We imaged the brain prior to and after an mTBI to evaluate the physiological changes following the injury. dMRI aimed to identify brain tissue microstructural changes, while aMRI aimed to identify changes in the micromovements of the brain. 4D flow MRI was used to calculate the blood flow supplied to the brain.Methods
Animal model: With ethical approval granted by the University of Auckland Animal Ethics Committee (approval number: 002170), a controlled blow of approximate 72 J of energy was delivered to the frontal area of the head using an impactor with a flat disk of 2.5 cm diameter. The impact was delivered between the horn buds of an anesthetized sheep posed in a sphinx position. The head was supported with soft cushions, to allow natural recoil motion of the head after the impact.Image Acquisition: All scans were acquired on a 3T MAGNETOM Skyra system (Siemens Healthcare, Erlangen, Germany) using a 32-channel head coil. T1-weighted, aMRI, 4D flow MRI, and dMRI datasets (combined scan time of 16:12 min) were acquired prior to and after the application of injury, with the time between the baseline and follow-up ranging from immediately after to approximately 7 days after the mTBI event.
Data Visualisation and Analysis – 4D Flow & aMRI: To monitor the blood flow to the brain, the region of interest (ROI) for the 4D flow analysis was restricted to the intracranial carotid arteries. The regions outside of the ROI were masked and visualisation and analysis techniques were applied to the resulting 3D vector fields to obtain the flow rate and average flow velocities through a slice. The aMRI datasets were amplified with an amplification factor = 25, band-pass filter of the heart rate frequency (0.1) and attenuation of motion related to all other temporal frequencies.
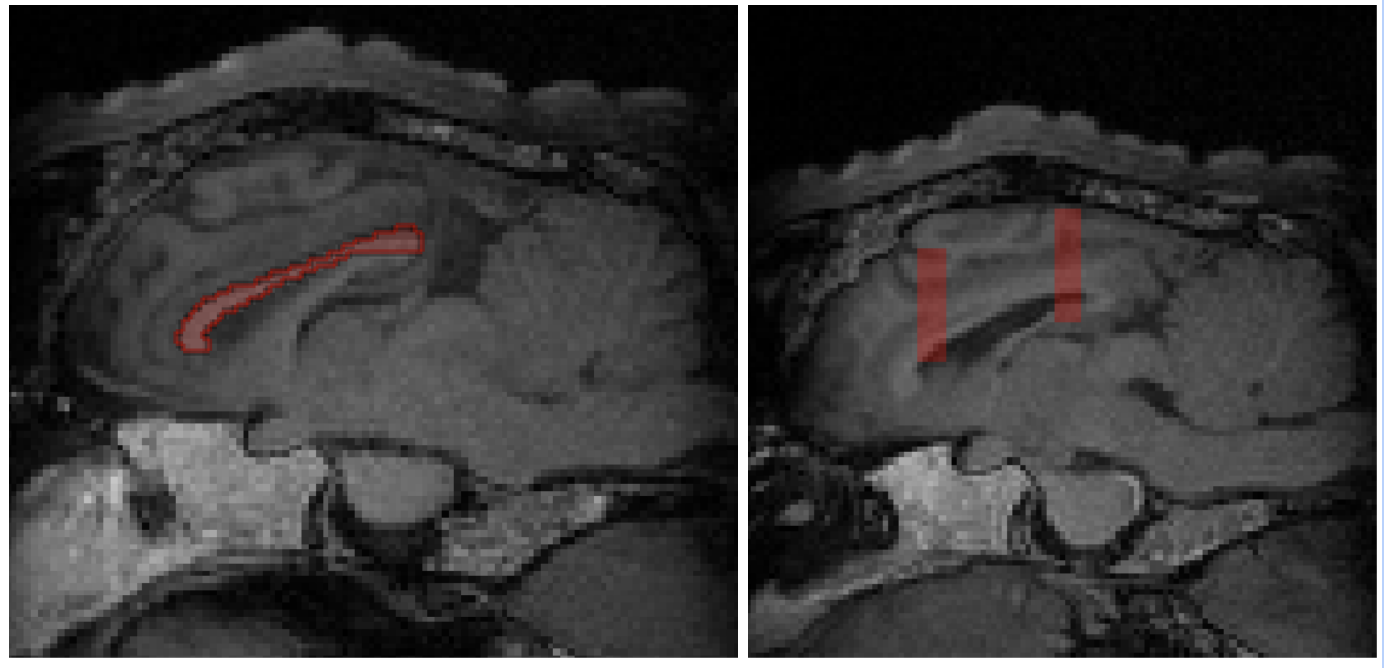
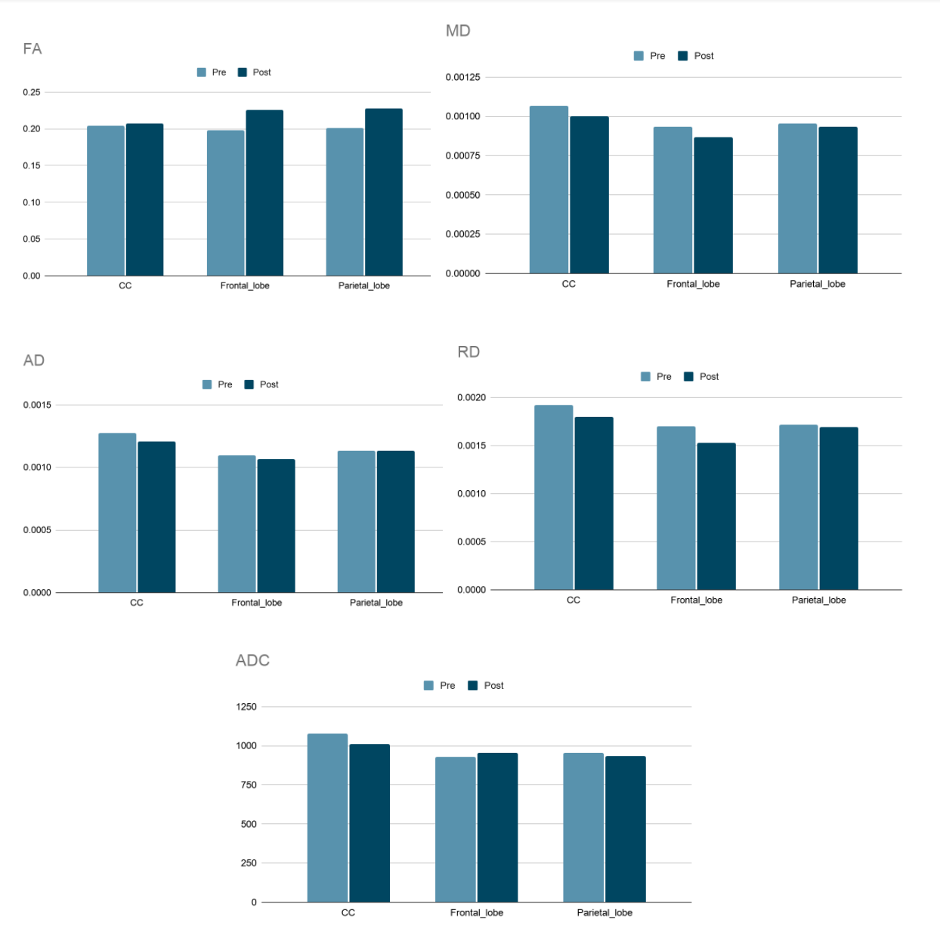
dMRI data analysis: dMRI data were analysed in the frontal lobe, parietal lobe, and corpus callosum. dMRI preprocessing and analysis were performed with FSL (6.0.3) (3). After distortion, eddy current and motion correction, the registered brain on stereotaxic T1w ovine_brain_atlas_0.5 mm (4) was skull-stripped by BET (5). dMRI parameter maps were calculated by FSL diffusion toolbox. Using T1-W images, three regions of interest were segmented (Fig. 1). Corpus callosum fibers as some of the most vulnerable tracts to mTBI was segmented using ovine_tractography_atlas_0.5mm (6). Two specific regions in the frontal and parietal lobes were manually segmented by MITK (7). Then all dMRI parameters (FA, MD, AD, RD, ADC) related to these four regions were extracted.
Results & Discussion
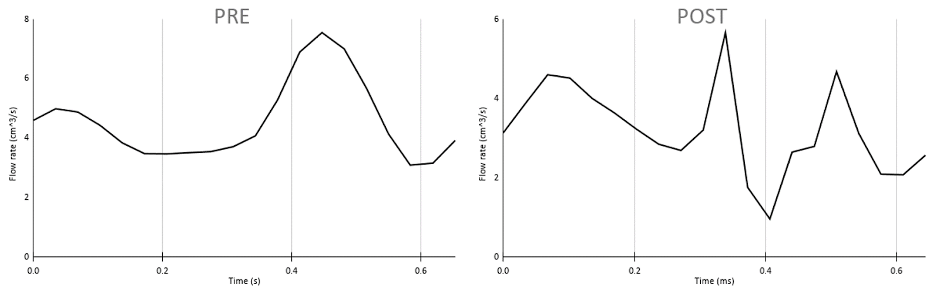
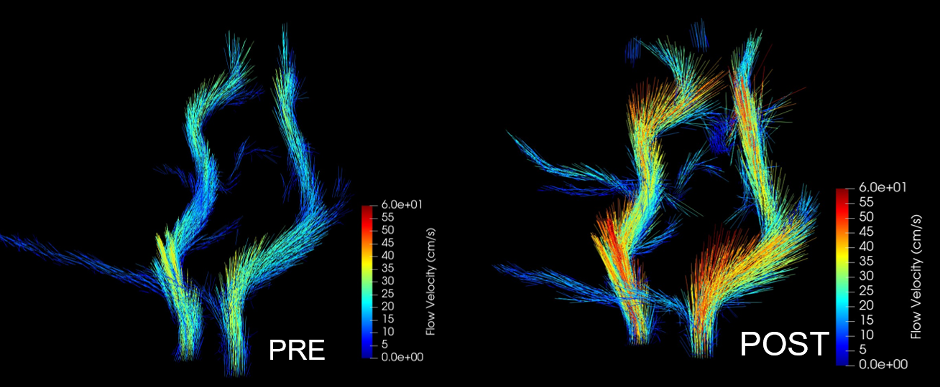
The dMRI analysis (Figs. 1-2) shows changes in all these three selected regions. An increase in FA value after injury was shown, however this change was less significant in corpus callosum than frontal and parietal lobes. Decrease in MD, AD, and RD was also observed in all three regions, although alteration in parietal lobe was insignificant. The decrease in ADC value in corpus callosum was more considerable than any changes in the other two regions.Figs. 3-4 show that following an mTBI event there is increased variability and pulsatile features in the profile of blood flow to the brain across one cardiac cycle. This effect is evident in the change in the pulse wave and the increased number of distinct peaks post impact. Changes in the blood velocity magnitude as is shown in Fig. 4 was also observed. Studies have shown that an increase in cerebral blood flow can be attributed to a neuroprotective response in acute mTBI (8), and that pulsatile blood flow to the brain is related to changes in white matter microstructural organization and disruption to structural properties which could occur during a mTBI (9).
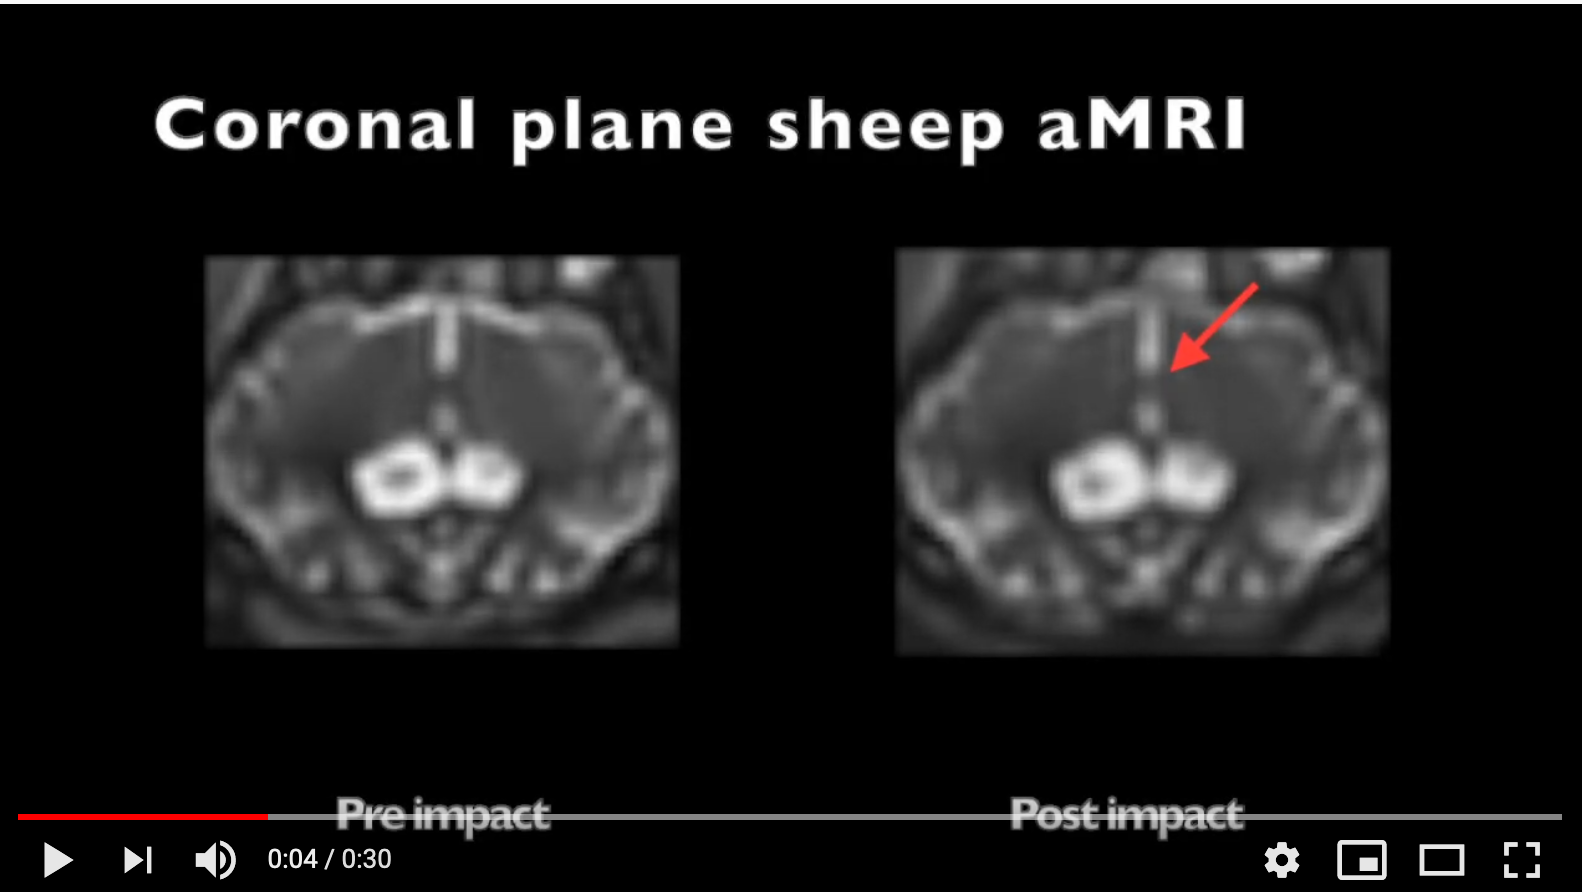
In addition, the motion detected by aMRI Video 1 (https://youtu.be/QznHb3jMKeo), shows there is a marked increase in the micromovements of the brain. This could be attributed to some extent to the increase in blood flow. This demonstrates that 4D flow in conjunction with aMRI have the potential to identify physiological abnormalities following mTBI where other sequences such a T1-weighted MRI would not detect the injury (see Fig. 1).
Conclusion
This study presents preliminary evidence that along with diffusion MRI changes, 4D flow MRI, and aMRI can distinguish differences in blood flow and movement of the brain following an mTBI. While more research is needed, this suggests that there is merit in investigating the utilisation of aMRI and 4D flow MRI as potential evidence-based diagnostic and prognostic tools for mTBI events.Acknowledgements
This work was supported by The University of Auckland FDRF strategic initiatives fund.
The * denotes equal authorship contribution.
References
- Cassidy, J. D., Carroll, L. J., Peloso, P. M., Borg, J., von Holst, H., Holm, L., Kraus, J., Coronado, V. G., & WHO Collaborating Centre Task Force on Mild Traumatic Brain Injury (2004). Incidence, risk factors and prevention of mild traumatic brain injury: results of the WHO Collaborating Centre Task Force on Mild Traumatic Brain Injury. Journal of rehabilitation medicine, (43 Suppl), 28–60. https://doi.org/10.1080/16501960410023732
- Prince, C., & Bruhns, M. E. (2017). Evaluation and Treatment of Mild Traumatic Brain Injury: The Role of Neuropsychology. Brain sciences, 7(8), 105. https://doi.org/10.3390/brainsci7080105
- Smith SM, Jenkinson M, Woolrich MW, Beckmann CF, Behrens TE, Johansen-Berg H, Bannister PR, De Luca M, Drobnjak I, Flitney DE, et al. (2004). Advances in functional and structural MR image analysis and implementation as FSL. Neuroimage; 23(Suppl 1):S208–19. DOI: 10.1016/j.neuroimage.2004.07.051
- Nitzsche B, Frey S, Collins LD, Seeger J, Lobsien D, Dreyer A, Kirsten H, Stoffel MH, Fonov VS, Boltze J (2015). A stereotaxic, population-averaged T1w ovine brain atlas including cerebral morphology and tissue volumes. Front Neuroanat. 4;9:69. doi: 10.3389/fnana.2015.00069
- S.M. Smith (2002). Fast robust automated brain extraction. Human Brain Mapping, 17(3):143-155 doi: 10.1002/hbm.10062
- Pieri V, Trovatelli M, Cadioli M, Zani DD, Brizzola S, Ravasio G, Acocella F, Di Giancamillo M, Malfassi L, Dolera M, Riva M, Bello L, Falini A, Castellano A (2019). In vivo Diffusion Tensor Magnetic Resonance Tractography of the Sheep Brain: An Atlas of the Ovine White Matter Fiber Bundles. Front Vet Sci. 16;6:345. doi: 10.3389/fvets.2019.00345.
- Wolf I, Vetter M, Wegner I, Nolden M, Bottger T, Hastenteufel M, Schobinger M, Kunert T, Meinzer HP. The medical imaging interaction toolkit (MITK): a toolkit facilitating the creation of interactive software by extending VTK and ITK. InMedical Imaging 2004: Visualization, Image-Guided Procedures, and Display 2004 May 5 (Vol. 5367, pp. 16-27). International Society for Optics and Photonics. https://doi.org/10.1117/12.535112
- Doshi H, Wiseman N, Liu J, Wang W, Welch RD, O’Neil BJ, et al. (2015) Cerebral Hemodynamic Changes of Mild Traumatic Brain Injury at the Acute Stage. PLoS ONE 10(2): e0118061. https://doi.org/10.1371/journal.pone.0118061
- Jolly, T. A., Bateman, G. A., Levi, C. R., Parsons, M. W., Michie, P. T., & Karayanidis, F. (2013). Early detection of microstructural white matter changes associated with arterial pulsatility. Frontiers in human neuroscience, 7, 782. https://doi.org/10.3389/fnhum.2013.00782
Figures