1054
Sensitivity and Specificity of MRI Markers of Excess Manganese Brain Deposition1School of Health Sciences, Purdue University, West Lafayette, IN, United States, 2Department of Physics and Astronomy, Purdue University, West Lafayette, IN, United States, 3Mathematics and Statistics, Purdue University Northwest, Westville, IN, United States, 4Radiology and Imaging Scienes, Indiana University School of Medicine, Indianapolis, IN, United States
Synopsis
The pallidal index (PI) and the R1 relaxation rate are two commonly used MRI markers to diagnose manganese (Mn) neurotoxicity caused by excess Mn accumulation in the brain. While it has been hypothesized that the R1 relaxation rate is more sensitive and specific to Mn accumulation than the PI, a formal comparison is still missing. This study aimed to compare these two MRI markers' sensitivity and specificity to distinguish different levels of exposure to Mn by performing a receiver operating characteristic curve (ROC) analysis on a cohort of welders, occupationally exposed to Mn in welding fumes.
Introduction
Excess exposure to manganese (Mn) leads to accumulation of Mn in the brain, which may cause neurotoxicity leading to cognitive and motor symptoms [1]. Since Mn acts as a MRI contrast agent, MRI allows for non-invasive estimation of increased brain Mn levels in vivo and is one of the main diagnostic criteria for current Mn intoxication [1]. Two types of MRI markers have been commonly used in the Mn toxicology literature to date: The Pallidal Index (PI), a ratio of T1-weighted signal intensities in the globus pallidus (GP) and frontal white matter (FWM), and the R1 relaxation rate in different brain regions. Being less dependent on imaging parameters, the R1 is hypothesized to be more sensitive [2] however a formal comparison was never made. This study aimed to compare these two MRI markers' sensitivity and specificity by performing a receiver operating characteristic curve (ROC) analysis on a cohort of welders, occupationally exposed to Mn in welding fumes. Both, the capability to distinguish between exposed subjects from unexposed controls, as well as sensitivity and specificity in distinguishing high-exposed welders from low-exposed welders were investigated.Methods
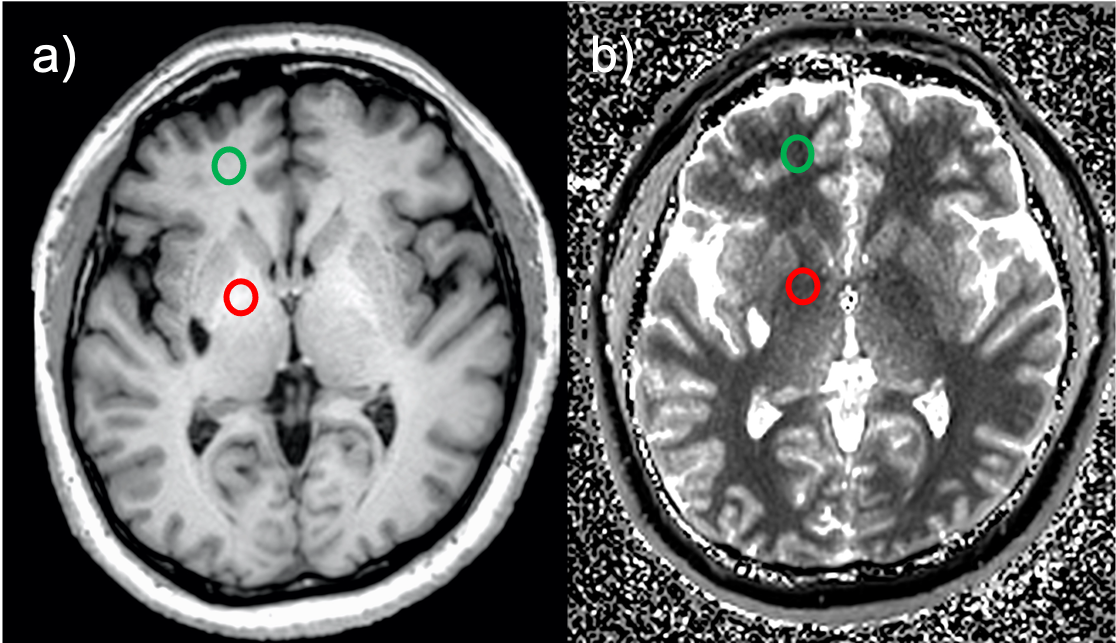
PI and R1 values were calculated from data from a prior study on 70 subjects (42 male welders and 28 age-matched male controls) recruited from a local manufacturing plant [3-7]. Exposure assessment was performed using personal air sampling at work, combined with a work history questionnaire [3]. MRI scans had been acquired on a 3T GE Signa MR scanner with an 8-channel head coil. Images from a 3D high-resolution T1-weighted sequence using a fast-spoiled gradient-recalled echo sequence (FSPGR, TR/TE: 6.54/2.8 ms, flip angles: 12°, matrix: 256x256, 220 slices per volume, resolution: 1x1x1 mm3) were used to determine the PI and for segmentation of the brain into 192 separate regions of interest (ROI) using Freesurfer (surfer.nmr.mgh.harvard.edu).PI values were obtained by manually drawing circular regions of interests (ROIs) in the GP and FWM (Fig. 1) on the T1-weighted FSPGR MRI images, guided by anatomical landmarks, and building the ratio of the mean signal in each ROI: PI = 100 * S(GP) / S(FWM).
T1 mapping was achieved using a 3D spoiled gradient echo sequence using a variable flip angle method with two echoes (SPGR, TR/TE: 6.36/1.76 ms, flip angles 𝛼: 3°, 17°, resolution: 1x1x2 mm3). To correct for the radiofrequency field (B1) inhomogeneity, the lower flip angle map (𝛼=3°) was smoothed 20 times and was normalized to 1 to simulate a B1 map [4]. R1 (=1/T1) values for GP, FWM, and substantia nigra (SN) were determined by coregistering the T1 maps and the automatically segmented ROI masks from the FSPGR images on Matlab R2014a (MathWorks, Natick, MA, USA).
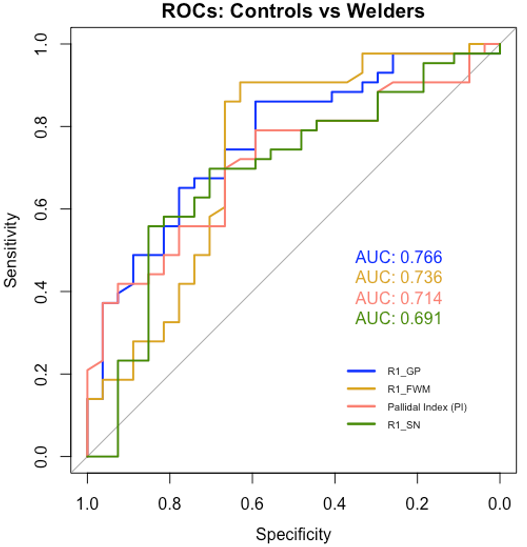
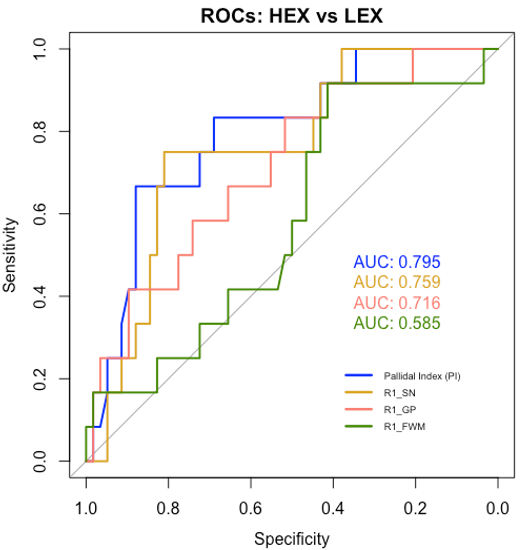
For each marker, PI, R1 in GP, FWM, and SN, an ROC analysis was performed in R [8] to identify the area under the curve (AUC) and a threshold with the highest sensitivity and specificity for distinguishing welders from controls. Additionally, we separated our cohort into two subgroups, a high exposure (HEX) and low exposure (LEX) group, defined by a past-3-months welding fume exposure level above or below 0.04 mg/m3 [5]. Sensitivity and specificity to distinguish these two exposure groups were assessed by ROC analysis as well.
Results
Our results show that an R1 rate of 1.06 (1/s) in the FWM allows for best discrimination between welders and controls with 91% sensitivity and 63% specificity (Fig. 2, AUC = 0.74). A PI threshold of 90.65 had 79% sensitivity and 57% specificity (AUC = 0.71). In contrast, for the HEX and LEX subgroups, the PI had the highest AUC of 0.80, with 67% sensitivity and 88% specificity (Fig. 3). However, a R1 rate threshold of 0.89 (1/s) in the SN allows for similar discrimination between HEX and LEX subjects with 75% sensitivity and 81% specificity (AUC = 0.76).Discussion and Conclusion
Our results reinforce the hypothesis that R1 is more sensitive and specific to brain Mn accumulation than PI. Results showed that the R1 rate in the GP and FWM outperformed the PI in the capability to distinguish between exposed subjects from unexposed controls. R1 in the SN had the lowest AUC; however, for the distinction between high and low exposure, R1 in the SN had the best trade-off between sensitivity and specificity and the second-highest AUC. This indicates that the brain region that best discriminates between welders vs. controls is the FWM, whereas the SN is the best region to discriminate between HEX vs. LEX. This change in performance seems to agree with recent findings where R1 in the nuclei of the basal ganglia have been found to be associated with Mn exposure in subjects with high Mn exposure, but not in subjects with low exposure to Mn [2,6,7].Acknowledgements
This study was supported by NIH/NIEHS R01 ES020529.References
1.Tuschl K, Mills PB, Clayton PT (2013). Manganese and the Brain. Int Rev Neurobiol. 2013;110:277-312
2. Lee EY, Flynn MR, Du G, Lewis MM, Fry R, Herring AH, Van Buren E, Van Buren S, Smeester L, Kong L, Yang Q, Mailman RB, Huang X (2015) T1 relaxation rate (R1) indicates nonlinear mn accumulation in brain tissue of welders with low-level exposure. Toxicol Sci 146:281–289. https://doi.org/10.1093/toxsci/kfv088
3. Ward EJ, Edmondson DA, Nour MM, Snyder S, Rosenthal FS, Dydak U. Toenail Manganese: A Sensitive and Specific Biomarker of Exposure to Manganese in Career Welders. Ann Work Expo Health. 2017 Dec 15;62(1):101-111. doi: 10.1093/annweh/wxx091.
4. Yeh C-L, Ward EJ, Ma R, Snyder S, Schmidt-Wilcke T, Dydak U (2016).P125 Whole-brain r1 mapping of manganese in welders - visualisation of increased Mn levels in the brain. Occup. Environ. Med. 73:A161 LP-A161. https://doi.org/10.1136/oemed-2016-103951.442
5. Ma RE, Ward EJ, Yeh C-L, Snyder S, Long Z, Gokalp Yavuz F, Zauber SE, Dydak U (2018) Thalamic GABA levels and occupational manganese neurotoxicity: association with exposure levels and brain MRI. Neurotoxicology 64:3042. https://doi.org/10.1016/j.neuro.2017.08.013
6. Edmondson DA, Ma RE, Yeh C-L, Ward E, Snyder S, Azizi E, Zauber SE, Wells EM, Dydak U (2019). Reversibility of neuroimaging markers influenced by lifetime occupational manganese exposure. Toxicol Sci 1:1–13. https://doi.org/10.1093/toxsci/kfz174.
7. Edmondson, D.A., Yeh, CL., Hélie, S. et al. (2020). Whole-brain R1 predicts manganese exposure and biological effects in welders. Arch Toxicol 94, 3409–3420 https://doi.org/10.1007/s00204-020-02839-7
8. R Core Team (2019). R: A language and environment for statistical computing. R Foundation for Statistical Computing, Vienna, Austria. URL http://www.R-project.org/
Figures