1048
Automated brain MRI volumetry and T1 relaxometry in children with focal epilepsy of unknown cause.1CHU de Tours, Tours, France, 2UMR 1253, iBrain, Université de Tours, INSERM, Tours, France, 3Advanced Clinical Imaging Technology, Siemens Healthcare AG, Lausanne, Switzerland, 4Department of Radiology, Lausanne University Hospital and University of Lausanne, Lausanne, Switzerland, 5LTS5, École Polytechnique Fédérale de Lausanne (EPFL), Lausanne, Switzerland, 6INSERM U1253, Tours, France
Synopsis
In the initial exploration of children with focal epilepsy of unknown cause, MRI is useful. To increase the sensitivity of the MRI, we have defined a postprocessing Morphometric Analysis Program allowed obtaining automatically both volumetry and T1 relaxometry values in 38 brain regions. Deviations from reference ranges – previously established from a cohort of healthy subjects – help radiologists to quantify brain abnormalities undetected in brain MRI in more than 80% of our cases.
Purpose
Children with focal epilepsy are a very heterogeneous group where MR-based detection of subtle brain lesions remains challenging. In the absence of visible lesions and clinical-biological arguments for a genetic, metabolic, immune or infectious cause, these epilepsies can be divided into two groups: self-limited focal epilepsies (formerly called idiopathic or functional); and epilepsies of unknown cause. The prevalence of patients with non-lesional epilepsy defined by MRI is significantly higher in children (31%) than in adults (21%) (1). Our hypothesis was that a Morphometric analysis program (MAP) will improve the sensitivity of brain MRI in children with newly diagnosed focal epilepsy. Objectives of this study were to compare quantitative brain values to a normal cohort and investigate correlation with their electro-clinical presentations.Materials
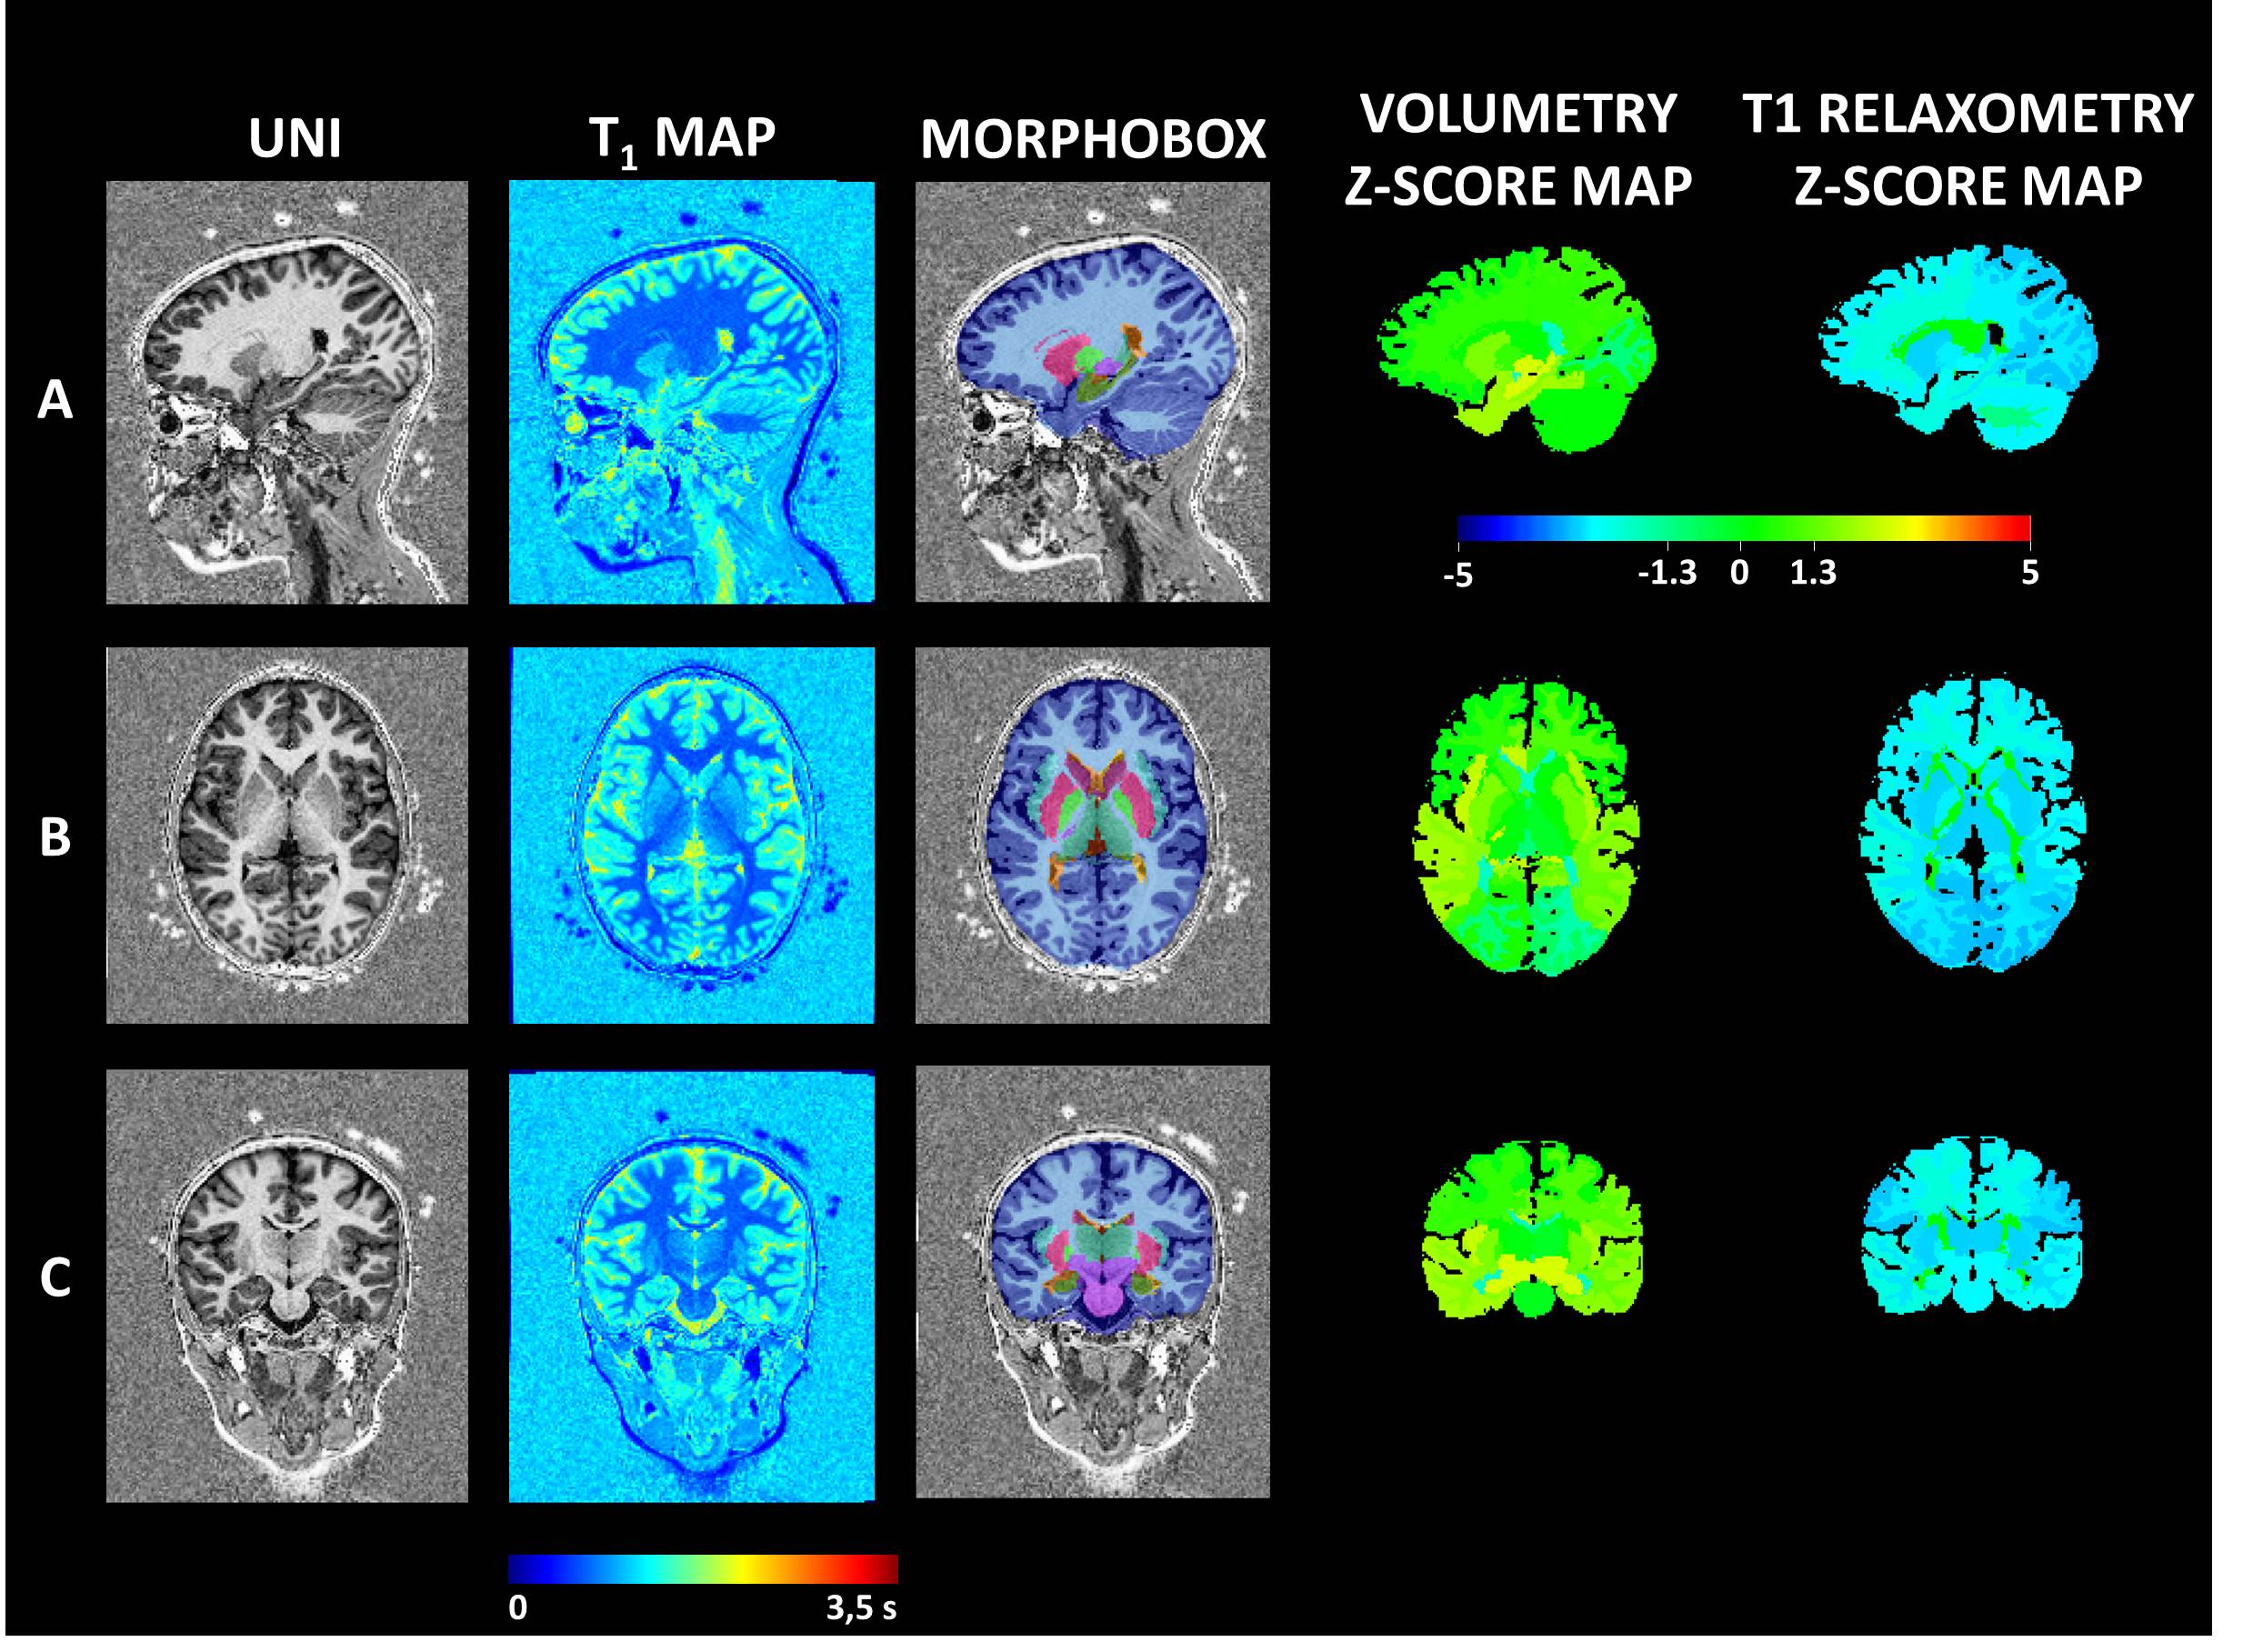
A prospective monocentric study was conducted recruiting 13 consecutive children under sixteen years from a single University Hospital between January 2017 and June 2020 with suspected focal epilepsy. We prospectively included children with suspected focal epilepsy having a 1.5T brain MRI (MAGNETOM Aera, Siemens Healthcare, Erlangen, Germany) using a 20-channel head coil without general anesthesia. Whole-brain simultaneous T1-weighted imaging and T1 mapping was achieved with the MP2RAGE sequence using acquisition parameters tailored to pediatric applications (spatial resolution = 1.33x1.33x1.25 mm3, FOV = 256x240 mm2, TI1/TI2 = 600/2000 ms, flip angles = 5-6°, TR = 5000 ms, TA = 6:36 min). Automated brain segmentation was performed using the MorphoBox prototype (2) with a previously reported adaptation to pediatric application of its templates (3). The segmentation of 38 anatomical brain structures was obtained according to the standard anatomical nomenclature (4). A postprocessing MAP allowed obtaining automatically both volumetry and T1 relaxometry values in 38 brain regions. Deviation from reference ranges – previously established from a cohort of healthy subjects (3) – of resulting regional volumes and T1 values were assessed by z-score. Electroclinical data were collected. Medical records were reviewed for seizure history, EEG, initial review of morphological MRI findings based on usual clinical care. To avoid ambiguity in comparing MAP localizations to information from clinical radiology, scalp EEG, we aggregated results by lobe and performed concordance analysis with these modalities on a lobar level. Approval was received by the local Ethics Committee in Human research (RNI-2017-093). All the children’s parents gave informed consent.Results
Eleven children were included (7 girls and 4 boys). The mean age was 6.8 years +/- 3.8 years [2.5 -12.9]. Clinically, 10 children had focal seizures, 1 with bilateral seizures. Two patients had Self Limited Epilepsy with Centro Temporal Spikes (SLSLECTS). The average time from the epilepsy onset to the MRI exam was 1.64 years (3 days – 4.5 years). Automated brain analysis revealed abnormalities (i.e., z-score < -2 or > 2) in 9/11 SLECTS (81%) for whom brain MRI scans were morphologically normal. The child with normal T1 relaxometry and brain volumes values was the one with any epileptic abnormality in the electroencephalogram. Eight patients (72.7%) had volume abnormalities (six had focused involvement and two a diffuse increased grey and white matter volumes). Six patients (54%) showed abnormal T1 relaxometry values (two had focal cortical grey matter involvements, three had diffuse white matter and grey matter involvements and one had diffuse white matter with basal ganglia involvement. A possible epileptogenic zone was identified in 4/11 patients (36%).Discussion
The results of our study on children with focal epilepsy and morphologically normal brain MRI corroborate our hypothesis that a brain morphometric analysis program (MAP) would reveal undetected subtle epileptogenic abnormalities. Children had frequentlu abnormal quantitative volumetric or T1 relaxometry data. Diffuse or more localized T1 volume or relaxometry abnormalities have been observed in patients with SLSLECTS, which by definition are non-lesional epilepsies (5). This is consistent with the structural brain disorganization in SLECTS patients already described (6). The presence of volumetric and T1 relaxometry abnormalities in some of our patients, despite stereotyped focal seizures recorded in video-EEG, suggests a pathological neurodevelopmental process associating abnormal brain maturation and focal epilepsy. Access to an optimized, precise and reproducible imaging technique such as a 3D MP2RAGE sequence with MAP for the etiological assessment of focal epilepsies would allow improving the recommendation of our patients to pediatric centers specialized for epilepsy surgeryConclusion
A combined analysis of brain volumetry and T1 relaxometry of children with focal epilepsy could describe brain abnormalities undetected in conventional brain MRI in more than 80% of our cases. This automated post-processing method could have a significant impact on clinical care, while helping to select more efficiently patients requiring a pre-surgical second line assessment, with a more precise brain region to explore.Acknowledgements
The authors thank the pediatric patients and their parents who agreed to contribute to the study. The authors acknowledge Mrs M. Samalbide and Mr G. Binninger for their invaluable support.
References
1. Téllez-Zenteno JF, Ronquillo LH, Moien-Afshari F, Wiebe S. Surgical outcomes in lesional and non-lesional epilepsy: A systematic review and meta-analysis. Epilepsy Res. 2010 May 1;89(2):310–8.
2. Schmitter D, Roche A, Maréchal B, Ribes D, Abdulkadir A, Bach-Cuadra M, et al. An evaluation of volume-based morphometry for prediction of mild cognitive impairment and Alzheimer’s disease. NeuroImage Clin. 2015;7:7–17.
3. Morel B, Piredda GF, Cottier J-P, Tauber C, Destrieux C, Hilbert T, et al. Normal volumetric and T1 relaxation time values at 1.5 T in segmented pediatric brain MRI using a MP2RAGE acquisition. Eur Radiol. 2020 Sep 3;
4. Destrieux C, Fischl B, Dale A, Halgren E. Automatic parcellation of human cortical gyri and sulci using standard anatomical nomenclature. NeuroImage. 2010 Oct 15;53(1):1–15.
5. Garcia-Ramos C, Jackson DC, Lin JJ, Dabbs K, Jones JE, Hsu DA, et al. Cognition and brain development in children with benign epilepsy with centrotemporal spikes. Epilepsia. 2015 Oct;56(10):1615–22.
6. Bourel-Ponchel E, Mahmoudzadeh M, Adebimpe A, Wallois F. Functional and Structural Network Disorganizations in Typical Epilepsy With Centro-Temporal Spikes and Impact on Cognitive Neurodevelopment. Front Neurol. 2019 Aug 29;10:809.
Figures