1042
Graph-based global reasoning of DWI tractography connectome allows reproducible prediction of language impairment in pediatric epilepsy1Pediatrics, Wayne State University, Detroit, MI, United States, 2Computer Science, Wayne State University, Detroit, MI, United States, 3Translational Neuroscience Program, Wayne State University, Detroit, MI, United States
Synopsis
We propose a deep learning-based DWI connectome (DWIC) analytic method, characterized by convolutional neural network combined with graph convolutional network. This method trained DWIC features to predict the severity of expressive and receptive language impairment, defined by the clinical evaluation of language fundamentals test. It outperformed other state-of-the-art deep learning approaches in predicting the expressive/receptive language scores in children with focal epilepsy. It also demonstrated the smallest prediction error without a noticeable variation in the random permutation test. Further investigation is warranted to determine the feasibility of a DWIC-based prognostic biomarker of language impairment in clinical practice.
Introduction
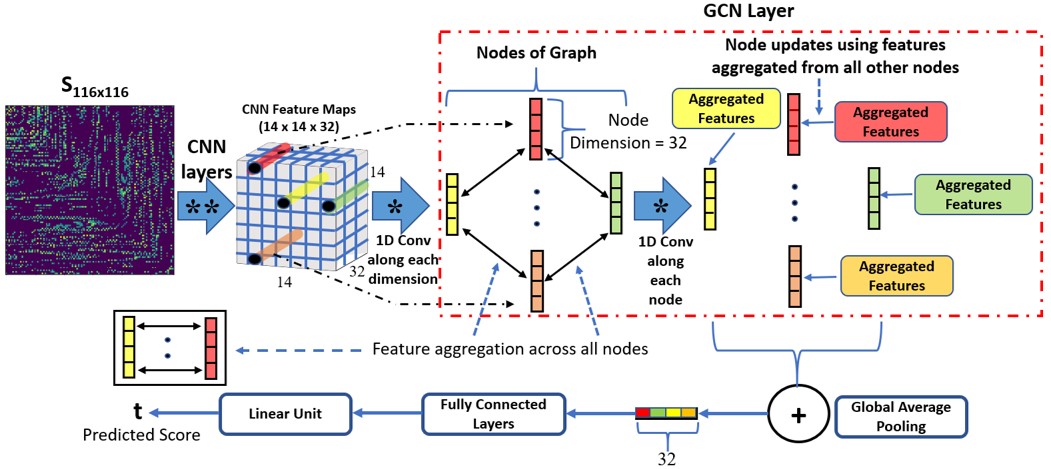
Psychometric assessments of language function can be confounded by comorbid cognitive conditions, leading to unreliable identification of language impairments in children with focal epilepsy (FE) who may show deficits in attention, memory, visuospatial functions, and/or general intelligence1-3. This study proposes a novel deep learning method combining convolutional neural network (CNN) with graph convolutional network (GCN), referred to as “CNN+GCN”. We investigated whether the global reasoning of diffusion-weighted imaging connectome (DWIC) features4 can predict the severity of expressive and receptive language impairment assessed by the clinical evaluation of language fundamentals (CELF) test5. A CNN was first applied to map a FE child’s DWIC adjacency matrix to a set of sliced feature maps. The sliced feature maps then formed the nodes of a graph network6,7. Feature aggregation and node updates were finally performed over these nodes to perform global reasoning and finally predict the corresponding CELF expressive and receptive language scores. We hypothesized that applying the CNN+GCN to DWIC would accurately predict CELF-defined expressive and receptive language impairments by identifying atypically impaired neural connections in expressive and receptive language areas8 without relying on a specific DWI connectome node configuration.Methods
DWI tractography data from 51 FE children (age: 11.8±3.1 years) were acquired using a 3T scanner with 55 encoding directions at b=1000 s/mm2. Second-order integration over fiber orientation distributions was randomly seeded with 100 seeds per gray-white matter boundary voxel, reconstructing whole-brain tracts in the framework of anatomically constrained tractography using the MRtrix3 package (https://www.mrtrix.org/). Whole-brain tracts were spatially normalized to a group template space using advanced normalization tools (http://picsl.upenn.edu/software/ants/). Automated anatomical labeling (AAL) parcellation was then applied to the normalized whole-brain tracts in order to construct a DWI-based brain connectome graph, G=(Ω,S), where Ω is a set of 116 nodes representing AAL regions in the brain, S is an adjacency matrix of edges, Sij representing the strength of the pair-wise connection between Ωi and Ωj as the number of tract streamlines normalized by an average streamline length. The proposed CNN+GCN model (Fig. 1) deeply reasons the global dependencies in Sij to predict the actual CELF score of t. More specifically, the spatial relations between CNN features obtained from Sij are iteratively learned through graph convolutions to minimize the prediction error. To investigate whether the specific arrangement of Ω affects the prediction accuracy of our CNN+GCN, random permutation labeling testing was performed, where the indices of Ωi=1-116 were randomly shuffled ten times to simulate ten connectome graphs of G per patient. For each patient’s ten random graphs S and actual CELF score t (standardized in the range of 0 – 120), data were augmented using the synthetic minority over-sampling technique (SMOTE)9 to generate a set of training and test instances (n=51,000). Using this instance set, the prediction error of “CNN+GCN” (i.e., mean absolute error [MAE] between predicted and actual score) was compared with those of other deep learning-based approaches such as BrainNetCNN10 and “CNN+Multi-Layer Regressor (CNN+MLR)11”. Finally, we generated gradient-based activation maps12 with the trained CNN+GCN model and identified the crucial hub connections of language impairments from the DWIC graphs of individual patients.Results
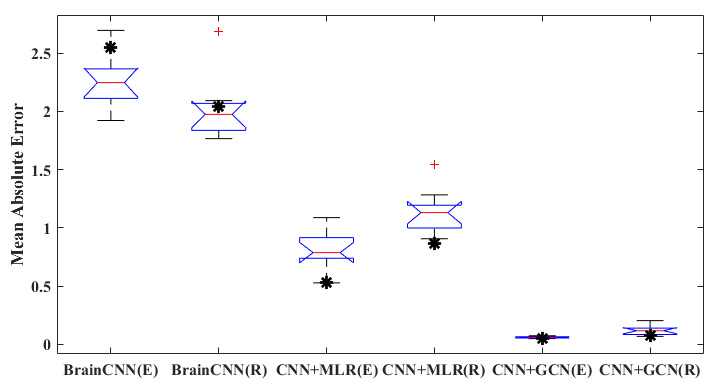
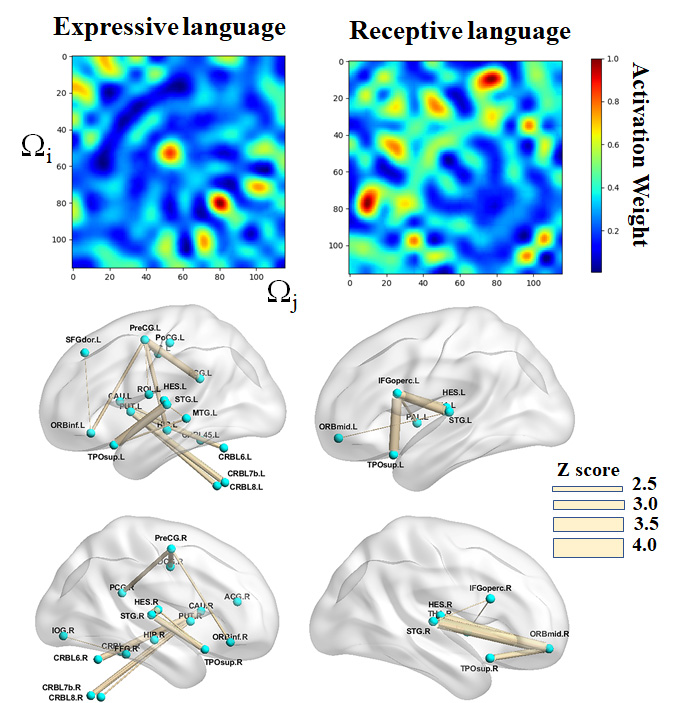
Fig. 2 presents the prediction performance of the CNN+GCN in the random permutation labeling test. The CNN+GCN outperformed the other two approaches in predicting the CELF expressive/receptive language scores (i.e., MAE of the original G = 2.55/2.05, 0.53/0.87, and 0.05/0.08 from BrainNetCNN, CNN+MLR, and CNN+GCN, respectively). In addition, the CNN+GCN alone could provide the MAE of the original connectome graph (marked by “*”) within the 25th and 75th percentiles of the 10 MAE samples generated from randomly shuffled connectome graphs. This suggests that the global reasoning of CNN features improved the prediction reproducibility without depending on a specific nodal configuration in the brain connectome graph. The activation maps of the trained CNN+GCN (Fig. 3) revealed that left/right superior temporal gyrus (STG.L/R), left/right precentral gyrus (PreCG.L/R), left/right Heschl gyrus (HES.L/R), left superior temporal pole (TPOsup.L), left putamen (PUT.L), and left cerebellum (CRBL7a,7b) are the most prominent language hubs, facilitating critical neural connections that are most predictive of high-order language functioning.Discussion
The present study demonstrated that the graph-based reasoning of clinical DWIC data can precisely predict language impairments in pediatric epilepsy. The CNN+GCN could aggregate complex, non-local connectivity features to make an accurate prediction without depending on the order of cortical parcellation in a prefixed atlas. It outperforms other CNN-based models, reducing the MAE at least 10.6 times and 10.8 times for the prediction of expressive and receptive language scores, respectively.Conclusion
Our findings indicate that clinically acquired DWIC data substantially differ according to the severity of language impairments. The CNN+GCN may help refine the complex relationship between neuroimaging and clinical phenotypes. Further investigation is warranted to determine the feasibility of a DWIC-based prognostic biomarker of language impairment in clinical practice.Acknowledgements
The authors would like to thank all participants and their families for their time and interest in this study. This work was supported by the US National Institutes of Health (NIH) grants R01NS089659 (to J.J.) and US National Science Foundation (NSF) grant CNS-1637312 (to M.D.).References
1. Hermann BP, Jones JE, Sheth R, et al. Growing up with epilepsy: A two-year investigation of cognitive development in children with new onset epilepsy. Epilepsia. 2008;49(11):1847–1858.
2. Dutta M, Murray LL, Miller W, et al. Cognitive–linguistic functions in adults with epilepsy: Preliminary electrophysiological and behavioral findings. Journal of Speech, Language, and Hearing Research. 2020;63(7):2403–2417.
3. Kramer MA and Cash SS. Epilepsy as a disorder of cortical network organization. The Neuroscientist. 2012;18(4):360–372.
4. Bullmore E and Sporns O. Complex brain networks: Graph theoretical analysis of structural and functional systems. Nature reviews neuroscience. 2009;10(3):186–198.
5. Paslawski T. The clinical evaluation of language fundamentals, (CELF-4) a review. Canadian Journal of School Psychology. 2005;20(1-2):129–134.
6. Kipf TN and Welling M. Semi-supervised classification with graph convolutional networks. International Conference on Learning Representations. 2017;arXiv:1609.02907 [cs.LG].
7. Parisot S, Ktena SI, Ferrante E, et al. Disease prediction using graph convolutional networks: Application to autism spectrum disorder and Alzheimer’s disease. Medical image analysis. 2018;48:117–130.
8. Nakai Y, Jeong JW, Brown EC, et al. Three-and four-dimensional mapping of speech and language in patients with epilepsy. Brain. 2017;140(5):1351–1370.
9. Chawla NV, Bowyer KW, Hall LO, et al. SMOTE: Synthetic minority over-sampling technique. Journal of artificial intelligence research. 2002;6:321–357.
10. Kawahara J, Brown CJ, Miller SP, et al. BrainNetCNN: Convolutional neural networks for brain networks towards predicting neurodevelopment. Neuroimage. 2017;146(1):1038–1049.
11. Banerjee S, Dong M, Lee MH, et al. Deep relational reasoning for the prediction of language impairment and postoperative seizure outcome using preoperative DWI connectome data of children with focal epilepsy. IEEE Transactions on Medical Imaging. 2020 Nov 9;PP. doi: 10.1109/TMI.2020.3036933. Epub ahead of print. PMID: 33166251.
12. Selvaraju RR, Cogswell M, Das A, et al. Grad-cam: Visual explanations from deep networks via gradient-based localization. Proceedings of the IEEE International Conference on Computer Vision. 2016;arXiv:1610.02391 [cs.CV].
Figures