1041
An n=1 approach to white matter anomaly detection in epilepsy1Cardiff University Brain Research Imaging Centre (CUBRIC), Cardiff University, Cardiff, United Kingdom, 2Department of Neurosurgery, University Hospital Wales, Cardiff, United Kingdom, 3Department of Neurology, University Hospital of Wales, Cardiff, United Kingdom
Synopsis
Most clinical diffusion MRI (dMRI) applications rely on statistical comparisons between large groups of patients and healthy controls to infer altered tissue state. For clinicians and researchers studying small datasets, rare cases, or individual patients, this approach is clearly inappropriate. We recently developed a framework to advance dMRI-based tractometry towards single-subject analysis. By 1) operating on the manifold of white matter pathways and by 2) learning normative microstructural features to better discriminate patients from controls, our framework successfully identified idiosyncrasies in patterns along brain white matter pathways in individuals with focal cortical dysplasia (FCD).
Introduction
Focal cortical dysplasia (FCD), a malformation of cortical development, is the most common etiology in drug-resistant neocortical partial epilepsies [1]. While complete resection is the main predictor of seizure freedom following surgery [2], a significant proportion of FCDs may be missed with standard clinical imaging protocols [1]. Diffusion MRI-based approaches increase the sensitivity of diagnostic features, but this is at the group level [3,4]. For clinical adoption, inferences must be made in individuals. To this end, normative modelling (which has shown great promise in psychiatry [5]) is an emerging framework that typically involves calculating reference ranges from normative data and identifying outliers. Here we report a case study, which to our knowledge, is the first-ever application of deep anomaly detection to FCD detection in epilepsy.Methods
Participants:Subject 1 is a 20-year-old female with seizures starting at the age of 16, described as a fuzzy painful sensation in the torso rising up to the head associated with mumbling sounds, occurring 2-5 times per day. Scalp video-EEG showed left temporal inter-ictal epileptiform discharges and left temporal EEG onset. Clinical imaging demonstrated a small area of cortical-white matter junction blurring in the laterobasal left temporal lobe associated with a transmantle area of T2 hyperintensity, suggestive of FCD type II [6]. Neuropsychological assessment was concordant, additionally revealing preserved mesial structures manifesting in relatively preserved verbal memory performance. Subsequent stereo-EEG (SEEG) implantation confirmed ictal onset and prominent interictal discharges from neocortical contacts immediately behind the MRI lesion; in addition, neocortical discharges were seen in SEEG contacts close to the temporal pole.
Subject 2 is a 47-year-old female with focal onset seizures since the age of 9, occurring daily with episodes of loss of contact, grimacing and limb stiffening hypermotor movements, including clutching at nearby object on the left side. Scalp video-EEG findings were consistent with frontal onset seizure semiology no clear ictal EEG changes. Clinical MRI showed blurring of the cortical-white matter junction between the right posterior superior frontal gyrus and the adjacent precentral gyrus, and a transmantle sign on T2/FLAIR from the cortex reaching all the way to the lateral ventricle, consistent with FCD type II. Subsequent stereo-EEG recordings demonstrated spatial overlap between primary motor areas and early ictal onset, and hence she did not proceed to surgery.
Data acquisition:
Diffusion MRI data were acquired on a Siemens 3T Connectom MRI scanner with 60 directions at b = 1200, 3000 and 5000 s/mm2 and 1.2×1.2×1.2mm3 voxels (TE/TR: 68/5400 ms, Δ/δ: 31.1/8.5 ms). 15 healthy controls (age 14-28) from the computational diffusion MRI database [7] were used to establish the normative range of tract profiles.
Preprocessing:
Each dataset was corrected for Gibbs ringing, signal drift, motion, susceptibility-induced distortions, and gradient non-linearities [8]. Next, rotationally-invariant spherical harmonics (RISH) features [9] were derived for each subject using the b = 5000 s/mm2 shell and automated white matter tract segmentation was done using TractSeg [10].
Anomaly detection:
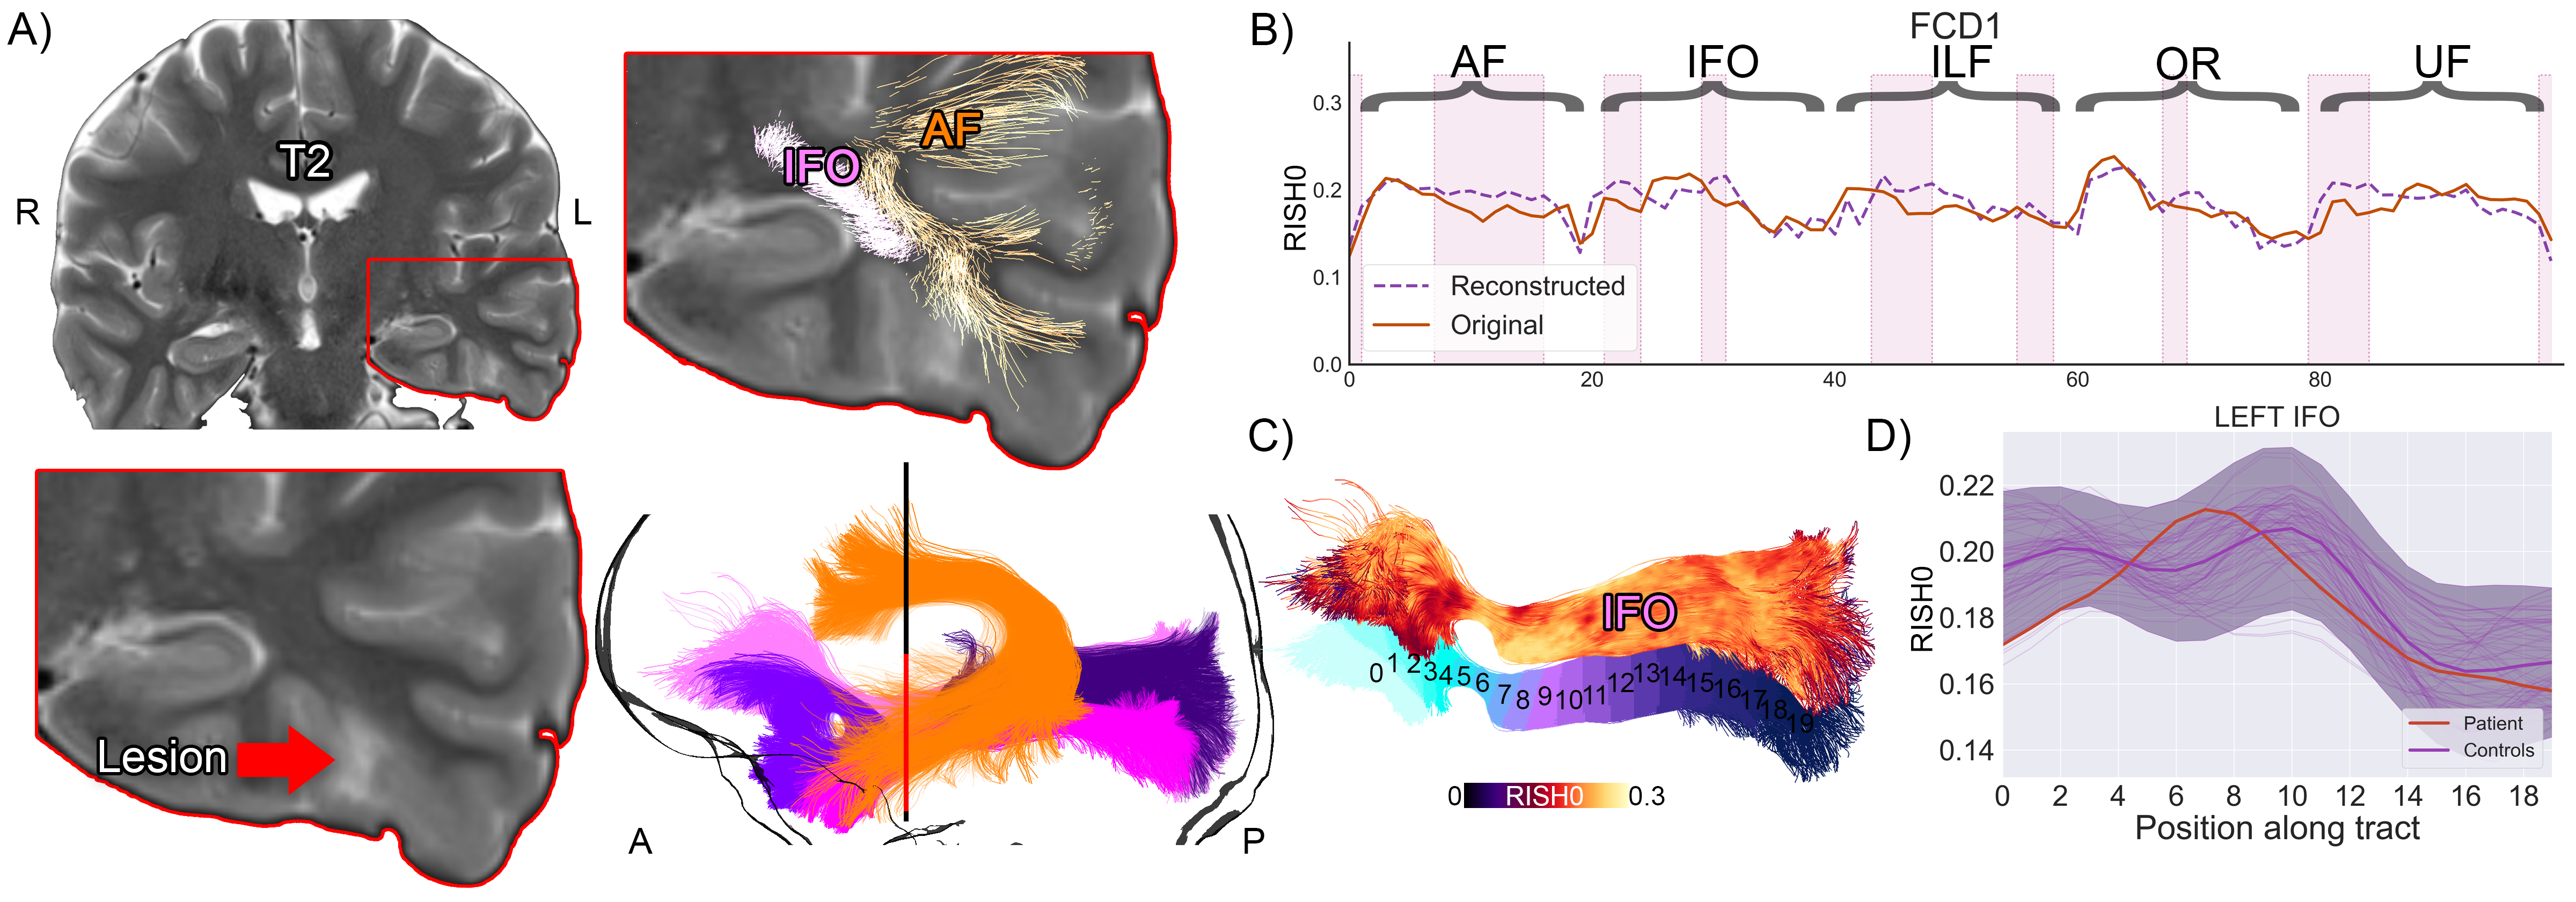
Tractometry [8,11] was performed, sampling RISH (0th order) at 20 locations along the tracts (from left-to-right for commissural tracts, anterior-to-posterior for association pathways and top-to-bottom for projection pathways). The resulting tract profiles were concatenated to form a feature vector for each subject [12]. A 5-fold data augmentation was applied to the controls tract-profiles using a Synthetic Minority Over-sampling TEchnique (SMOTE [13]) resulting in 75 normative data points. Finally, an unsupervised deep autoencoder was trained to detect anomalies [12] using a leave-one-out-cross-validation (LOOCV) permutation approach. Data were also analyzed with a conventional z-score approach.
Results
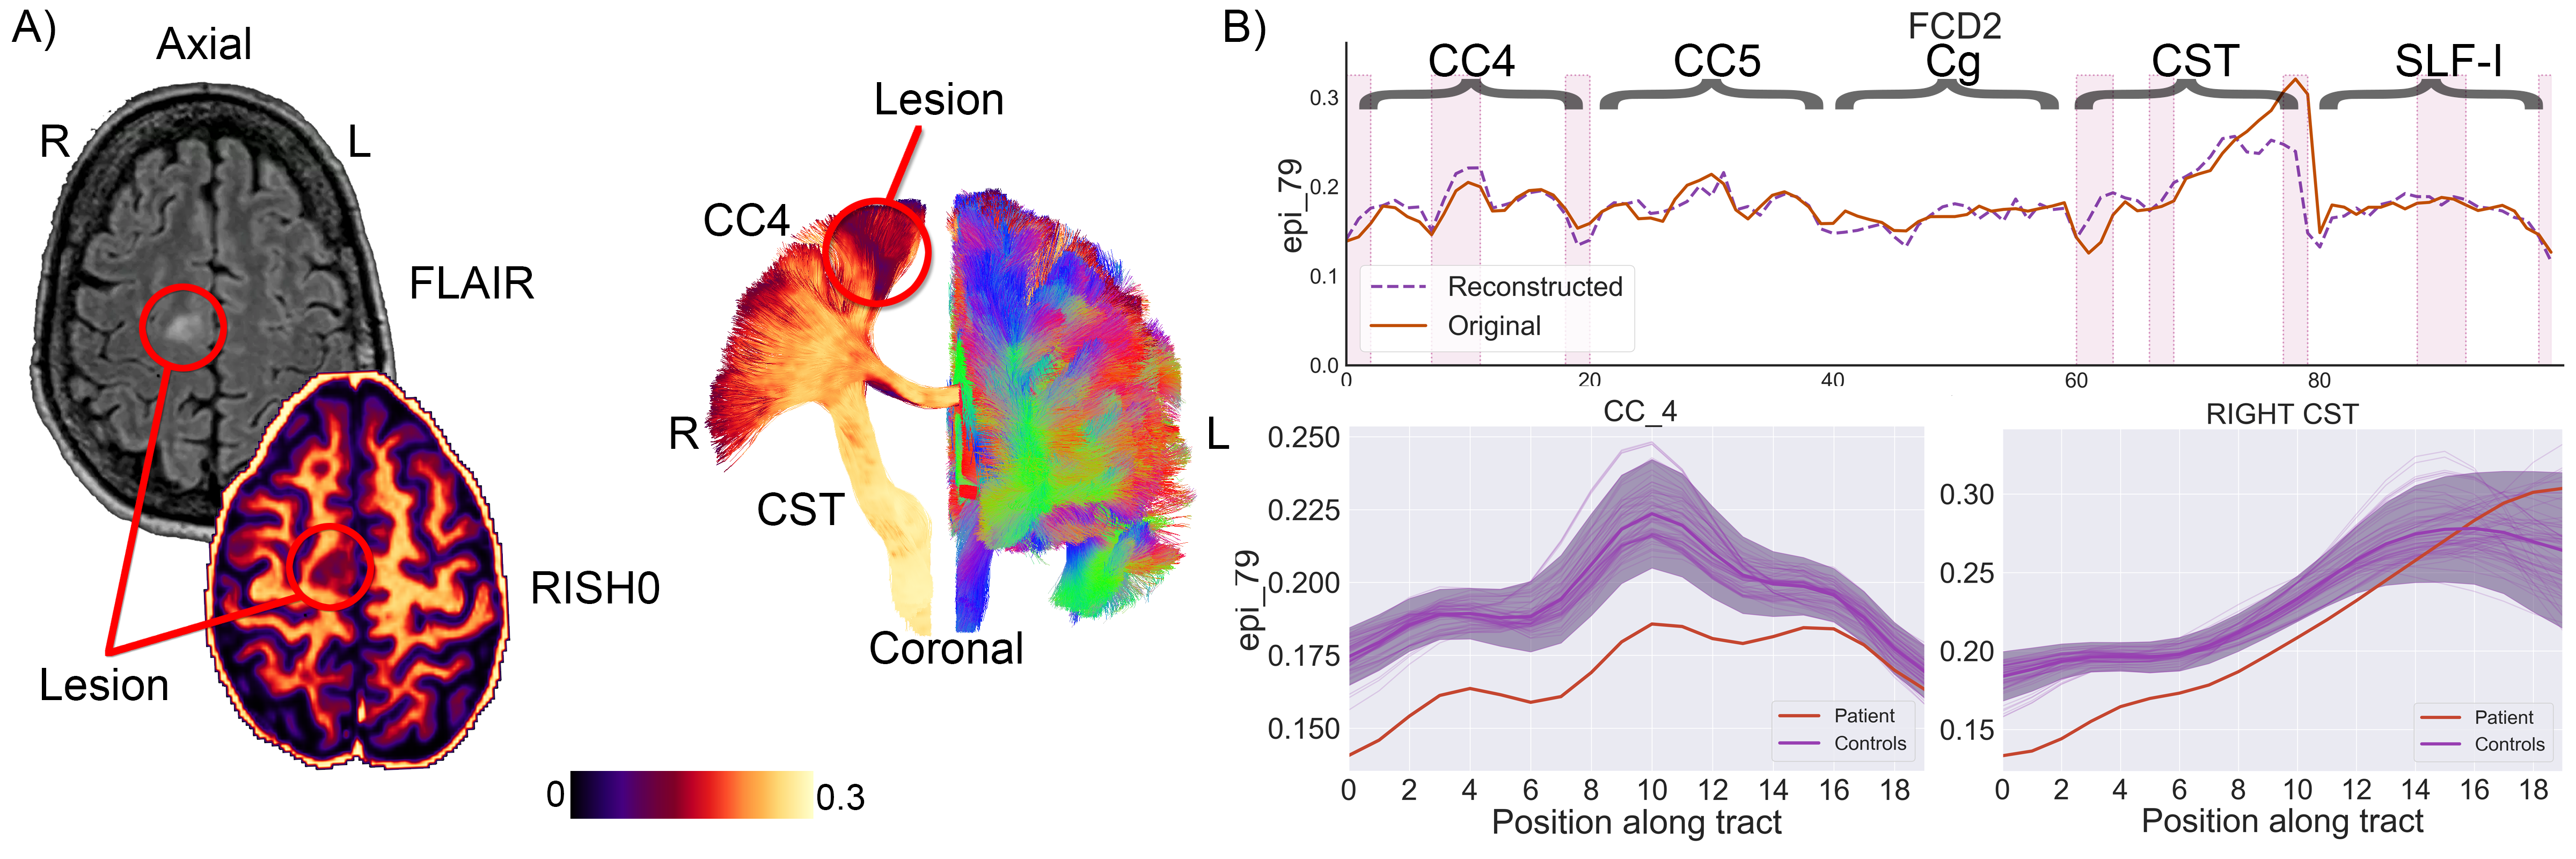
For Subject 1, five tracts of possible relevance were interrogated (Fig. 1). Microstructural anomalies were identified along the left inferior longitudinal fasciculus (ILF) and optic radiation (OR) in the immediate proximity of the T2-weighted changes corresponding to the epicentre of ictal discharges on stereo-EEG. Anomalies in the temporal portions of the left inferior fronto-occipital (IFO) and uncinate fasciculi (UF) pointed towards the temporal pole corroborating the SEEG findings that despite normal clinical MRI this area was a part of the seizure network.For Subject 2, five tracts of possible relevance were interrogated with our framework (Fig. 2). Anomalies were detected corresponding to radiological and electrophysiological findings along the right corticospinal-tract (CST), primary motor (CC4), and superior longitudinal fasciculus (SLF-I) beyond the visible lesion. No anomalies were found along the right cingulum (Cg) and primary sensorimotor (CC5) regions.
Discussion
In a clinical context, the usefulness of the proposed deep learning framework is twofold. First, it succeeded in detecting white matter anomalies that a conventional Z-score based approach was not sensitive to, potentially due to hidden interactions between the features; while the examples shown here had radiological changes detectable with T2 sequences, the method could be extended to cases of "MRI-negative" partial epilepsy increasing the diagnostic yield. Second, the detection of abnormal microstructural features away from putative seizure onset zone, as demonstrated in the first example, may contribute to the mapping of epileptogenic networks in individuals.Conclusion
The n=1 approach to detect deep white matter anomalies illustrated here will facilitate the identification of individualised therapy most appropriate to that patient, forming a baseline biomarker for subsequent monitoring through a therapeutic process.Acknowledgements
This work was supported by a Wellcome Trust Investigator Award (096646/Z/11/Z), a Wellcome Trust Strategic Award (104943/Z/14/Z), and an EPSRC equipment grant (EP/M029778/1) to DKJ, a Sir Henry Wellcome Fellowship (215944/Z/19/Z) to CMWT, and a Wellcome Trust GW4-CAT Fellowship (220537/Z/20/Z) to DS. The authors would like to acknowledge the support from the Brain Repair and Intracranial Neurotherapeutics (BRAIN) and Health and Care Research Wales.
References
1. Lerner, Jason T., et al. "Assessment and surgical outcomes for mild type I and severe type II cortical dysplasia: a critical review and the UCLA experience." Epilepsia 50.6 (2009): 1310-1335.
2. Rowland, Nathan C., et al. "A meta-analysis of predictors of seizure freedom in the surgical management of focal cortical dysplasia." Journal of neurosurgery 116.5 (2012): 1035-1041.
3. Duncan, John S., et al. "Brain imaging in the assessment for epilepsy surgery." The Lancet Neurology 15.4 (2016): 420-433.
4. Winston, Gavin P., et al. "Advanced diffusion imaging sequences could aid assessing patients with focal cortical dysplasia and epilepsy." Epilepsy research 108.2 (2014): 336-339.
5. Marquand, Andre F., et al. "Understanding heterogeneity in clinical cohorts using normative models: beyond case-control studies." Biological psychiatry 80.7 (2016): 552-561.
6. Blümcke, Ingmar, et al. "The clinicopathologic spectrum of focal cortical dysplasias: A consensus classification proposed by an ad hoc task force of the ILAE Diagnostic Methods Commission 1." Epilepsia 52.1 (2011): 158-174.
7. Tax, Chantal MW, et al. "Cross-scanner and cross-protocol diffusion MRI data harmonisation: A benchmark database and evaluation of algorithms." NeuroImage 195 (2019): 285-299.
8. Chamberland, Maxime, et al. "Dimensionality reduction of diffusion MRI measures for improved tractometry of the human brain." NeuroImage 200 (2019): 89-100.
9. Mirzaalian, Hengameh, et al. "Inter-site and inter-scanner diffusion MRI data harmonization." NeuroImage 135 (2016): 311-323.
10. Wasserthal, Jakob, Peter Neher, and Klaus H. Maier-Hein. "TractSeg-Fast and accurate white matter tract segmentation." NeuroImage 183 (2018): 239-253.
11. Bells, Sonya, et al. Tractometry–comprehensive multi-modal quantitative assessment of white matter along specific tracts. In Proc. ISMRM Montreal (Vol. 678, p. 1), 2011.
12. Chamberland, Maxime, et al. "Tractometry-based Anomaly Detection for Single-subject White Matter Analysis." Medical Imaging in Deep Learning, arXiv preprint arXiv:2005.11082 (2020).
13. Chawla, Nitesh V., et al. "SMOTE: synthetic minority over-sampling technique." Journal of artificial intelligence research 16 (2002): 321-357.
Figures