1039
On the Spectrum of Dysmaturation of the Extremely Preterm Brain at Adolescence: Combined MS-qMRI Outcomes of the ELGAN-ECHO Study.1Boston University, Boston, MA, United States, 2Boston University Medical Center, Boston, MA, United States, 3University of North Carolina at Chapel Hill School of Medicine, Chapel Hill, NC, United States
Synopsis
Purpose: To describe the spectrum of MS-qMRI outcomes in the extremely preterm (EP) brain at adolescence and identify relationships expressed as a result of dysmaturation. Methods: Quantitative MR algorithms create maps of the T1, T2, PD, and spatial entropy (SE) for 341 EP born individuals using MR images obtained with the Tri-TSE pulse sequence at age 15 years. Results: The EP brain exhibits linear relationships of T1 and PD with SE, and T2 with cerebrospinal fluid (CSF) volume. Conclusion: MS-qMRI of the EP brain provides a comprehensive quantification of dysmaturation states, from white matter structure to CSF composition.
Introduction
While survival rates of children born extremely preterm (EP) (gestational age < 28 weeks) have greatly increased, they remain at an elevated risk of neurological disability due in part to perinatal infection and systemic inflammation, which may induce altered central nervous system architecture throughout aging1. Nonetheless, high incidence of neurological disability persists in survivors; from motor to cognitive, attentional, behavioral, and socialization disturbances2. These individuals are also highly vulnerable to a variety of white matter injuries (WMI), and white and gray matter (GM) disturbances3, leading to altered tissue development, termed dysmaturation. Quantitative magnetic resonance imaging (qMRI) can guide developments of neuroprotective and neurorestorative interventions to dysmaturation2, as it generates rich information related to tissue structure and composition without ionizing radiation. In this multisite study, the spectrum of MS-qMRI variables is described for a complete characterization of the dysmaturation states in the EP brain at adolescence. Furthermore, the purpose of this study is to establish relationships between tissue measures of hydration, MR relaxometry, microstructural organization (spatial entropy), and gross volumetrics.Methods
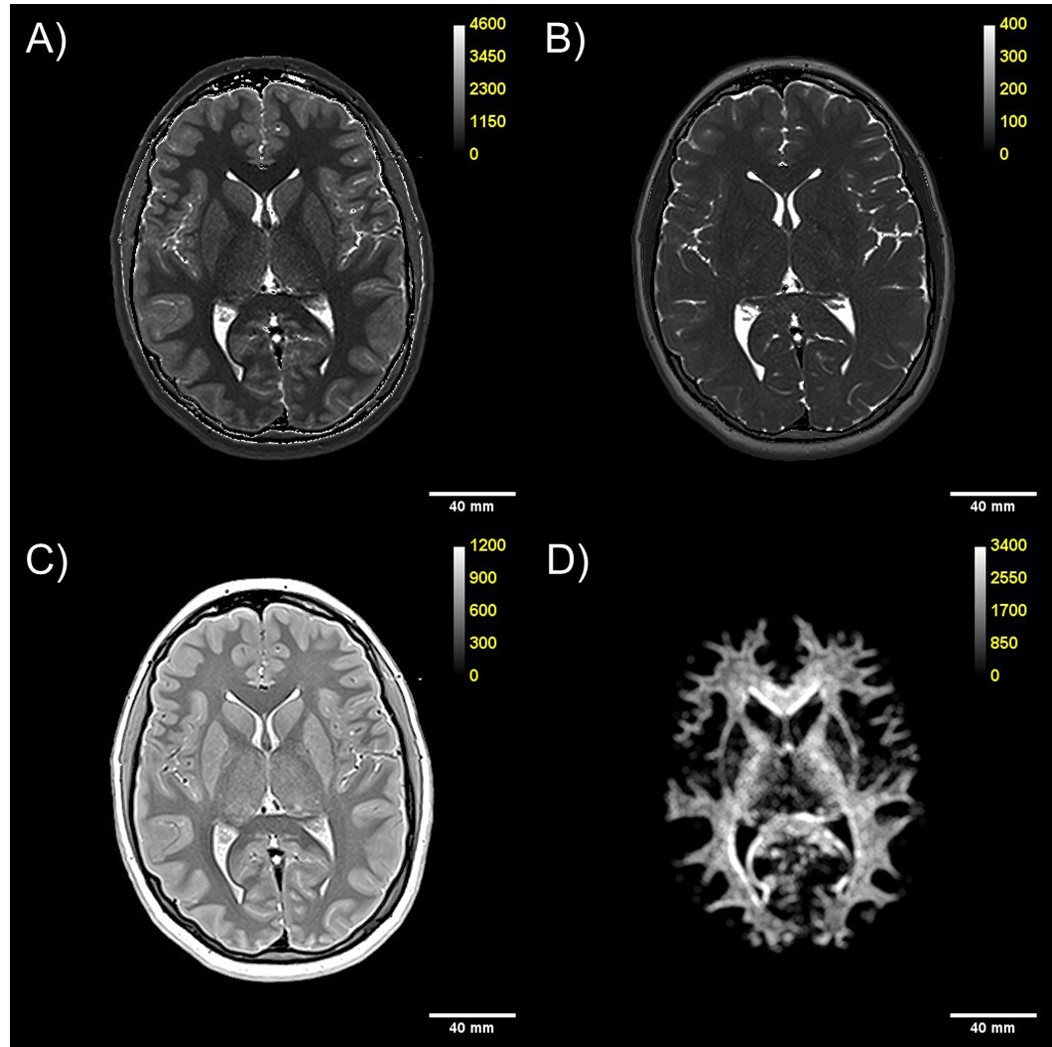
This study was approved by the Institutional Review Boards of the 12 participating institutions of the Extremely Low Gestational Age Newborn (ELGAN-ECHO) study. A cohort of 341 EP born individuals at ages 14-16 (49.3% male) were scanned with a 3T MRI protocol using the triple turbo spin echo pulse sequence. This triple weighting acquisition consists of concatenated long repetition time dual echo turbo spin echo (DE-TSE) and short repetition time single echo turbo spin echo (SE-TSE) sequences implemented with identical scan geometry and receiver settings. Scan parameters were TEeff1, 2 of 12ms and 102ms, TRlong of 10s, and TRshort of 0.5s. Multispectral qMRI algorithms were derived according to the Bloch equation of the Tri-TSE pulse sequence that is applicable across three vendors (Philips, Siemens, and GE), and developed with Python 3.7 in the Enthought Deployment Manager. Co-registered maps of T1, T2, and PD were harmonized for all 12 institutions by iterative minimization of inter-scanner inhomogeneity of mean white matter values. Spatial entropy (SE) mapping algorithms were developed with python entropy functions and implemented on R1-weighted Synthetic-MRI images of white matter texture, segmented via dual-clustering algorithms. Mean values of T1, T2, PD, and SE were calculated for the global white matter in the cerebrum and cerebellum. Linear regression analysis was performed to assess whether a significant association exists between MS-qMRI of the white matter (P < 0.05).Results
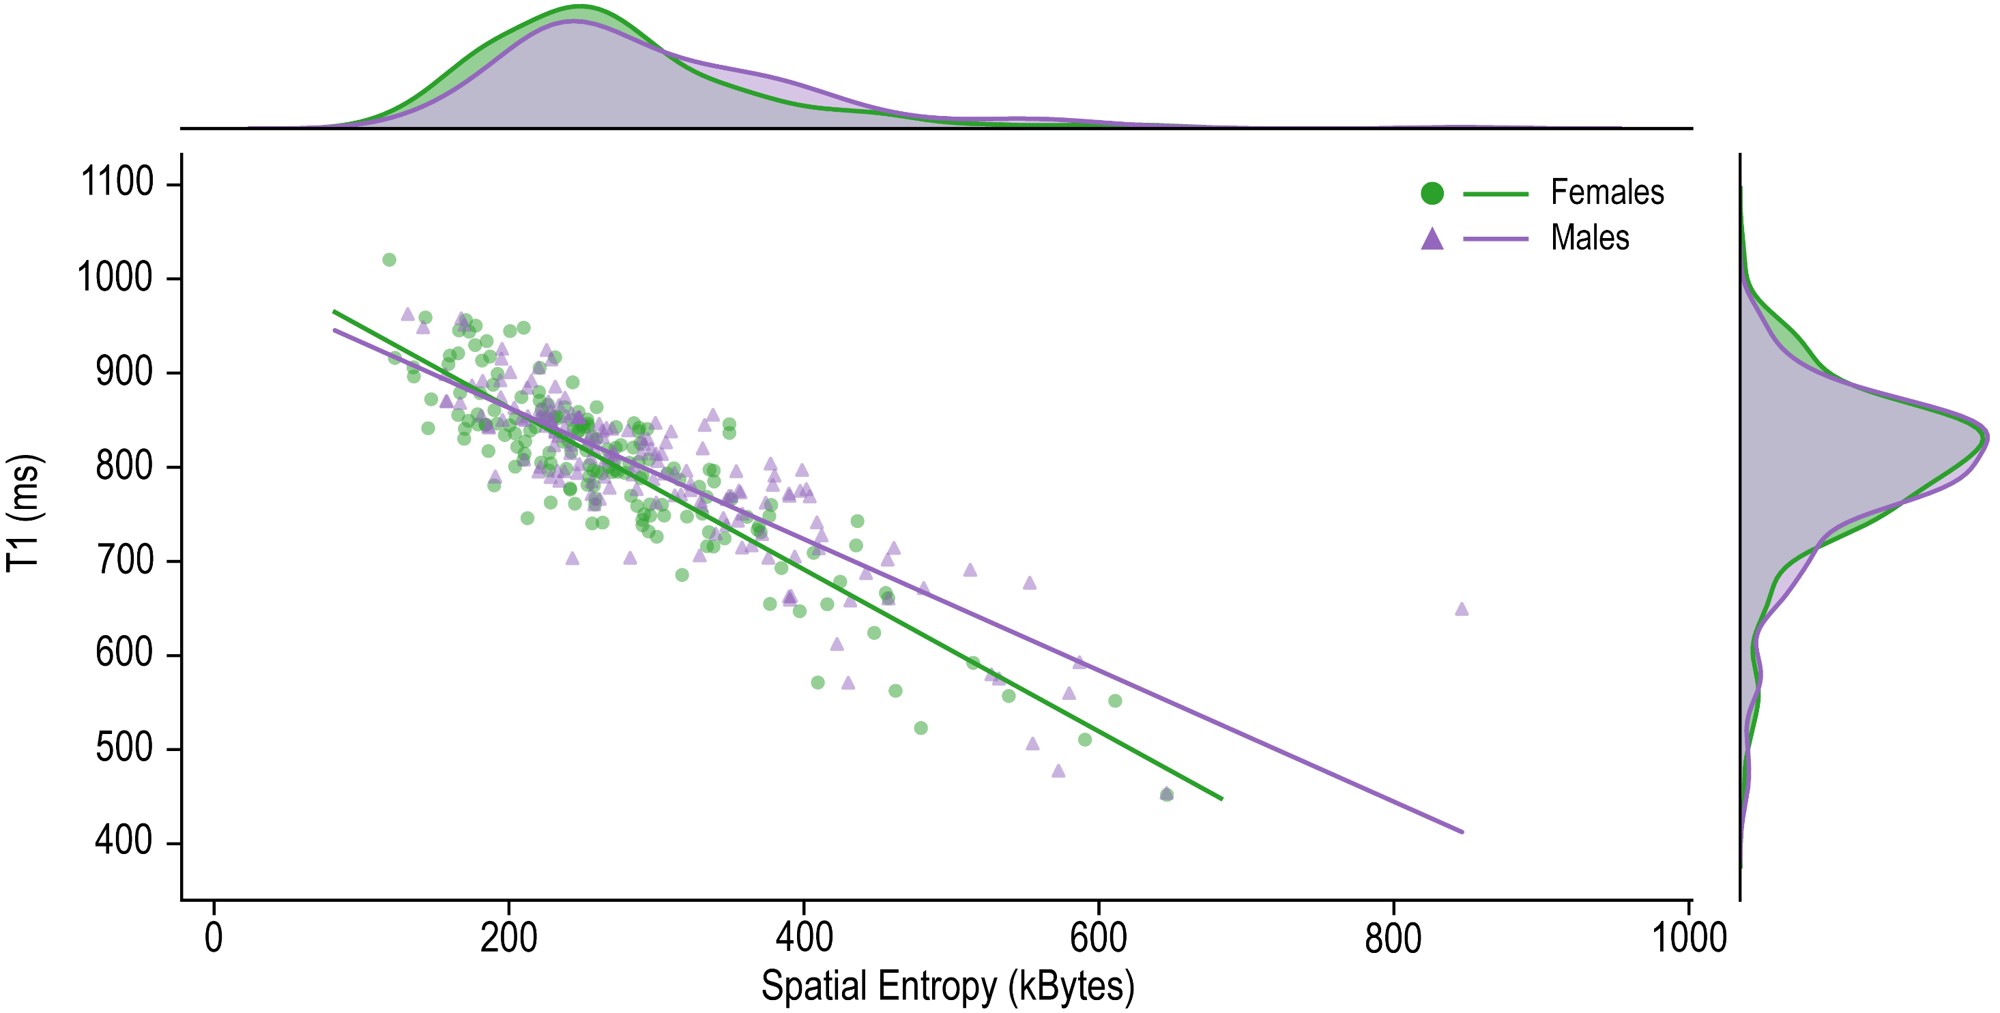
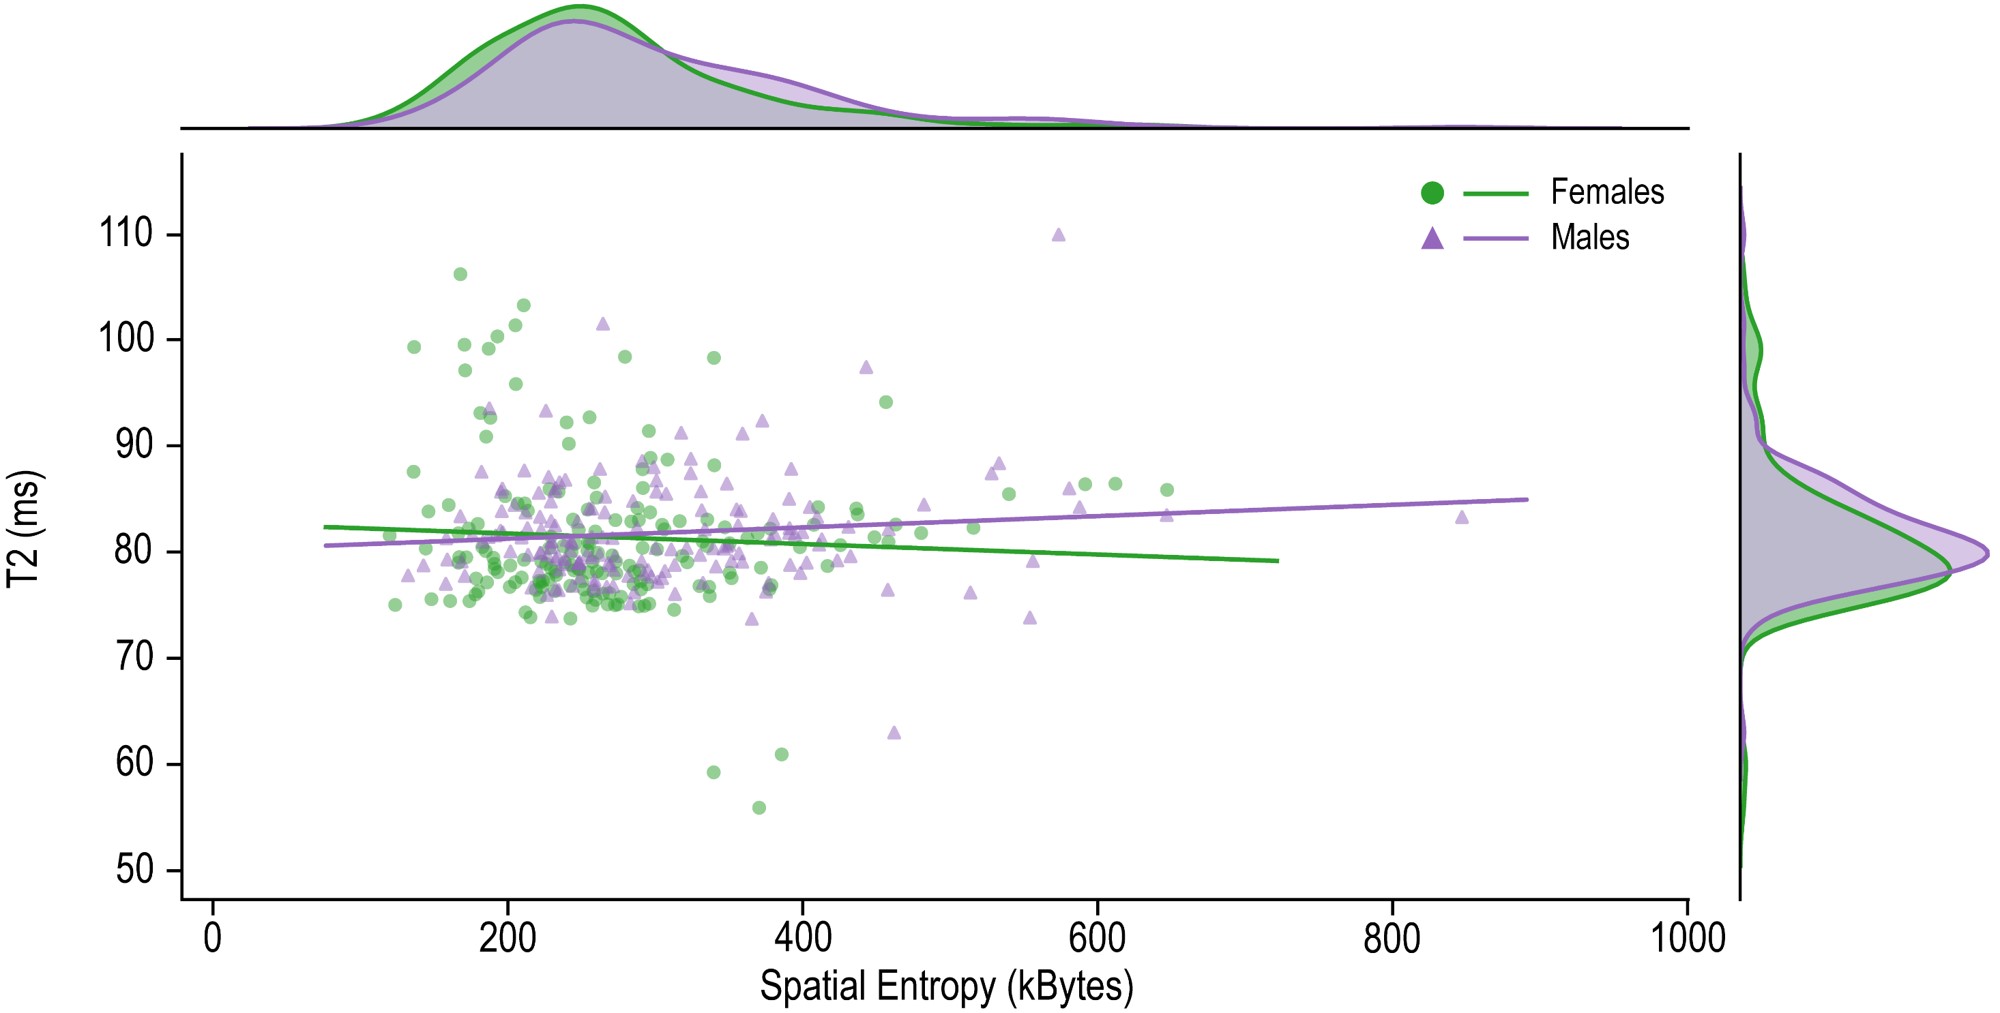
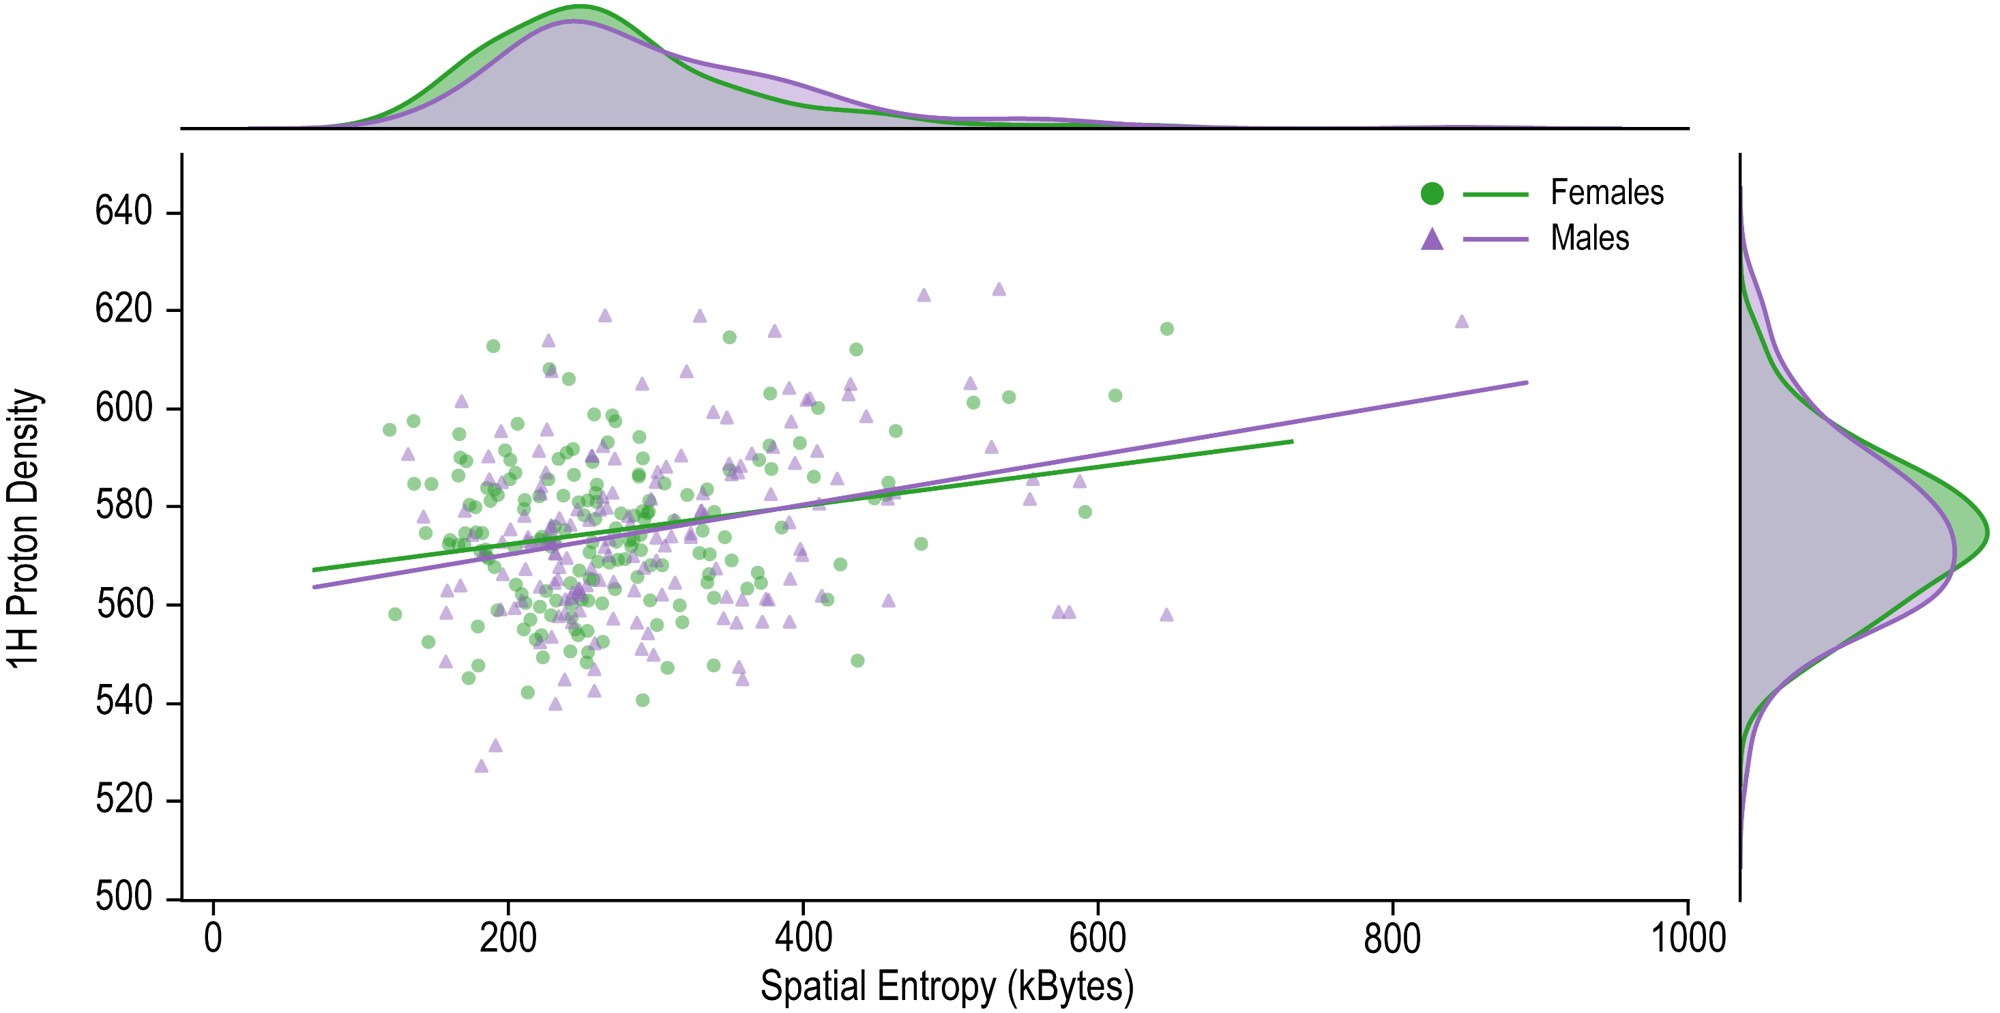
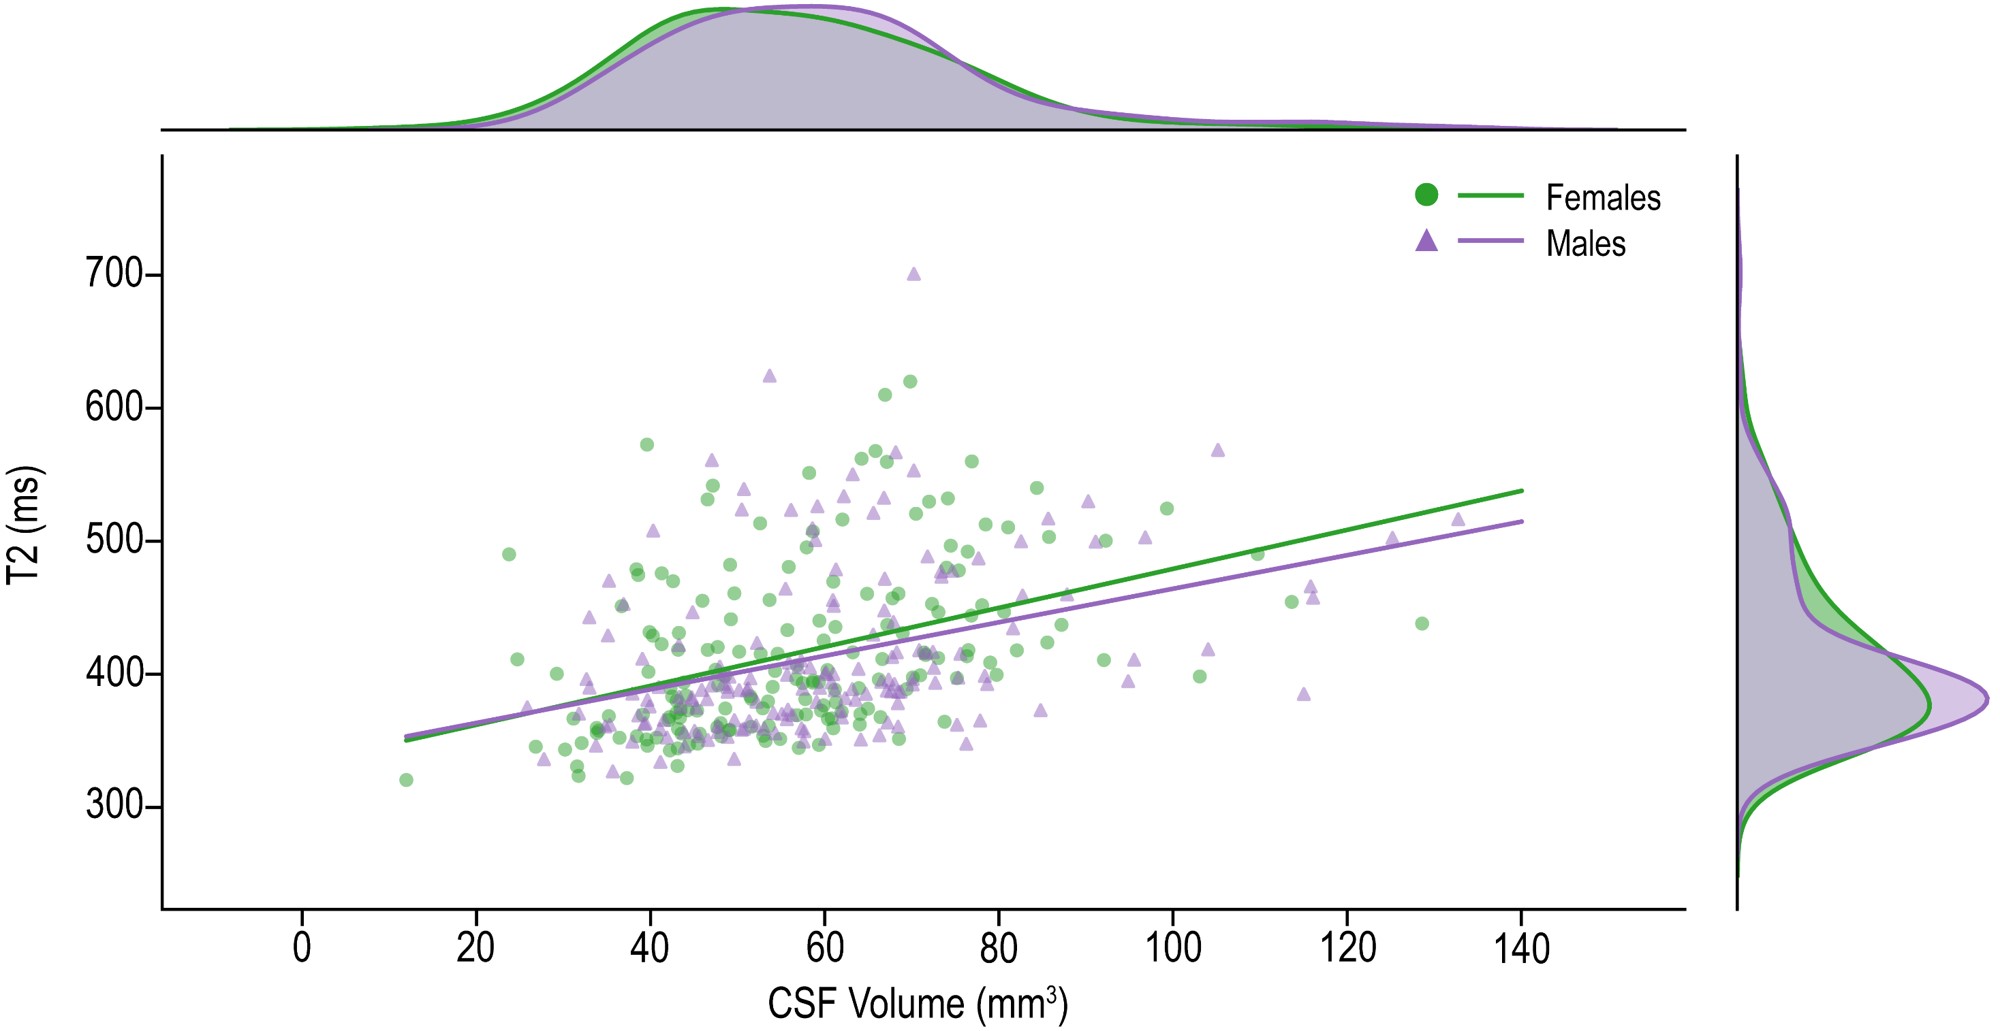
Selection bias within the cohort was removed by ensuring an equivalent distribution and statistical similarity of mean gestational age (mean, 26.2 wk), birth weight (mean, 832.0 g), and scan age (mean, 15.4 yr) within 1% of the overall sample means (465 study participants). Representative T1, T2, PD, and SE maps were successfully calculated (Figure 1). On average, there is no statistical difference between the white matter T1 of EP males and females, while males on average exhibit a 10.3% increase in microstructure complexity (P = 0.004). Global evaluation of the total WM in the cerebrum and cerebellum compartments revealed a statistically significant inverse relationship between T1 and spatial entropy in both females (P < 0.001; regression coefficient, -0.85; 95% CI: -0.92, -0.78; R2, 0.774) and males (P < 0.001; regression coefficient, -0.70; 95% CI: -0.76, -0.63; R2, 0.729; Figure 2). PD also exhibited statistically significant relationships with SE in females (P = 0.002; regression coefficient, 0.040; 95% CI: 0.015, 0.065; R2, 0.054) and males (P < 0.001; regression coefficient, 0.051; 95% CI: 0.026, 0.076; R2, 0.091; Figure 4); however, there is high variability. There was no significant correlation between T2 and spatial entropy in females (P = 0.4) or males (P = 0.1; Figure 3). Global evaluation of the cerebrospinal fluid (CSF) in both compartments revealed a statistically significant positive relationship between T2 and volume in both females (P < 0.001; regression coefficient, 1.48; 95% CI: 1.00, 1.97; R2, 0.174) and males (P < 0.001; regression coefficient, 1.27; 95% CI: 0.80, 1.75; R2, 0.143; Figure 5). These relationships are consistent when considering the cerebrum and cerebellum separately.Discussion and Conclusions
In this study, we observed a broad distribution of dysmaturation states, particularly for white matter, likely associated with adverse events stemming from extremely preterm birth. This is documented here via direct tissue measures of hydration (PD), indirect measures of tissue cellularity and integrity (T1 and T2), and direct metrics of microstructural organization (SE). Key findings: 1. Significant correlations of T1 and PD with the microstructural complexity measured by SE were identified, highlighting the dependencies of dysmaturity and tissue composition. 2. T2 of CSF is positively correlated with fluid volume, possibly indicating less osmolarity to maintain brain homeostasis in the context of ventriculomegaly. Further studies are needed to confirm these findings, and to correlate them with adverse clinical outcomes and perinatal inflammatory antecedents.Acknowledgements
This work was supported in part by the National Institute of Neurological Disorders and Stroke (5U01NS040069-05 and 2R01NS040069-09), National Institutes of Health Office of the Director (1UG3OD022348-01), and the National Institute of Child Health and Human Development (5P30HD018655-28).References
1. O'Shea T, Allred E, Dammann O, et al. The ELGAN study of the brain and related disorders in extremely low gestational age newborns. Early human development 2009;85(11):719-725.
2. Volpe JJ. Dysmaturation of premature brain: importance, cellular mechanisms, and potential interventions. Pediatric neurology 2019;95:42-66.
3. Back SA. White matter injury in the preterm infant: pathology and mechanisms. Acta neuropathologica 2017;134(3):331-349.
Figures