1038
Early Diagnosis of Dementia (AD/MCI/Normal Aging) Based on CBF-Maps Derived from ASL–MRI and Artificial Intelligence1Department of Radiology, Zanjan University of Medical Science, Zanjan, Iran (Islamic Republic of), 2Department of Medical Physics and Biomedical Engineering, Tehran University of Medical Sciences, Tehran, Iran (Islamic Republic of), 3Department of Neurology, Zanjan University of Medical Science, Zanjan, Iran (Islamic Republic of), 4Department of Computer and Electrical Engineering, University of Kashan, Kashan, Iran (Islamic Republic of), 5Tehran Islamic Azad University, Tehran, Iran (Islamic Republic of), 6Quantitative MR Imaging and Spectroscopy Group, Research Center for Molecular and Cellular Imaging, Department of Medical Physics and Biomedical Engineering, Tehran university of Medical Science, Tehran, Iran (Islamic Republic of)
Synopsis
This study aims to investigate the use of high-level de-noising and machine-learning methods applied on ASL-MRI dataset acquired at 1.5T, and in order to to find important regions in the brain for the classification of patients with AD and MCI and normal aging. Automated classification and prediction methods recognizing perfusion changes in specific subregions of the brain are applied to pseudo-continuous ASL-derived CBF-maps, predicting the diagnosis of Alzheimer's disease, mild cognitive impairment, and normal cognition. Due to alarming prevalence of AD, machine-learning approaches for ASL- MRI are used to develop computer-aided diagnosis (CAD) tools for clinical and screening targets, assisting early diagnosis of the AD process.
Introduction
Dementia is a major health challenge in the current century with a growing prevalence(1-4). Many studies have been conducted to find appropriate biomarkers for early diagnosis of AD in recent years(5,6). CBF-maps measured by ASL-MRI might be a good imaging marker for individual-level classification to differentiate normal aging from MCI and AD(7-14). This study aims to investigate the use of high-level de-noising and machine-learning methods applied on the ASL-MRI dataset acquired at 1.5T, and in order to to find important regions in the brain for the classification of patients with AD and MCI and subjects with normal cognition.Materials and Methods
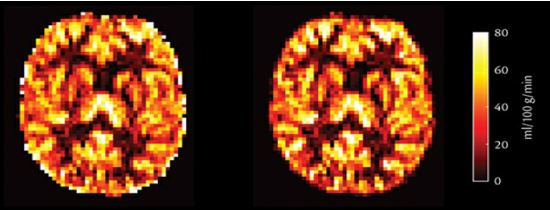
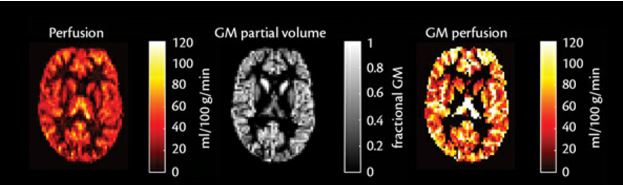
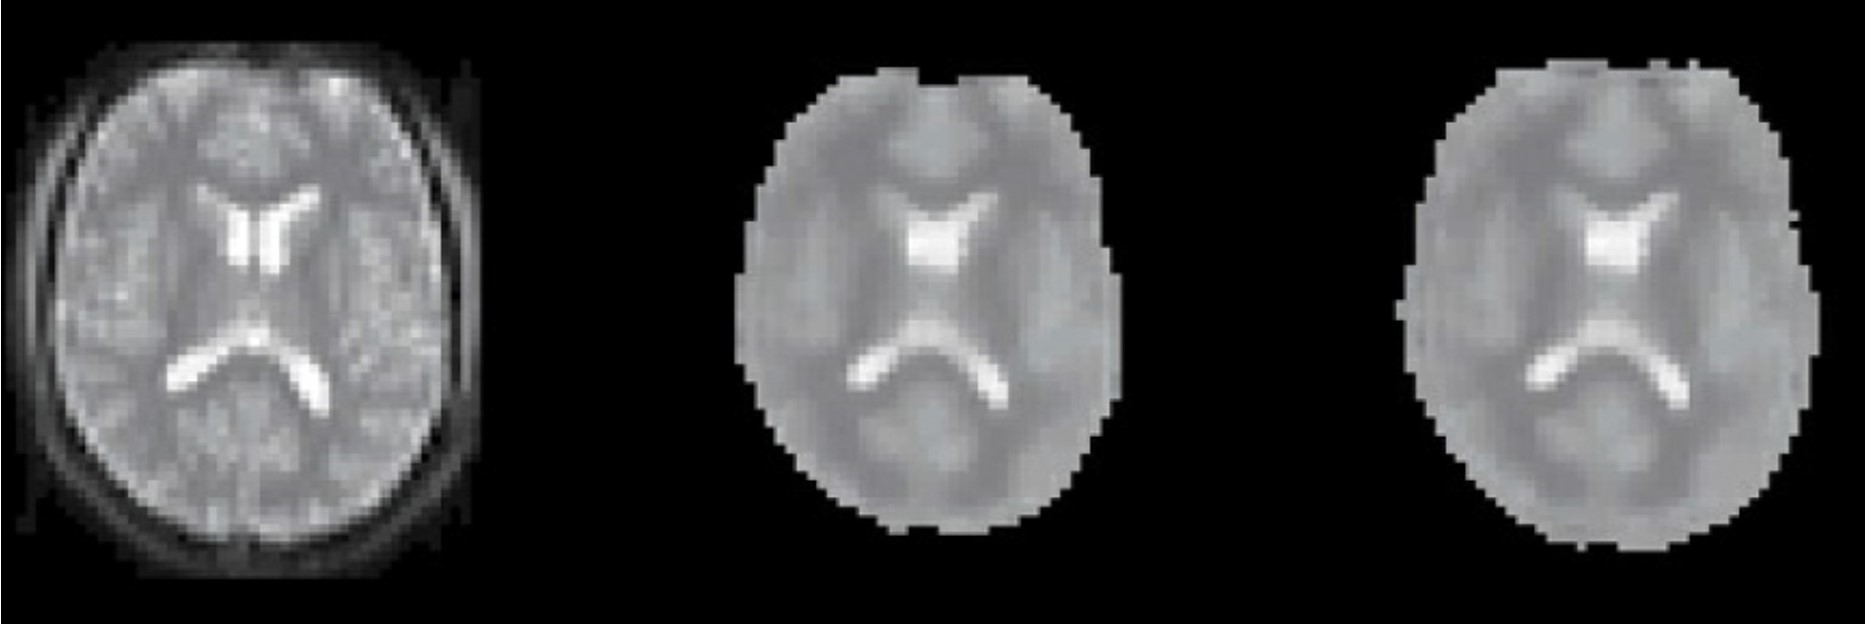
In this cross-sectional study, 13 patients with AD, 8 patients with MCI, and 12 subjects with normal cognitive status underwent pseudo-continuous ASL-MR imaging. Pre-processing and high-level de-noising techniques, as well as correction for partial volume effects, were performed.(figure1-3) Pre-processing was followed by an ROI-based approach. For the T1-weighted anatomical scans, the most commonly used ALL atlas was selected. CBF map was derived from the general Kinetic Model. Mean, SD, min, max indices for rCBF are computed over significant regions affected by Alzheimer's disease (AD) pathology. these features are modeled by using classification methods namely XGboost, RandomForest, KNeighborsClassifier, Light GBM Classifier and RidgeClassifier then the mentioned models are stacked in the second layer. rCBF maps were compared between groups by using analysis of variance and ROIs with significant group differences were recognized. Analyses were corrected for age and sex differences. This study was approved by the local institutional review board and all the subjects submitted written informed consent forms.Results
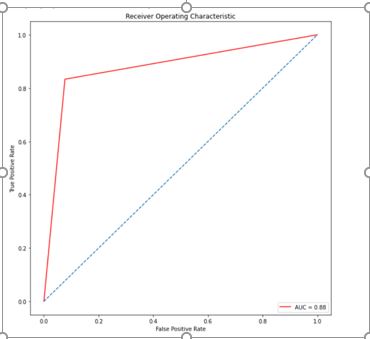
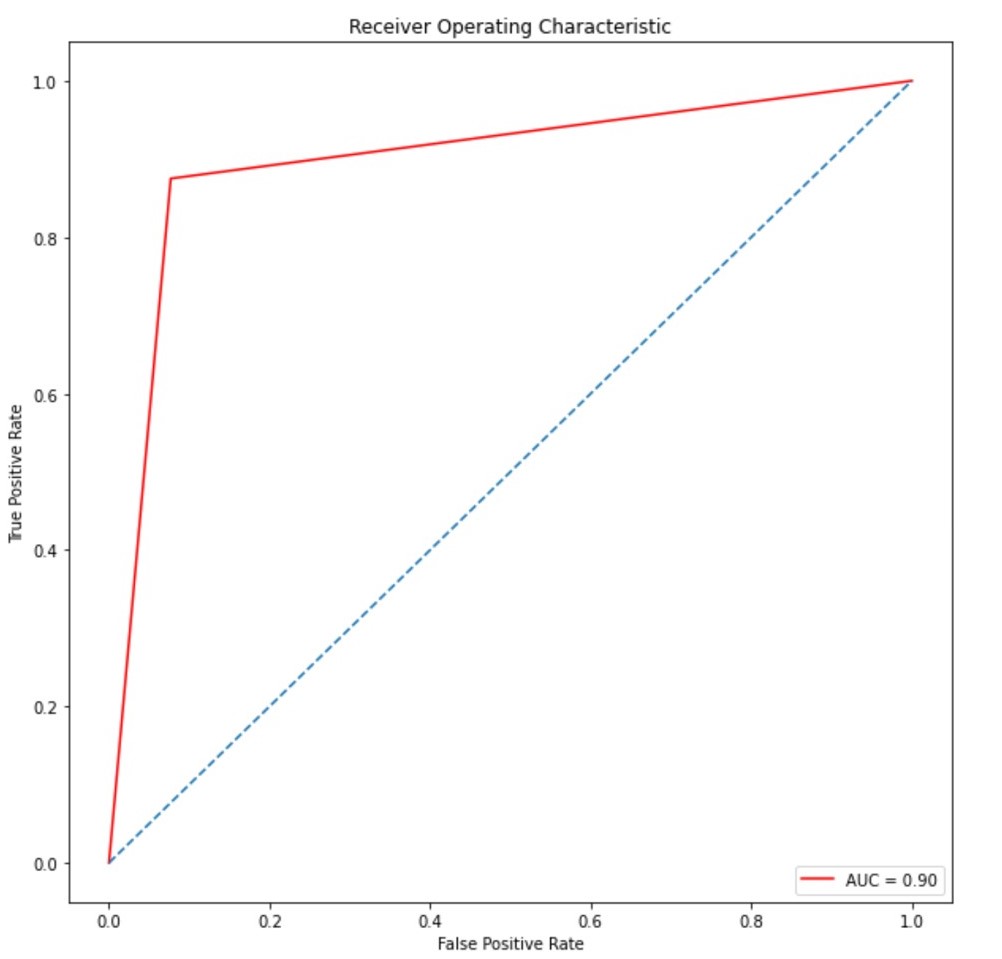
Based on the type of comparison between classes, methods RandomForest and XGboost showed the excellent performance to distinguish AD versus normal cognitive group (ACC: 100%, AUC: 0.88), AD versus MCI (acuracy:%88, AUC: 0.90) and MCI versus normal cognitive group (ACC: 95%, AUC: 1).(figure 4,5) In AD, the CBF value was decreased compared with the normal cognitive group with the greatest reduction in middle parietal, inferior parietal, precuneus, posterior cingulate, and angular gyrus (p <.001). Also increased CBF value was seen in the insula (P <.001). In AD compared with MCI, CBF value was decreased significantly in the precuneus (p <.001) and moderately in the posterior cingulate gyrus (p = 0.01) and middle parietal lobe (p = 0.006). In MCI versus normal cognitive group, CBF value was decreased significantly in the inferior parietal (p <.001), moderately in the angular gyrus (p = 0.005), and weakly in the posterior cingulate gyrus (p = 0.09). Also, CBF value increased significantly in the insula (p <.001) and moderately in the putamen (p = 0.008). Besides, cognitive status assessed by Mini-Mental State Exam (MMSE) was strongly associated with CBF in the posterior cingulate, precuneus, inferior parietal, and angular gyrus.Discussion
Automated classification methods based on different regional CBF-maps measured by pseudo-continuous ASL-MRI can differentiate between AD, MCI, and normal aging with high accuracy and excellent AUC values. In the AD versus normal cognitive group, the most important differentiating feature was the combination of hypoperfusion in the inferior parietal, precuneus, posterior cingulate gyrus, angular gyrus, and hyperperfusion in the insula with significantly higher accuracy compared with previous studies in which the classification was based on structural MRI(15-19). Insular hyperperfusion would be a compensatory response. In AD versus MCI, hypoperfusion in the precuneus was the main differentiating feature. In MCI versus normal cognitive, the most efficient differentiating feature was the combination of hypoperfusion in the inferior parietal and hyperperfusion in the insula and putamen, showing much higher differential accuracy compared to previous studies (20,21). We hypothesize hypoperfusion in the inferior parietal as the earliest perfusion finding in the AD process, manifested in MCI to differentiate MCI from normal aging.Conclusion
Automated classification and prediction methods recognizing perfusion changes in specific subregions of the brain are applied to ASL-derived CBF-maps, predicting the diagnosis of Alzheimer's disease, mild cognitive impairment, and normal cognition. Due to the alarming prevalence of AD, machine-learning approaches for ASL- MRI is used to develop computer-aided diagnosis (CAD) tools for clinical and screening targets, assisting early diagnosis of the AD process.Acknowledgements
No acknowledgement found.References
1. Langa KM, Larson EB, Crimmins EM, Faul JD, Levine DA, Kabeto MU, et al. A Comparison of the Prevalence of Dementia in the United States in 2000 and 2012. JAMA Internal Medicine. 2017;177(1):51-8.
2. 2014 Alzheimer's disease facts and figures. Alzheimer's & Dementia. 2014;10(2):e47-e92.
3. Livingston G, Sommerlad A, Orgeta V, Costafreda SG, Huntley J, Ames D, et al. Dementia prevention, intervention, and care. The Lancet. 2017;390(10113):2673-734.
4. Rakesh G, Szabo ST, Alexopoulos GS, Zannas AS. Strategies for dementia prevention: latest evidence and implications. Therapeutic Advances in Chronic Disease. 2017;8(8-9):121-36.
5. Wolk DA, Detre JA. Arterial spin labeling MRI: an emerging biomarker for Alzheimer's disease and other neurodegenerative conditions. Curr Opin Neurol. 2012;25(4):421-8.
6. Wierenga CE, Hays CC, Zlatar ZZ. Cerebral Blood Flow Measured by Arterial Spin Labeling MRI as a Preclinical Marker of Alzheimer's Disease. Journal of Alzheimer's Disease. 2014;42:S411-S9.
7. Binnewijzend MAA, Kuijer JPA, Benedictus MR, van der Flier WM, Wink AM, Wattjes MP, et al. Cerebral Blood Flow Measured with 3D Pseudocontinuous Arterial Spin-labeling MR Imaging in Alzheimer Disease and Mild Cognitive Impairment: A Marker for Disease Severity. Radiology. 2013;267(1):221-30.
8. Ding B, Ling H-w, Zhang Y, Huang J, Zhang H, Wang T, et al. Pattern of cerebral hyperperfusion in Alzheimer’s disease and amnestic mild cognitive impairment using voxel-based analysis of 3D arterial spin-labeling imaging: initial experience. Clinical interventions in aging. 2014;9:493.
9. Alexopoulos P, Sorg C, Förschler A, Grimmer T, Skokou M, Wohlschläger A, et al. Perfusion abnormalities in mild cognitive impairment and mild dementia in Alzheimer’s disease measured by pulsed arterial spin labeling MRI. European archives of psychiatry and clinical neuroscience. 2012;262(1):69-77.
10. Zhang N, Gordon ML, Goldberg TE. Cerebral blood flow measured by arterial spin labeling MRI at resting state in normal aging and Alzheimer’s disease. Neuroscience & Biobehavioral Reviews. 2017;72:168-75.
11. Sierra-Marcos A. Regional cerebral blood flow in mild cognitive impairment and Alzheimer’s disease measured with arterial spin labeling magnetic resonance imaging. International journal of Alzheimer’s disease. 2017;2017.
12. Riederer I, Bohn KP, Preibisch C, Wiedemann E, Zimmer C, Alexopoulos P, et al. Alzheimer Disease and Mild Cognitive Impairment: Integrated Pulsed Arterial Spin-Labeling MRI and 18F-FDG PET. Radiology. 2018;288(1):198-206.
13. Alsop DC, Detre JA, Golay X, Günther M, Hendrikse J, Hernandez‐Garcia L, et al. Recommended implementation of arterial spin‐labeled perfusion MRI for clinical applications: a consensus of the ISMRM perfusion study group and the European consortium for ASL in dementia. Magnetic resonance in medicine. 2015;73(1):102-16.
14. Duan W, Sehrawat P, Balachandrasekaran A, Bhumkar AB, Boraste PB, Becker JT, et al. Cerebral Blood Flow Is Associated with Diagnostic Class and Cognitive Decline in Alzheimer’s Disease. Journal of Alzheimer's Disease. 2020(Preprint):1-18.
15. Teipel SJ, Born C, Ewers M, Bokde ALW, Reiser MF, Möller H-J, et al. Multivariate deformation-based analysis of brain atrophy to predict Alzheimer's disease in mild cognitive impairment. NeuroImage. 2007;38(1):13-24.
16. Bron EE, Smits M, van der Flier WM, Vrenken H, Barkhof F, Scheltens P, et al. Standardized evaluation of algorithms for computer-aided diagnosis of dementia based on structural MRI: The CADDementia challenge. NeuroImage. 2015;111:562-79.
17. Magnin B, Mesrob L, Kinkingnéhun S, Pélégrini-Issac M, Colliot O, Sarazin M, et al. Support vector machine-based classification of Alzheimer’s disease from whole-brain anatomical MRI. Neuroradiology. 2009;51(2):73-83.
18. Zhang Y-D, Wang S, Dong Z. Classification of Alzheimer disease based on structural magnetic resonance imaging by kernel support vector machine decision tree. Progress In Electromagnetics Research. 2014;144:171-84.
19. Klöppel S, Stonnington CM, Chu C, Draganski B, Scahill RI, Rohrer JD, et al. Automatic classification of MR scans in Alzheimer's disease. Brain. 2008;131(3):681-9.
20. Collij LE, Heeman F, Kuijer JPA, Ossenkoppele R, Benedictus MR, Möller C, et al. Application of Machine Learning to Arterial Spin Labeling in Mild Cognitive Impairment and Alzheimer Disease. Radiology. 2016;281(3):865-75.
21. Xekardaki A, Rodriguez C, Montandon M-L, Toma S, Tombeur E, Herrmann FR, et al. Arterial Spin Labeling May Contribute to the Prediction of Cognitive Deterioration in Healthy Elderly Individuals. Radiology. 2015;274(2):490-9.
Figures