1037
Evaluating Brain Iron Content in Patients with Idiopathic Rapid Eye Movement Sleep Behavior Disorder1Department of Radiology, Wayne State University, Detroit, MI, United States, 2SpinTech, Inc., Bingham Farms, MI, United States, 3Department of Radiology, Tianjin First Central Hospital, Tianjin, China, 4Department of Neurology, Tianjin Medical University General Hospital Airport Site, Tianjin, China, 5MR Collaboration, Siemens Healthcare Ltd, Beijing, China
Synopsis
Out of 29 idiopathic rapid eye movement behavior disorder (iRBD) patients and 28 age-matched healthy controls (HCs), 12 patients showed bilateral or unilateral loss of the N1 sign as opposed to two HCs with unilateral N1 loss. Additionally, both global and regional high susceptibility analyses showed significantly higher iron deposition in the right dentate nucleus (DN) along with significantly lower bilateral volume of the caudate nucleus in iRBD patients. These findings taken together with significant correlations between iron measurements and several cognitive and motor impairment scores may be indicative of biomarkers of an early neurodegenerative process in the iRBD patients.
Introduction
Rapid eye movement sleep behavior disorder (RBD) is recognized as the prodromal stage of α- synucleinopathies including Parkinson’s disease (PD), PD dementia, Lewy body dementia, and multiple system atrophy.1 Previous studies have shown cognitive dysfunction and subtle motor impairment in iRBD patients, which might be useful in predicting early conversion and the specific type of α-synucleinopathy. Iron metabolism has been a research focus in studying movement disorders such as idiopathic PD (IPD).2 Increased iron deposition and loss of neuromelanin in the Nigrosome-1 (N1) territory have been found in the substantia nigra (SN) of IPD subjects.3 Therefore, this study aimed to 1) investigate the difference in the incidence of the N1 sign between iRBD patients and healthy controls (HCs) using quantitative susceptibility mapping (QSM), susceptibility weighted imaging (SWI) and true SWI (tSWI); 2) to measure global and regional high iron deposition and volume changes of deep gray matter nuclei in iRBD patients using QSM; and 3) assess the correlations between iron deposition and cognitive and motor functions.Methods
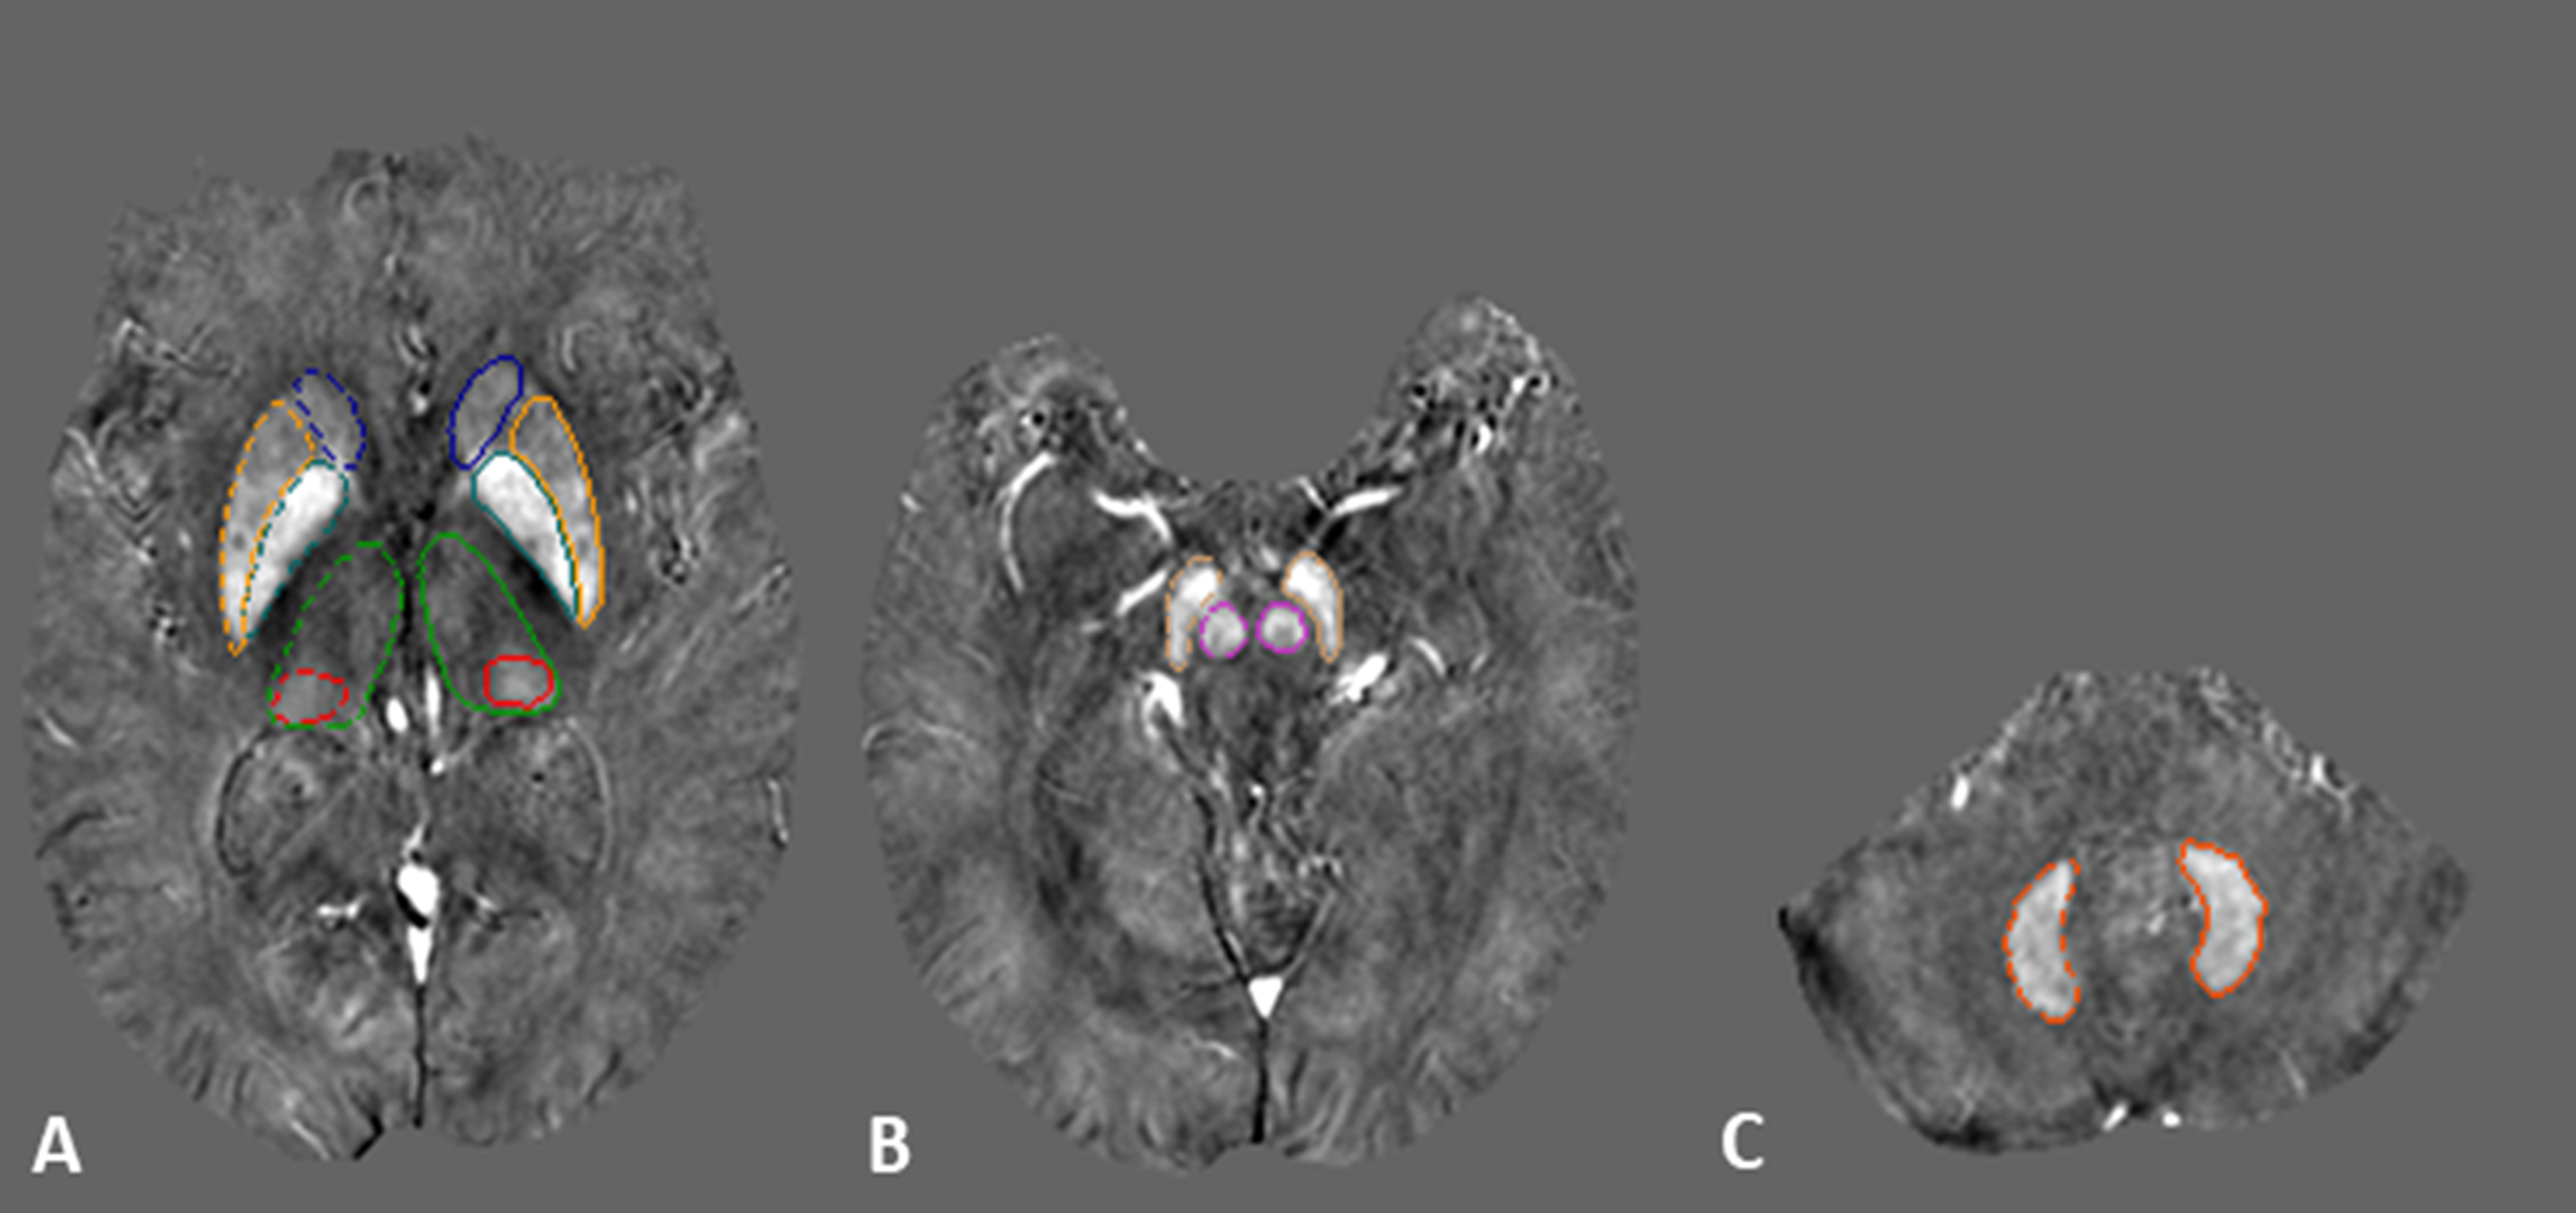
Out of 38 subjects in each group who initially met the inclusion criteria, 29 iRBD (64.6 ± 7.6 years old, 20 males) and 28 age-matched HCs (62.7 ± 4.2 years old, 19 males) underwent MRI examinations on a 3T Siemens scanner (Siemens Prisma, Erlangen, Germany) using a 20-channel phased-array head coil. The demographic information of the participants are summarized in Table 1. A special high-resolution, 3D flow-compensated gradient-echo sequence4 providing both angiographic and venographic data was used to acquire both magnitude and phase images. The imaging parameters were: TR/TE = 20/12.5 ms; matrix size = 384 × 288; FA = 12o, #slices = 64, slice thickness = 2 mm, interpolated in-plane spatial resolution = 0.67 × 0.67 mm2; BW = 240 Hz/pixel and a total acquisition time = 6 minutes and 8 seconds.The QSM post-processing was performed with SMART V2.0 (MR Innovations, Bingham Farms, MI) software. Details of the reconstruction are provided in the following references.5-7 The mean susceptibility values for the global iron (calculated from the whole structure) and regional high (RII) iron (calculated by using structure-specific thresholds to extract values above the upper 95% prediction intervals of the corresponding susceptibility-age normal baselines7) were extracted from 3D regions of interests (ROIs) traced on the QSM maps using SPIN (SpinTech, Inc., Bingham Farms, MI) software. These ROIs were drawn in eight major deep gray matter nuclei and the final boundaries were based on a consensus between the two rates as shown in Figure 1. Four types of images were visually evaluated to assess the N1 sign: the original T2*WI magnitude images, SWI, QSM and tSWI data.8,9 Data were reviewed from the most caudal SN slice to the most cranial slice (4 to 5 slices) abutting the sub-thalamic nucleus.
Results
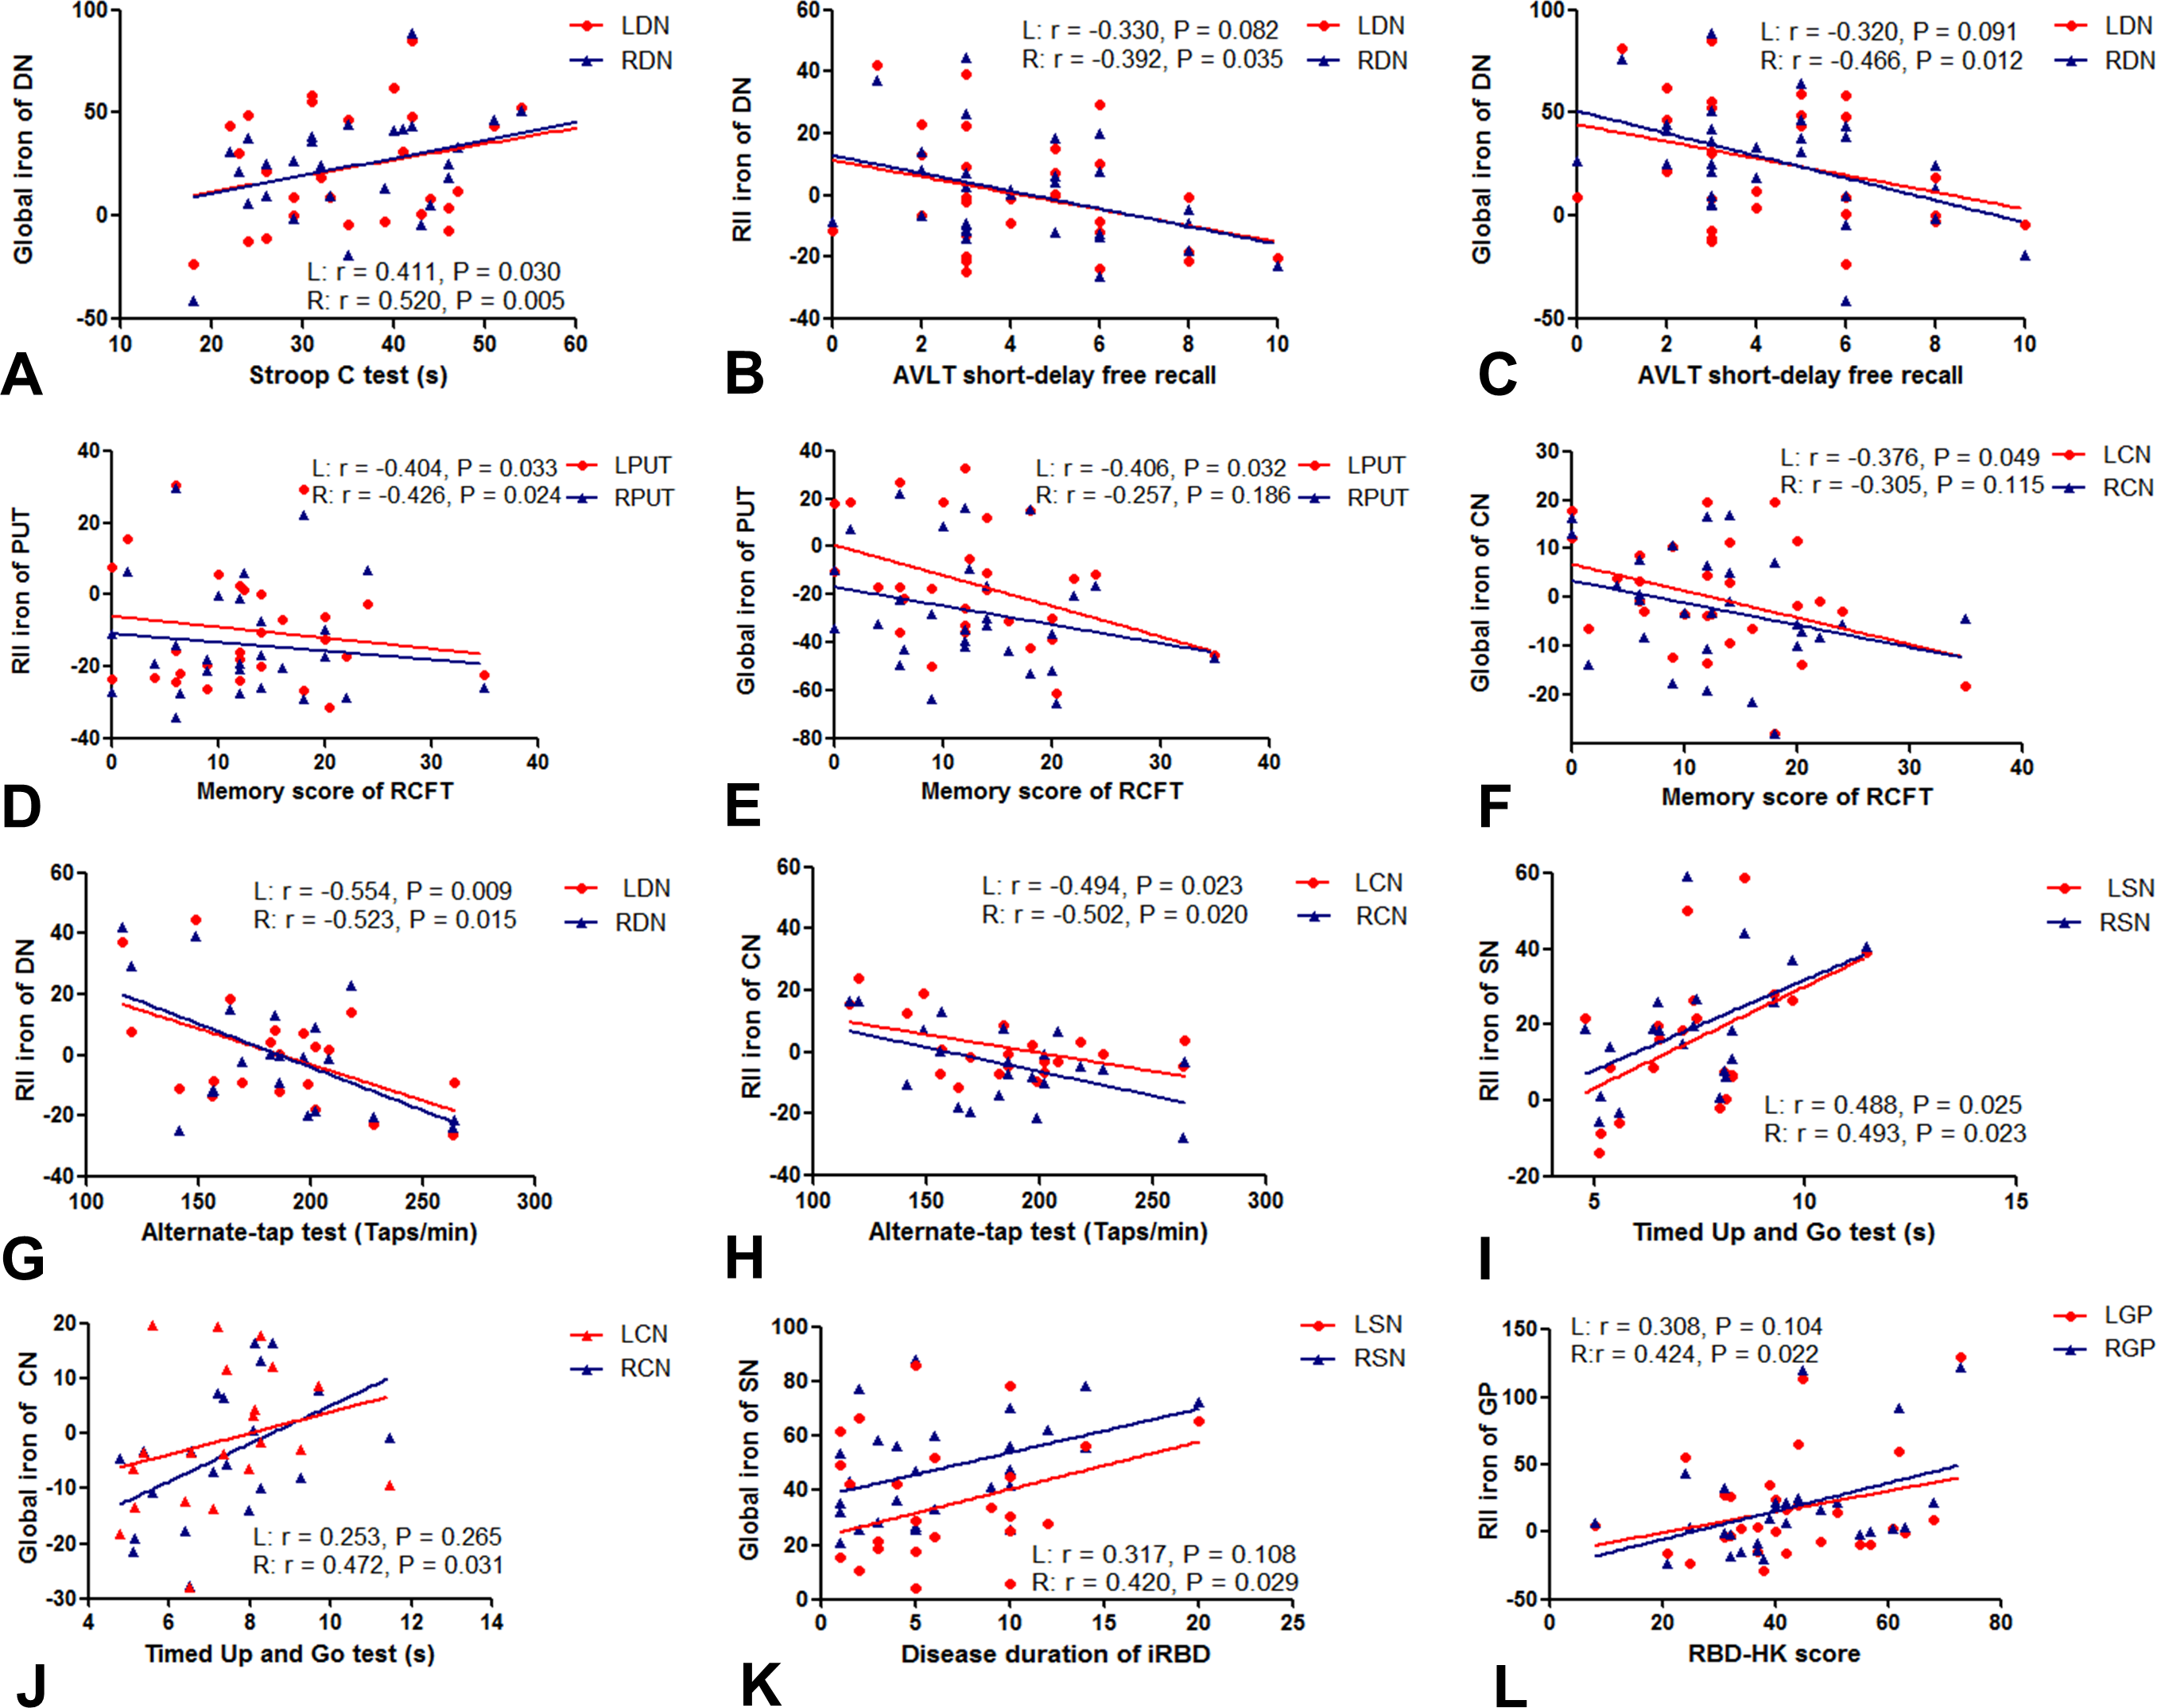
Out of 29 iRBD patients, 8 patients had bilateral and 4 had unilateral loss of the N1 sign while out of 28 HCs, only two had unilateral loss of the N1 sign (Figure 2). The global and RII susceptibility in the right DN of the iRBD patients were significantly higher than those in the HCs (P < 0.05) (Table 2). The volumes of the bilateral caudate nucleus (CN) were significantly lower than those of the HCs (right: P = 0.003, left: P = 0.021). In order to investigate the correlations with clinical scores, mean iron measurements were corrected for age dependencies against the corresponding linear regression models for each structure.7 The global susceptibility in the bilateral DN was positively correlated with the time in the Stroop C test while both RII and global susceptibility in the right DN were negatively correlated with the AVLT short-dalay free recall. Furthermore, the RII susceptibility in the bilateral putamen (PUT) and the global susceptibility in the left PUT and left CN were negatively correlated with the memory score of the RCFT test (all P < 0.05). The RII susceptibility of the bilateral DN and CN were negatively correlated with the average taps from the Alternate-Tap test. The RII susceptibility of the bilateral SN were positively correlated with the time of the 3-meter Timed Up and Go. The global susceptibility of the right CN was positively correlated with the time of the 3-meter Timed Up and Go test. Finally, the global susceptibility of the right SN was positively correlated with disease duration of iRBD and the RII susceptibility of the right GP was positively correlated with the RBDQ-HK score (all P < 0.05), as summarized in Figure 3.Discussion and Conclusions
This study compares the N1 sign, global and RII iron deposition and the correlations between iron deposition with cognitive and motor impairment in iRBD patients. The most important findings were: the number of iRBD patients with the N1 sign loss was significantly higher than that of HCs and the DN, CN and SN susceptibility analyses all had some correlation with motor and cognitive functions with the right DN showing significantly higher iron content in iRBD patients. Taken together, these results suggest that global and RII iron deposition are potential imaging biomarkers for an underlying neurodegeneration early evaluation of cognitive and motor impairment in iRBD patients.Acknowledgements
We sincerely thank the participants in this study.References
1. Hogl, B., A. Stefani, and A. Videnovic, Idiopathic REM sleep behaviour disorder and neurodegeneration - an update. Nat Rev Neurol, 2018. 14(1): p. 40-55.
2. Ghassaban, K., et al., Quantifying iron content in magnetic resonance imaging. Neuroimage, 2019. 187: p. 77-92.
3. Sjostrom, H., et al., Quantitative susceptibility mapping differentiates between parkinsonian disorders. Parkinsonism Relat Disord, 2017. 44: p. 51-57.
4. Chen, Y., et al., An interleaved sequence for simultaneous magnetic resonance angiography (MRA), susceptibility weighted imaging (SWI) and quantitative susceptibility mapping (QSM). Magn Reson Imaging, 2018. 47: p. 1-6.
5. Abdul-Rahman, H.S., et al., Fast and robust three-dimensional best path phase unwrapping algorithm. Appl Opt, 2007. 46(26): p. 6623-35.
6. Schweser, F., et al., Quantitative imaging of intrinsic magnetic tissue properties using MRI signal phase: an approach to in vivo brain iron metabolism? Neuroimage, 2011. 54(4): p. 2789-807.
7. Liu, M., et al., Assessing global and regional iron content in deep gray matter as a function of age using susceptibility mapping. J Magn Reson Imaging, 2016. 44(1): p. 59-71.
8. Liu, S., et al., Improved MR venography using quantitative susceptibility-weighted imaging. J Magn Reson Imaging, 2014. 40(3): p. 698-708.
9. Cheng, Z., et al., Imaging the Nigrosome 1 in the substantia nigra using susceptibility weighted imaging and quantitative susceptibility mapping: An application to Parkinson's disease. Neuroimage Clin, 2020. 25: p. 102103.
Figures