1036
Analysis of Exchangeable Pool Contributions to the Chemical Exchange Saturation Transfer Signal Using a 2-stage Simulation Method1Key Laboratory for Biomedical Engineering of Ministry of Education, Department of Biomedical Engineering, College of Biomedical Engineering & Instrument Science, Zhejiang University, Hangzhou, China, 2Department of Neurology, First Affiliated Hospital, College of Medicine, Zhejiang University, Hangzhou, China, 3MR Collaboration, Siemens Healthcare Ltd., Shanghai, China, 4Department of Neurosurgery, Zhejiang Provincial People's Hospital, HangZhou, China
Synopsis
A 2-stage simulation method was proposed to estimate the leading contributor to the CEST contrast between disease and normal tissues. First, the proposed method generates a best Bloch-McConnell fit to the MTRasym spectra of the normal brain tissues. Second, it alters only one exchange parameter in the Bloch-McConnell model to fit the MTRasym spectra of disease tissues each time. The candidate parameter that yields the smallest error between simulated and experimental results is identified as the leading contributor to the CEST contrast. The proposed method was validated in numeric phantoms and 9 tuberous sclerosis complex (TSC)-associated epilepsy patients.
Introduction
Chemical Exchange Saturation Transfer (CEST) imaging 1 has been used for a variety of diseases. However, it is challenging to analyze the potential molecular contributions to the CEST effect due to the complexity of biological tissues 2. To directly estimate the exchangeable pool information from the CEST signal, a multi-pool Bloch-McConnell (BM) fitting is typically required. However, BM fitting is usually time-consuming and requires a large amount of data 3, even though a stable unique solution still cannot be guaranteed. Here, a 2-stage simulation method is proposed to assess the leading contributor among each exchangeable pool to the CEST contrast between normal and disease tissues.Theory and Methods
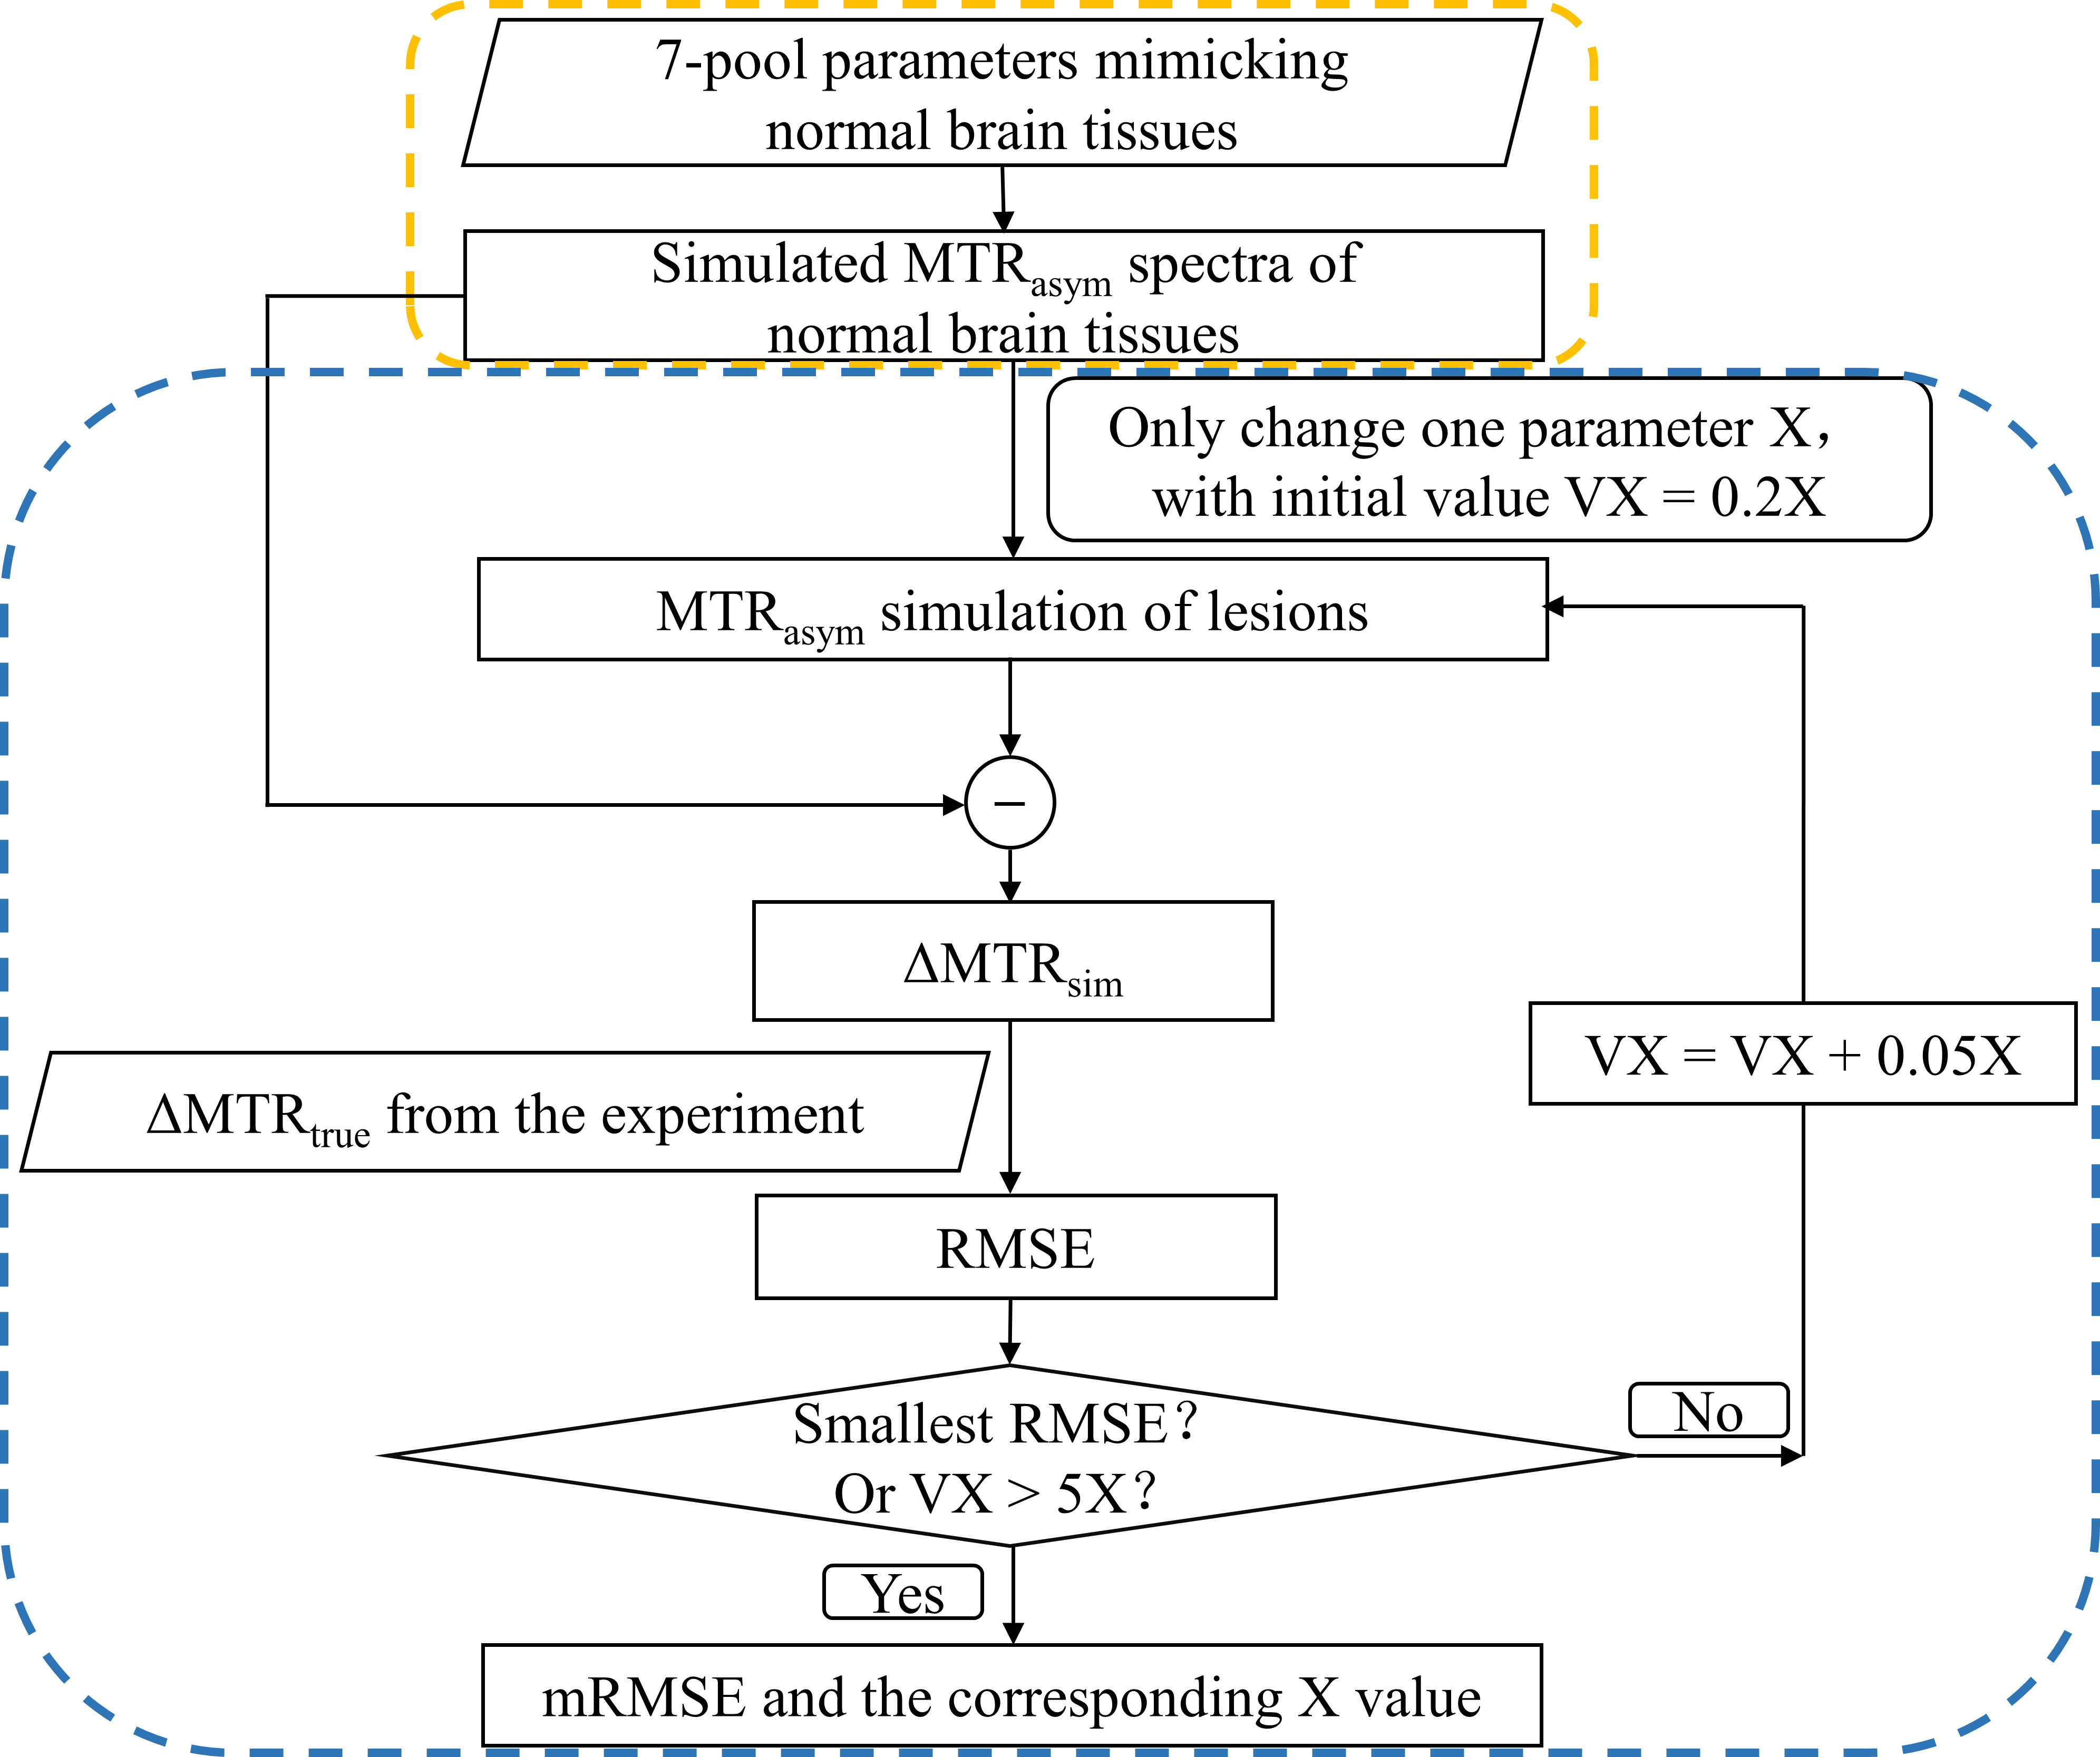
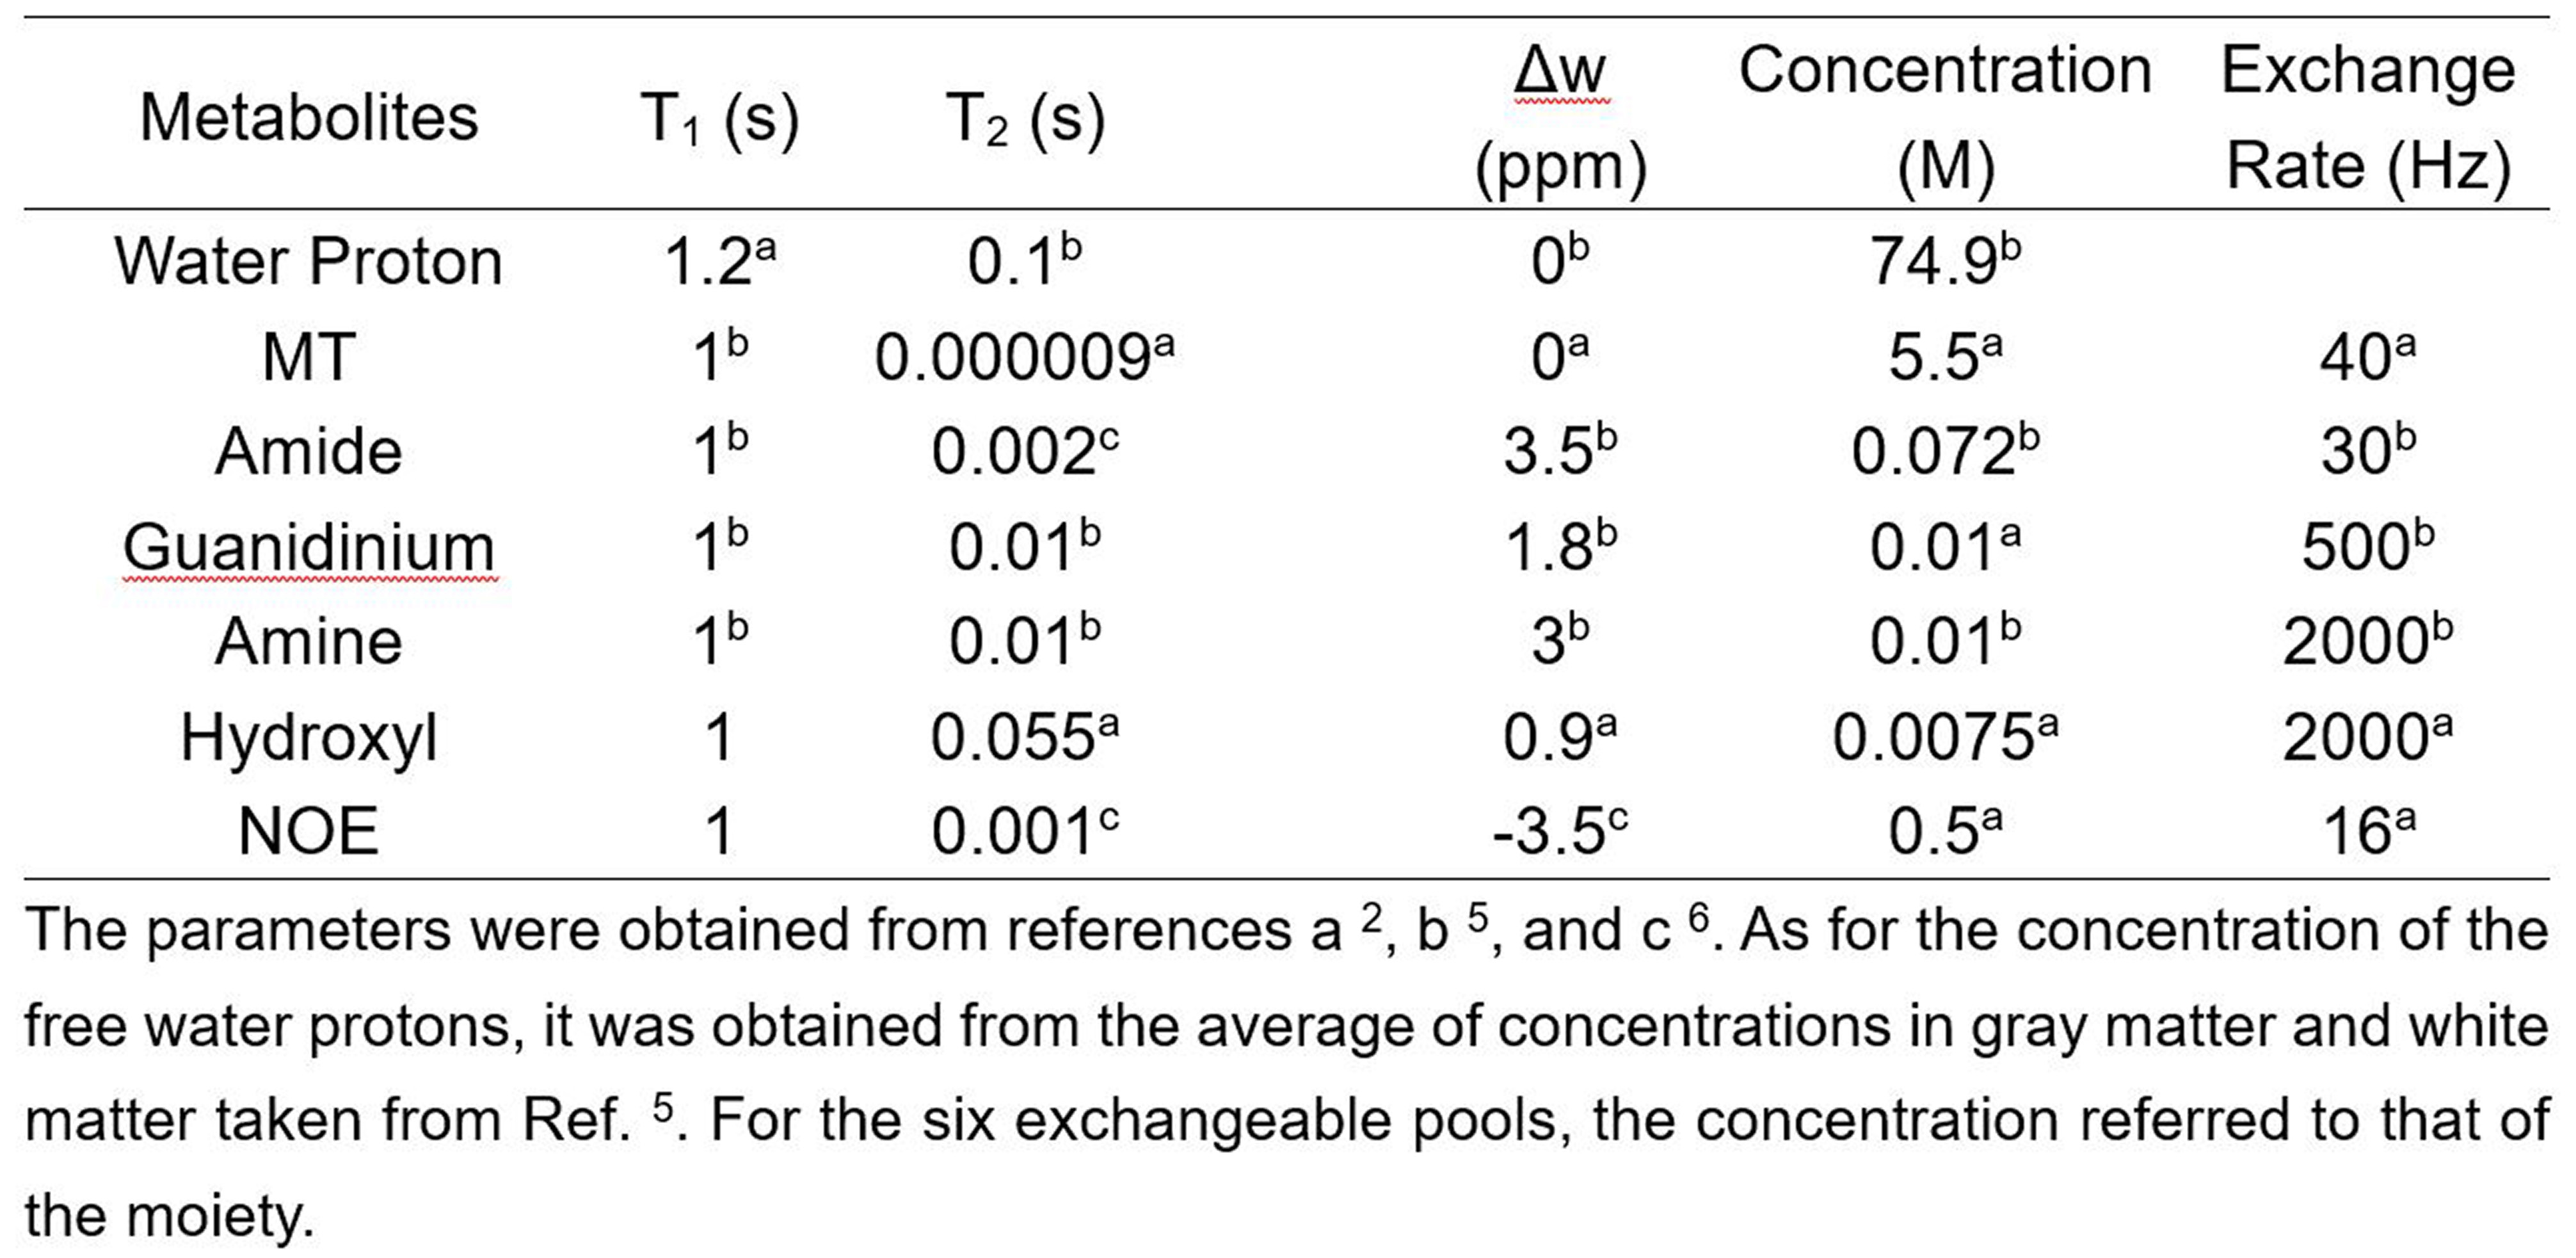
Fig.1 illustrates the workflow of the 2-stage simulation method. Stage 1: Simulation of magnetization transfer ratio asymmetry (MTRasym) spectra in normal tissues was performed based on a 7-pool BM equation, which contained all the major metabolites mimicking in vivo normal brain tissues 4. The parameters were combined from three related reports 2, 5, 6 as shown in Table 1 to best simulate the normal MTRasym spectra. Stage 2: Simulation of MTRasym spectra in lesions was done by varying only one parameter of those used for normal tissues each time. The agreement between simulated and experimental CEST contrast was assessed by the root mean square error (RMSE), where the CEST contrast was ΔMTR = MTRasym(lesions) – MTRasym(normal tissues). The varied parameter was swept from 20% to 500% (step size: 5%) of the normal value shown in Table 1 until the minimum RMSE (mRMSE) was found. A smaller mRMSE indicated that the simulated ΔMTR was more similar to the experimental one, suggesting that the corresponding parameter may contribute more to the CEST contrast between lesions and normal tissues.We used numeric phantoms to verify the feasibility of the proposed 2-stage method. MTRasym curves were generated with parameters in Table 1 for normal tissues, and additionally with the amine concentration increased by 100% for lesions. White noise was added to the MTRasym spectra with a signal-to-noise ratio of 30. Saturation power (B1) = 1, 2, 3, and 4μT, saturation duration = 1000ms, and RF saturation frequencies = -6 to 6ppm stepped at 0.25ppm.
Nine tuberous sclerosis complex (TSC)-associated epilepsy patients with cortical tubers in the brain were scanned on a 3T Siemens Prisma MRI scanner (Erlangen, Germany) with approval given by the local IRB. The target slice with the largest tuber was scanned by a turbo-spin-echo CEST imaging sequence 7 with the same saturation parameters used in the aforementioned simulation. Other parameters were as follows: TR/TE = 5s/8.1ms; slice thickness = 5mm; FOV = 212mm×185.5mm; and matrix size = 416×364.
Results
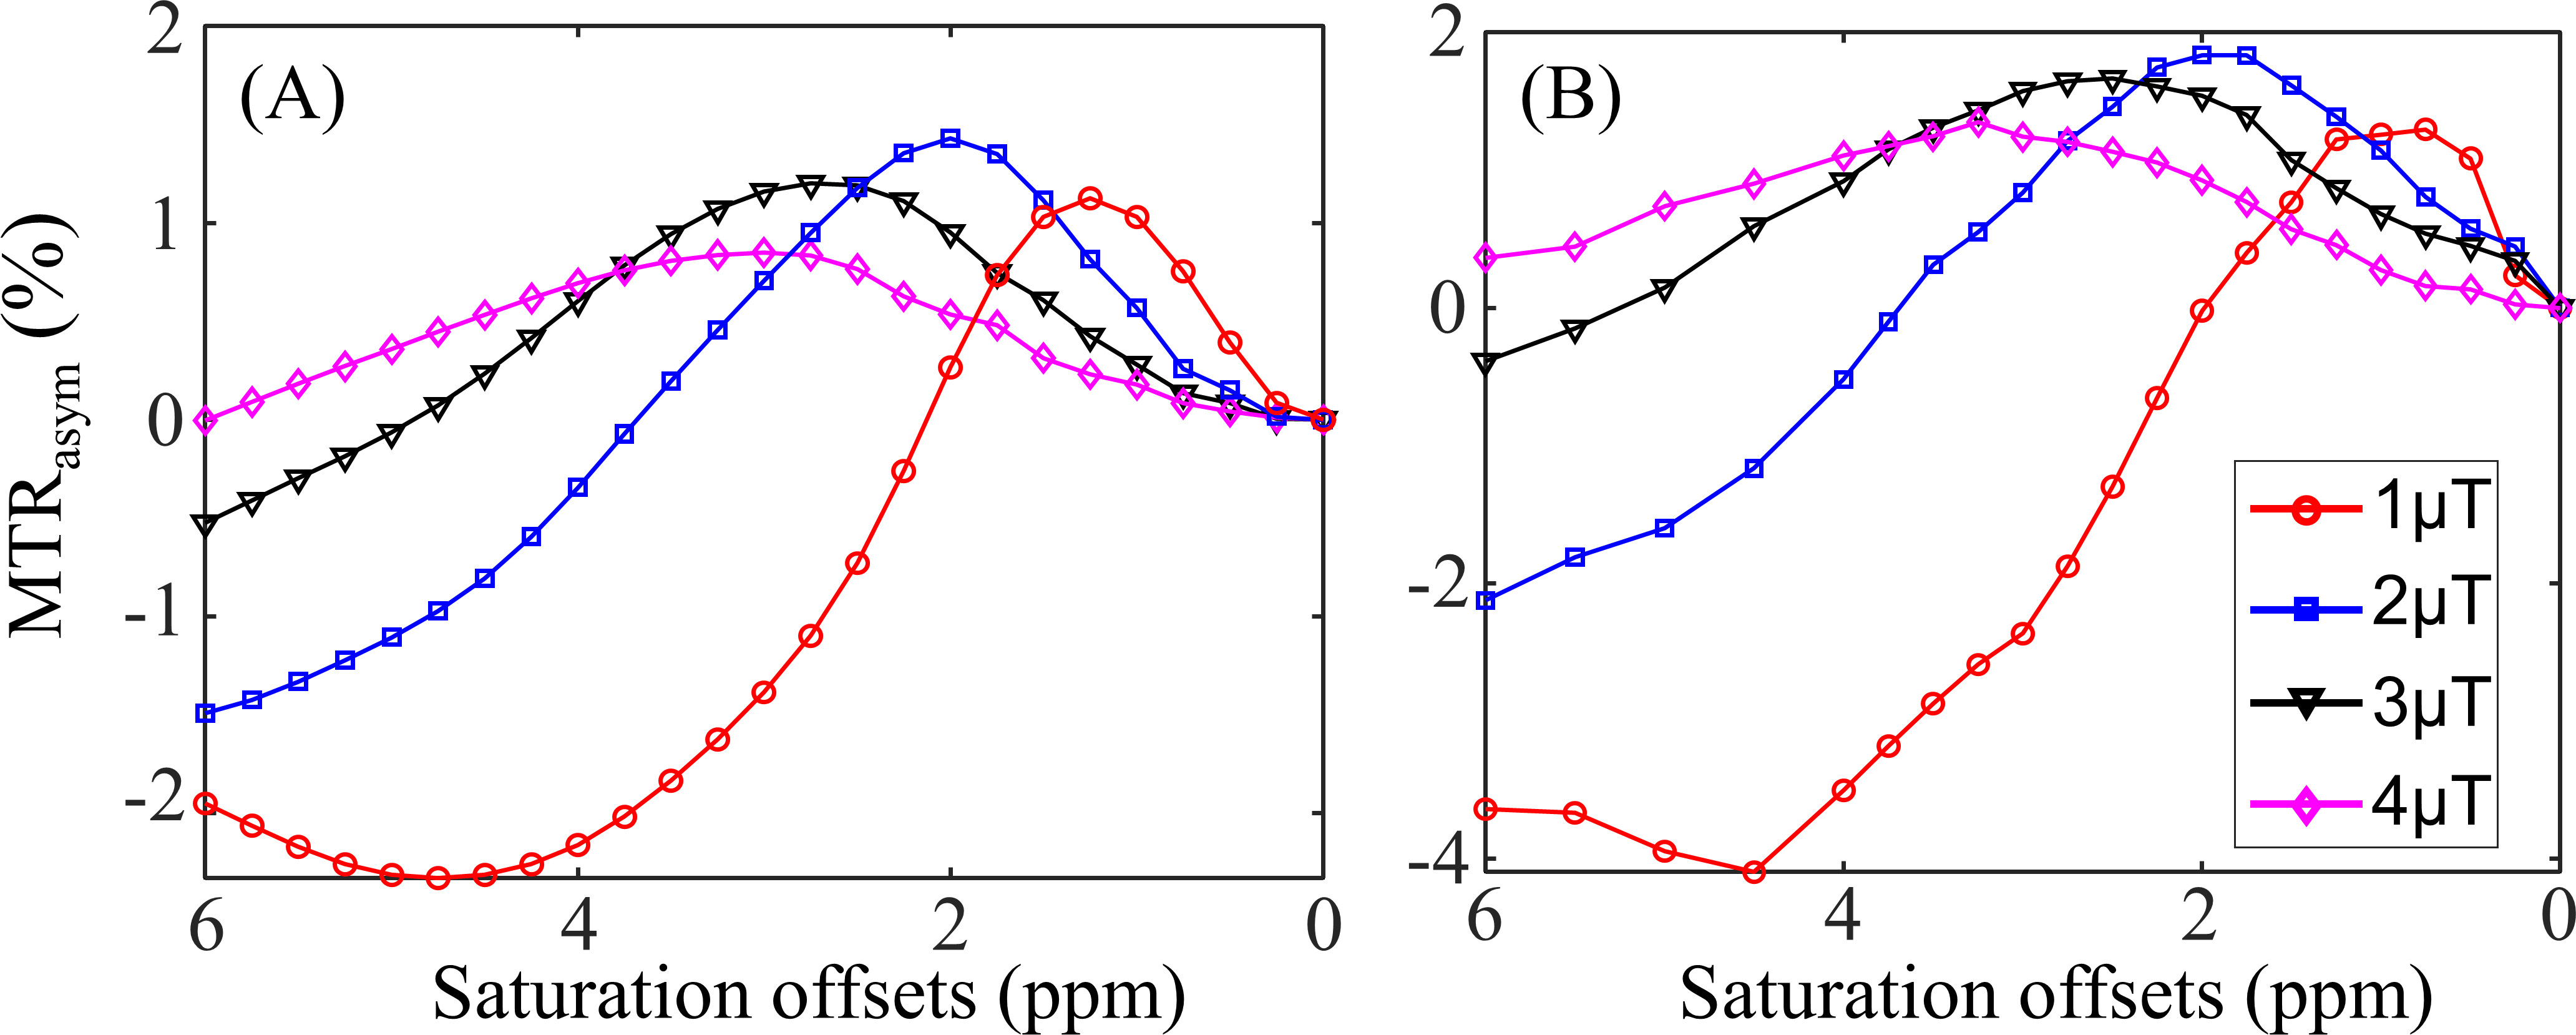
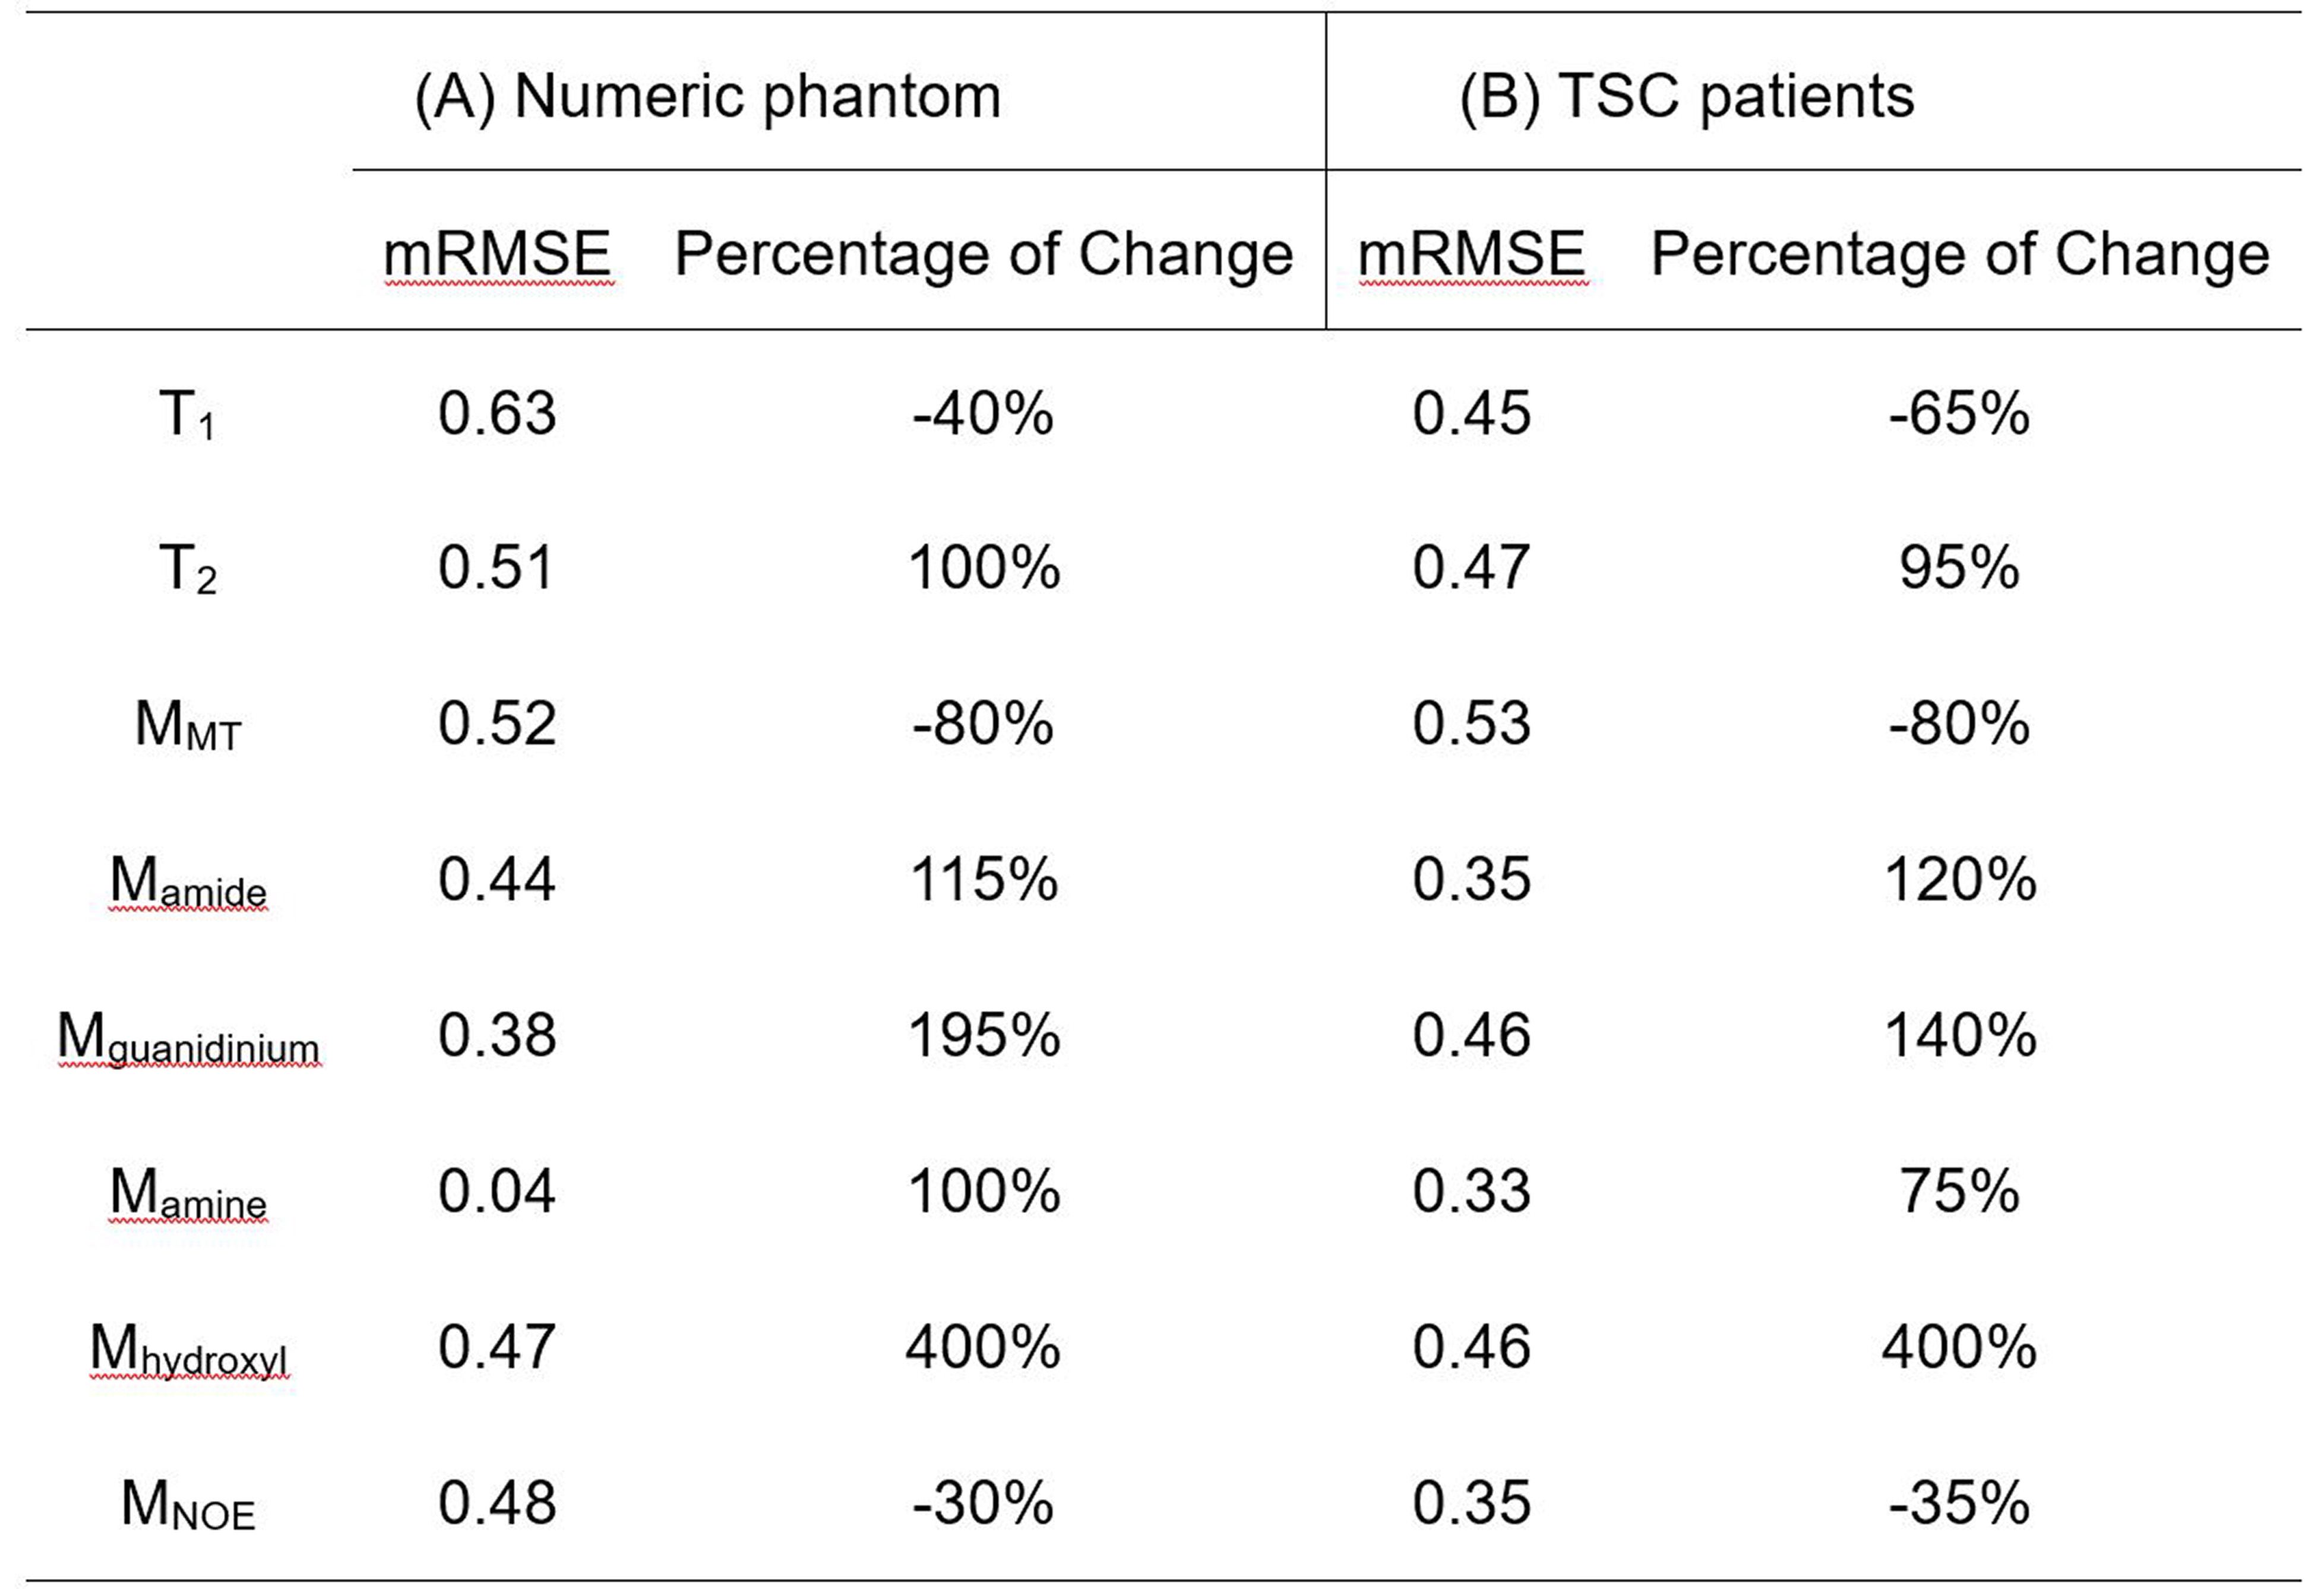
Table 2A illustrates that the mRMSE obtained was substantially different for each candidate parameter. The smallest mRMSE among all parameters revealed the leading contributor to the CEST contrast in the numeric phantom. The proposed 2-stage analysis method not only identified the correct pool with altered concentrations (amine), but also generated the correct proportion of the change (100%).Fig. 2 shows the comparison of simulated (A) and experimental (B) MTRasym spectra in the normal brain tissues for different B1 levels. Generally, the simulated MTRasym spectra agreed well with the experimental ones using the selected parameters in Table 1. Notably, these exchange parameters correctly simulated the MTRasym curve shapes and the shift of the peak with respect to B1. However, the agreement was not perfect, given the complexity of the in vivo brain tissues.
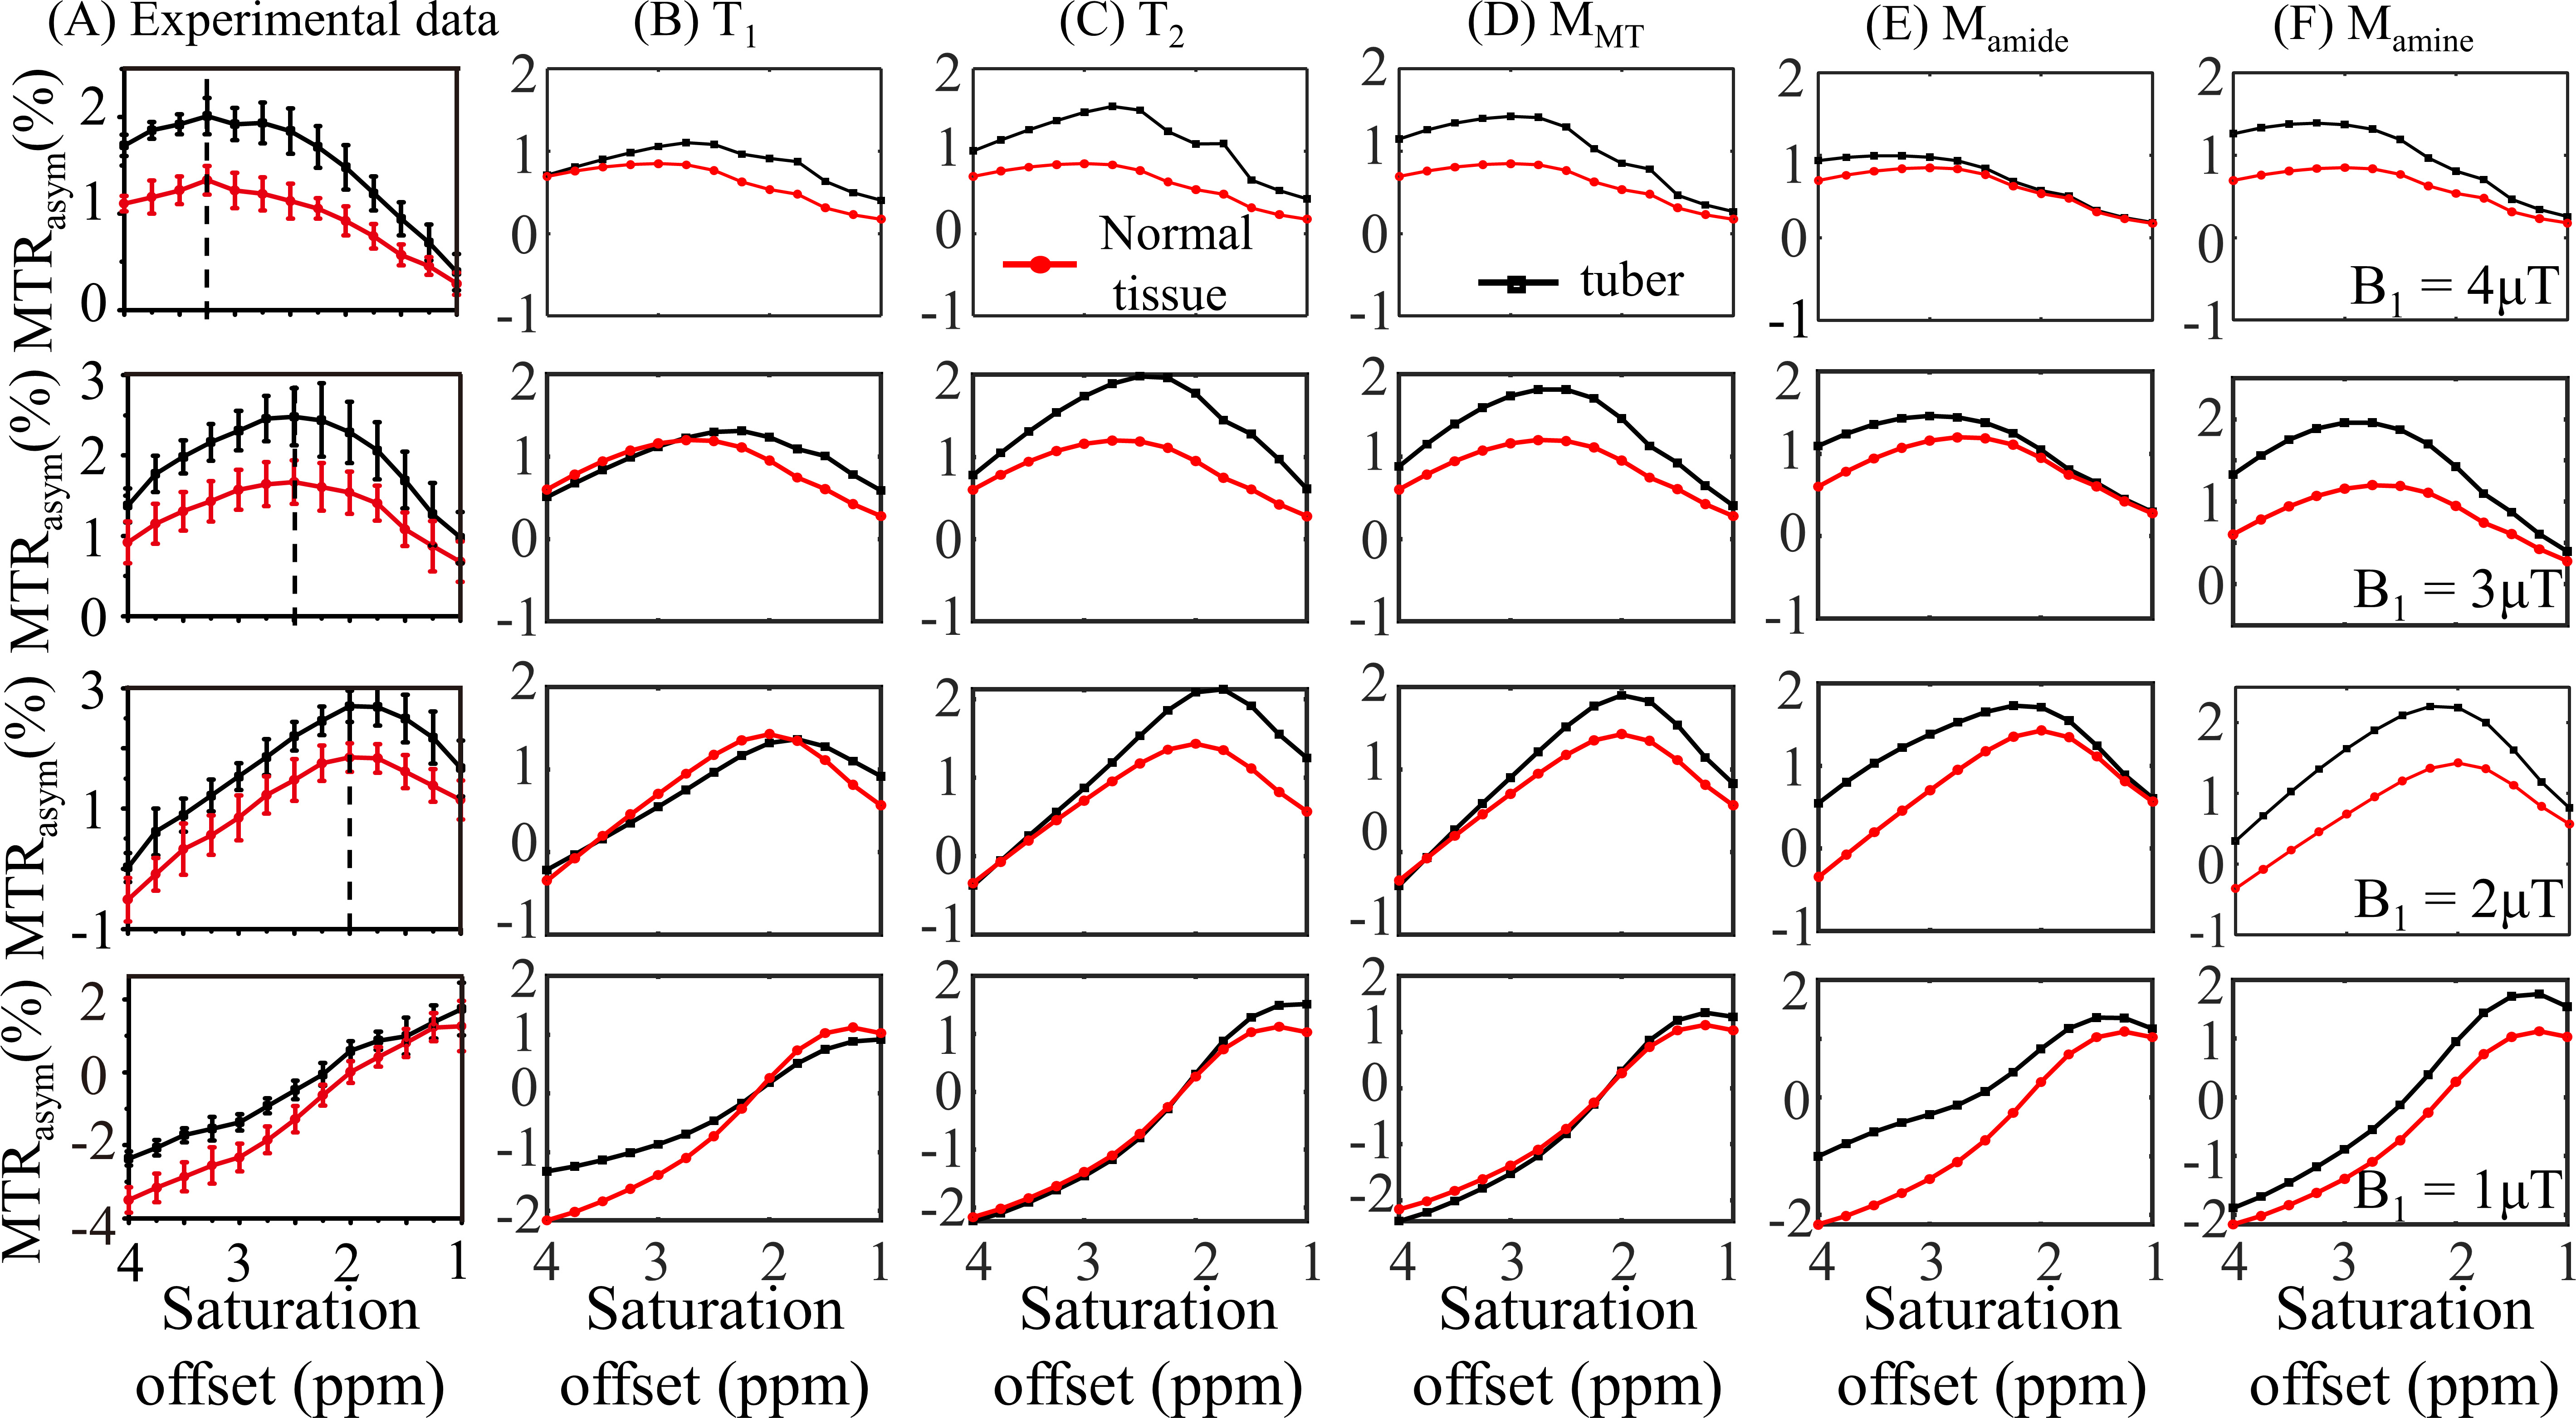
Fig. 3 displays the effects of varying T1, T2, concentrations of MT, amide, and amine, so that the mRMSE was obtained between experimental and simulated CEST contrast, as listed in Table 2B. Among the eight candidate parameters, the amine concentration with a 75% increase yielded the smallest mRMSE of 0.33, suggesting that the experimental CEST contrast between tubers and normal tissues can be best explained by the parameters in Table 1 for normal tissues plus modifying a single amine concentration for tubers. Indeed, the simulated MTRasym spectra for normal tissues and tubers related to the modification of amine concentration (Fig. 3F) can better approximate the experimental ones (Fig. 3A) than the other parameters (Fig. 3B-E).
Discussion
The numeric phantom results (Table 2A) verified that the proposed 2-stage simulation method could identify the leading contributor to the CEST contrast between lesions and normal tissues. We then applied this approach to TSC-associated epilepsy patients and found amine concentration to be the dominant contributor to the elevated CEST signals in tubers versus normal tissues, which was consistent with the reported accumulation of glutamate in tubers 8. It should be aware that in addition to glutamate, some proteins also can generate amine CEST signals 9.Conclusion
A 2-stage analysis method was proposed to assess the leading contributor to the CEST contrast in vivo. This method avoids the complexity and uncertainty associated with full Bloch-McConnell fitting. The proposed 2-stage method may serve as a potentially useful tool for evaluating the changes of metabolites in the foci of many diseases.Acknowledgements
NSFC grant number: 81971605, 61801421.References
1. Ward KM, Aletras AH, Balaban RS. A New Class of Contrast Agents for MRI Based on Proton Chemical Exchange Dependent Saturation Transfer (CEST). Journal of Magnetic Resonance. 2000;143(1):79-87.
2. van Zijl PCM, Lam WW, Xu J, Knutsson L, Stanisz GJ. Magnetization Transfer Contrast and Chemical Exchange Saturation Transfer MRI. Features and analysis of the field-dependent saturation spectrum. Neuroimage. 2018;168:222-241.
3. Shah SM, Mougin OE, Carradus AJ, et al. The z-spectrum from human blood at 7T. Neuroimage. 2018;167:31-40.
4. Khlebnikov V, van der Kemp WJM, Hoogduin H, Klomp DWJ, Prompers JJ. Analysis of chemical exchange saturation transfer contributions from brain metabolites to the Z-spectra at various field strengths and pH. Sci Rep. 2019;9(1):1089.
5. Cai K, Haris M, Singh A, et al. Magnetic resonance imaging of glutamate. Nat Med. 2012;18(2):302-306.
6. Zhang XY, Wang F, Xu J, Gochberg DF, Gore JC, Zu Z. Increased CEST specificity for amide and fast-exchanging amine protons using exchange-dependent relaxation rate. NMR Biomed. 2018;31(2):e3863.
7. Liu R, Zhang H, Niu W, et al. Improved chemical exchange saturation transfer imaging with real-time frequency drift correction. Magn Reson Med. 2019;81(5):2915-2923.
8. Zeng LH, Bero AW, Zhang B, Holtzman DM, Wong M. Modulation of astrocyte glutamate transporters decreases seizures in a mouse model of Tuberous Sclerosis Complex. Neurobiol Dis. 2010;37(3):764-771.
9. Cui J, Zu Z. Towards the molecular origin of glutamate CEST (GluCEST) imaging in rat brain. Magn Reson Med. 2020;83(4):1405-1417.
Figures