1034
Increased connectivity strength in operculo-insular epilepsy leveraged by COMMIT-based surface-enhanced tractography1Department of Neurosciences, Université de Montréal, Montréal, Quebec, Canada, Montréal, QC, Canada, 2Sherbrooke Connectivity Imaging Lab (SCIL), Université de Sherbrooke, Sherbrooke, Quebec, Canada, Sherbrooke, QC, Canada, 3Electrical Engineering, Vanderbilt University, Nashville, TN, United States, Nashville, TN, United States, 4Department of Neurology and Neurosurgery, Faculty of Medicine, McGill University, Montreal, QC, Canada, Montreal, QC, Canada, 5Division of Neurosurgery, CHUM, Montréal, Quebec, Canada, Montreal, QC, Canada, 6Department of Computer Science, University of Verona, Verona, Italy, Verona, Italy, 7Service de Neurologie, CHUM, Montréal, Québec, Canada, Montreal, QC, Canada
Synopsis
Operculo-insular epilepsy (OIE) is a rare and under-diagnosed pathology due to its heterogeneous presentation. Interestingly, no studies have looked at the structural connectome in OIE. In this study, we used a cutting-edge diffusion MRI processing pipeline to evaluate the connectivity pattern of OIE. The filtering-based COMMIT weight obtained from surface-enhanced tractography was used as a marker of ‘connectivity strength’. We found an increase in ‘connectivity strength’ within the epileptic network of OIE. Moreover, the pattern of connectivity was distinct from the one of TLE, potentially constituting a tool to help differentiate OIE from the closely related and challengingly distinguishable TLE.
Introduction
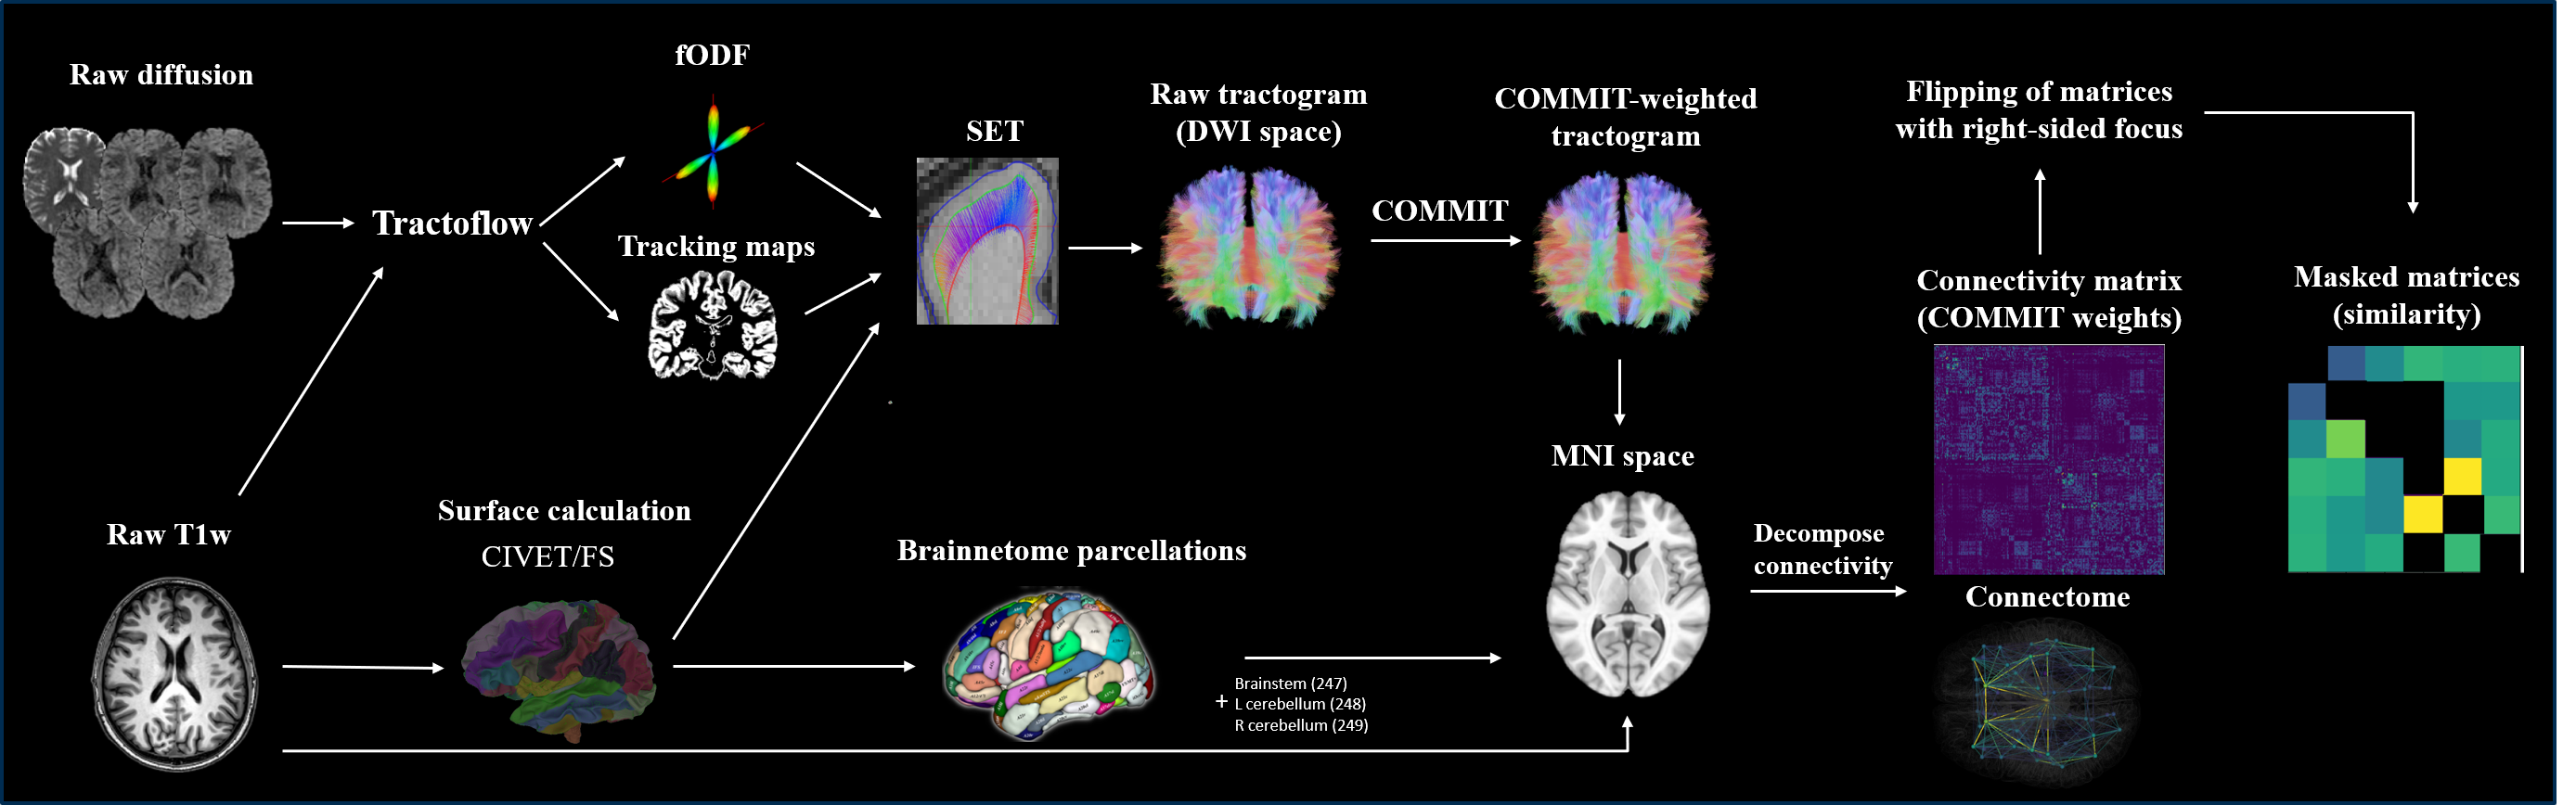
Operculo-insular epilepsy (OIE) is an under-recognized condition with the potential of mimicking neocortical and mesiotemporal epilepsies 1-3. Previous studies evaluating structural connectivity patterns in patients with focal epilepsy have revealed increased ‘connectivity strength’ within the epileptic focus and network 4,5,6. However, in most of these studies, ‘connectivity strength’ is typically quantified using streamline-count based on standard probabilistic/deterministic or even DTI tracking5,6. We propose a cutting-edge pipeline using surface-enhanced tractography (SET)7 and Convex Optimization Modeling for Micro-structure Informed Tractography (COMMIT)8, addressing some critical limitations of tractography. Our method is robust to crossing fibers due to the use of fiber orientation distribution functions (fODF), reduces the partial volume effect and optimizes coverage of the cortex and hard-to-track regions due to SET, and allows to assign a quantitative weight per streamline while removing invalid streamlines thanks to COMMIT-filtering. Using our pipeline, we report, for the first time, structural connectivity alterations in patients with OIE and evaluate if such changes reveal an increase ‘connectivity strength’ within the insular epileptic network.Methods
The study included 9 patients with OIE, 8 age- and sex-matched patients with TLE and 22 age- and sex-matched healthy controls (HC). 3T MRI data was acquired for all participants. Diffusion MRI (b=1500 s/mm2) and T1w images were processed using Tractoflow 9. Constrained spherical deconvolution was used to obtain fODFs. Tractograms were built using surface-enhanced particle filter SET 7,10, which used the CIVET11 surface. SET was chosen due to its ability to overcome the known gyral bias of standard tractography algorithms and to improve cortical coverage and the robustness of connectome building 7. Convex Optimization Modeling for Micro-structure Informed Tractography (COMMIT) was then used to filter the raw tractogram and compute COMMIT weights of individual streamlines 8. The FreeSurfer12 output was used to generate the 246 Brainnetome parcels13. The COMMIT-weighted tractogram and Brainnetome parcellations were used to derive COMMIT-weighted structural connectivity matrices . Briefly, the COMMIT weight of a streamline is a measure that computes the proportion of the diffusion MRI signal that can be explained by streamlines8. The COMMIT weight of a connection corresponds to the sum of COMMIT weights of individual streamlines connecting two parcels of the matrix and was used as a marker of ‘connectivity strength’ in our study. Matrices of patients with right-sided OIE or TLE were side-flipped which allowed the analysis to be performed uniformly. Corresponding bundles that were anatomically dissimilar (high shape variability) between controls were excluded in all matrices of the control, OIE and TLE groups. This criterion allowed the inclusion of anatomically reliable and replicable bundles (Figure 1).In addition to (i) 249 x 249 COMMIT-weighted whole-brain matrices, sub-networks consisting of (ii) 6 x 243 matrices linking the 6 subinsular regions to all 243 extra-insular regions (insula-extrainsula subnetwork matrices) and (iii) 6 x 6 matrices linking the 6 subinsular regions to each other (insula subnetwork matrices) were computed. Matrices were then compared in a group analysis using one-sided t-tests between (a) HCs and patients with OIE, and (b) patients with OIE and patients with TLE. Between-groups difference maps were created using a threshold of p<0.001 for exploratory analyses of whole-brain matrices and a threshold of FDR-corrected p<0.05 for confirmatory analyses of both 6 x 243 insula-extrainsula and 6 x 6 insula subnetwork matrices.
Results
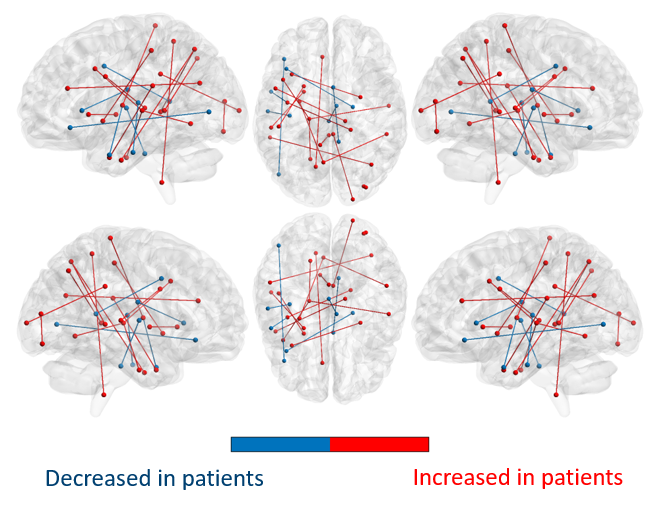
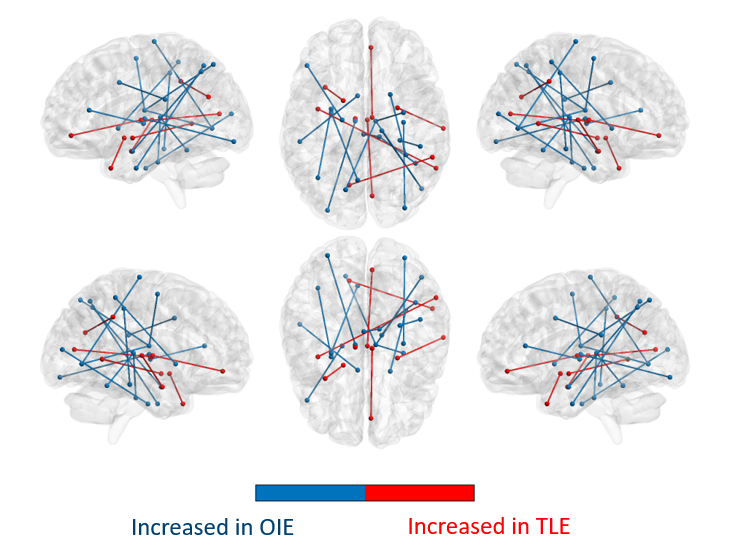
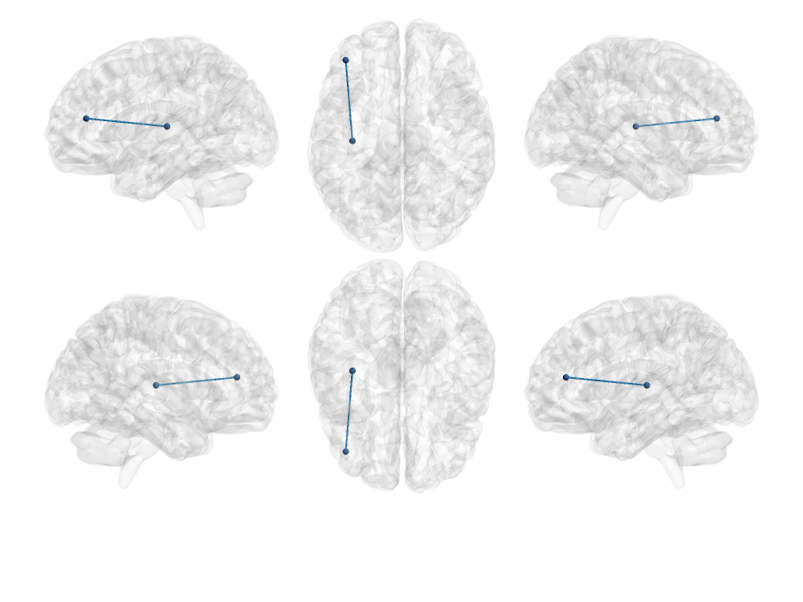
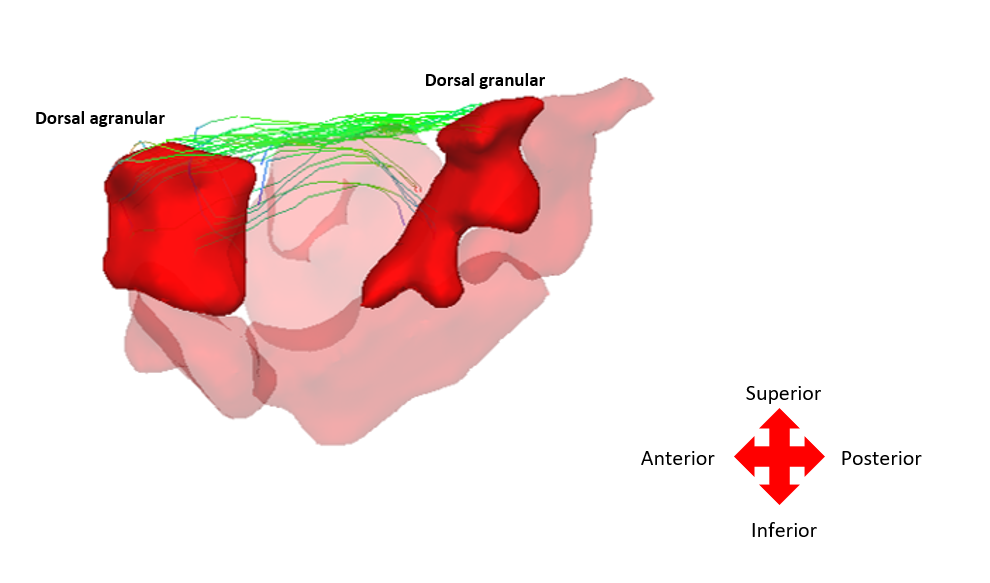
On whole-brain analyses, significant increases in COMMIT weights were observed bilaterally in multiple bundles of OIE patients as compared to HCs. A pattern of decreased COMMIT weights was also observed but was more limited (Figure 2). Similarly, a wider pattern of increased connectivity was detected in OIE patients as compared to TLE patients, both ipsilateral and contralateral to the seizure focus (Figure 3).Significant increases in COMMIT weight were noted between the dorsal granular insula and the pregenual cingulate gyrus in patients with OIE as compared to HCs when isolating the insula-extrainsula subnetwork (Figure 4). No variations were observed when comparing the insula-extrainsula subnetwork of patients with OIE to the same network of patients with TLE. When investigating only the insula subnetwork, an increase in connectivity was seen between the dorsal granular and agranular insula in patients with OIE as compared to patients with TLE (Figure 5). However, no differences were noted when comparing the insula subnetwork of HCs to the same network of patients with OIE.
Discussion
Epilepsy constitutes a disease of hyper-connectivity between regions within a focus, and therefore the use of quantitative structural connectivity is essential to accurately characterize the epileptic network. To do so, cutting-edge quantitative connectivity pipelines using novel technologies, such as the one used in our study, are of paramount importance. To our knowledge, our results reveal, for the first time, the distribution of structural connectivity in patients with OIE. The wider pattern of increased ‘connectivity strength’ observed in patients with OIE could suggest a more diffuse epileptic network than TLE. In addition, the increased connectivity between insular-connected regions likely reflects a densely connected insular epileptic focus and related network3.Conclusion
Although more work is necessary, the differential morphologic pattern of ‘connectivity strength’ could eventually constitute a complementary tool to differentiate two challengingly distinguishable epilepsies of anatomically adjacent seizure origins, namely OIE from TLE.Acknowledgements
No acknowledgement found.References
1. Nguyen D.K., Nguyen D.B., Malak R., Bouthillier A. (2009), ''Insular cortex epilepsy: an overview'', Canadian Journal of Neurological Sciences, vol. 36, S2, pp. S58-62.
2. Nguyen D.K., Nguyen D.B., Malak R., Leroux J.M., Carmant L., Saint-Hilaire J.M., Giard N,., Cossette P., Bouthillier A. (2009), ''Revisiting the role of the insula in refractory partial epilepsy'', Epilepsia, vol. 50, no.3, pp. 510-520.
3. Obaid S., Zerouali Y., Nguyen D.K. (2017), ''Insular epilepsy: semiology and noninvasive investigations. Journal of Clinical Neurophysiology, vol. 34 (4), pp. 1537-1603.
4. Englot D., Konrad P.E., Morgan V.L. (2016), ''Regional and global connectivity disturbances in focal epilepsy, related neurocognivite sequelae, and potential mechanistic underpinning'', Epilepsia, vol. 57(10), pp. 1546-1557.
5. Dinkelacker V., Valabregue R., Thivard L., Lehéricy S., Baulac M., Samson S., Dupont S. (2015), ''Hippocampal-thalamic wiring in medial temporal lobe epilepsy: enhanced connectivity per hippocampal voxel'', Epilepsia, vol. 56 (8), pp. 1217-1226.
6. Bonilha L., Helpern J.A., Sainju R., Nesland T., Edwards J.C., Glazier S.S., Tabesh A. (2013), ''Presurgical connectome and postsurgical seizure control in temporal lobe epilepsy'', Neurology, vol. 81 (19), pp. 1704-1710.
7. St-Onge E., Daducci A., Girard G., Descoteaux M. (2018), ''Surface-enhanced tractography'', Neuroimage, vol.169, pp. 524-539.
8. Daducci A., Dal Palù A., Lemkaddem A., Thiran J.P. (2014), ''COMMIT: Convex optimization modeling for microstructure informed tractography'', IEEE Transactions on Medical Imaging, vol. 33 (1), pp. 246–257
9. Theaud G., Houde J-C, Boré A., Rheault F., Morency F., Descoteaux M. (2020), ''TractoFlow: A robust, efcient and reproducible diffusion MRI pipeline leveraging Nextow & Singularity'', Neuroimage, vol. 218.
10. Girard G., Whittingstall K., Derich, R., Descoteaux M. (2014), ''Towards quantitative connectivity analysis: reducing tractography biases'', Neuroimage, vol. 98, pp. 266–278.
11. Kim J.S., Singh V., Lee J.K., Lerch J., Ad-Dab’bagh Y., MacDonal, D., Lee J.M., Kim S.I., Evans A.C. (2005), ''Automated 3-d extraction and evaluation of the inner and outer cortical surfaces using a laplacian map and partial volume effect classification'', Neuroimage, vol. 27, pp. 210-221.
12. Dale A.M., Fischl B., Sereno M.I. (1999), ''Cortical surface-based analysis: I. segmtantion and surface reconstruction'', Neuroimage, vol. 9, pp.179-194.
13. Fan L., Li H., Zhuo J., Zhang Y., Wang J., Chen L., Yang Z., Chu C., Xie S., Laird A.R., Fox P. T., Eickhoff S.B., Yu C., Jiang T. (2016), ''The Human Brainnetome Atlas: A New Brain Atlas Based on Connectional Architecture'', Cerebral cortex, vol. 26(8), pp. 3508–3526.
14. Desikan R. S., Ségonne F., Fischl B., Quinn B. T., Dickerson B. C., Blacker D., et al. (2006), ''An automated labeling system for subdividing the human cerebral cortex on MRI scans into gyral based regions of interest. '', NeuroImage, vol. 31, pp. 968–980.
Figures