1031
Development of robust MRE for measurement of high-speed functionally mediated changes in human brain viscoelasticity
Bin Deng1,2,3, W. Scott Hoge3,4, Shruti Mishra3,4, Giacomo Annio5, Ralph Sinkus5, and Samuel Patz3,4
1Athinoula A. Martinos Center for Biomedical Imaging, Massachusetts General Hospital, Charlestown, MA, United States, 2Radiology, Massachusetts General Hospital, Boston, MA, United States, 3Harvard Medical School, Boston, MA, United States, 4Radiology, Brigham and Women’s Hospital, Boston, MA, United States, 55. Laboratory for Vascular Translational Science (LVTS, Institut National de la Santé et de la Recherche Médicale (INSERM), Paris, France
1Athinoula A. Martinos Center for Biomedical Imaging, Massachusetts General Hospital, Charlestown, MA, United States, 2Radiology, Massachusetts General Hospital, Boston, MA, United States, 3Harvard Medical School, Boston, MA, United States, 4Radiology, Brigham and Women’s Hospital, Boston, MA, United States, 55. Laboratory for Vascular Translational Science (LVTS, Institut National de la Santé et de la Recherche Médicale (INSERM), Paris, France
Synopsis
Our aim is to develop a robust, high-spatial resolution and highly reproducible MRE methodology for the measurement of rapid functionally mediated changes in human brain viscoelasticity. Based on prior work in mice, we expect to observe changes in shear wavelength of ~2mm due to functional activation. Using a modified Ristretto fMRE pulse sequence to acquire control data in healthy volunteers, we evaluated the reproducibility of MRE measurements at 2.5-, 2- and 1.5-mm isotropic spatial resolution. Excellent intra-scan consistency was observed between two interleaved paradigm acquisitions at all resolutions with comparable data quality. Robust inter-scan repeatability was also observed.
Introduction
Recent studies have demonstrated functional magnetic resonance elastography (fMRE) as a novel noninvasive approach to map brain response to functional stimulation. Initial work in mice where a stimulus was turned ON and OFF at high frequencies demonstrated a functionally mediated change in shear modulus that responded much faster than the traditional BOLD response1. In humans, an fMRE response at a slower stimulation frequency has also been demonstrated2-4. In the animal study1, a localized shear modulus ($$$G_{d}$$$) change of ~1kPa out of ~10kPa was observed using a noxious stimulus and a 1kHz vibration frequency. Here we aim to develop a robust fMRE methodology specifically to explore rapid stimulus switching in humans. As is well appreciated among practitioners of traditional MRE in the human brain, a lower vibration frequency (~50Hz) is needed to allow wave propagation throughout the entire brain. Consequently, since $$$G_{d}$$$ scales as the 0.5 power of frequency5, the expected 10% functional change in shear modulus corresponds to a wavelength change at 50Hz of ~2mm, when accounting for the wavelength $$$\lambda\sim\sqrt{G_{d}}$$$ relationship. Such a small effect, however, requires both high SNR and high spatial resolution. In this work, we evaluate the consistency and reproducibility of control fMRE scans without functional stimulation and the trade-offs between SNR and spatial resolution.Methods
We used a multi-slice Ristretto fMRE sequence6 designed to allow interleaved acquisition of two different stimulation (or paradigm) states designated PAR1 and PAR2, at 1Hz (Figure 1). Scans were performed on a 3T Siemens PRISMA scanner without functional stimulation between PAR1 and PAR2 to assess the intra-scan reproducibility. Inter-scan reproducibility was also evaluated. Sequence details: FLASH readout, FA=25 degrees, TE=9.84ms, TR=125ms, MEG amplitude=37mT/m, 9 slices, 8 wave phases, GRAPPA acceleration factor=2 with 24 pre-scan calibration lines, and 4 Hadamard-encoded MEG directions. Acquisition matrices of 128x128, 96x96 and 80x80 were used to acquire data at isotropic spatial resolutions of 1.5mm, 2mm and 2.5mm respectively with corresponding FOVs of 192x192, 192x192 and 200x200mm. Displacement modulated MR phase data were pixel-wise Fourier transformed and the corresponding amplitudes and phases at the mechanical driving frequency were used to compose the complex-valued displacement vector U. Each component of U is 3D Gaussian filtered (sigma=0.25px, support=1x1x1pixel) prior to the calculation of q=curl U. The 3D Helmholtz wave-equation for q was then solved for an isotropic wavelength via minimum χ2. Final maps of the wavelength λ were spike-filtered and smoothed using a 2D Gaussian filter (sigma=1px, support=3x3 pixels). An arbitrary curl-to-divergence ratio of 10 was used as the threshold to mask wavelength maps when calculating statistics of λ. The percentage of valid voxels is used as a data quality measure and calculated as the ratio between the number of voxels that have curl-to-divergence ratio ≥ 10 and the total number of voxels in the brain.Results and Discussion
Reconstructed maps of PAR1 wavelength λ at the central slice from a healthy volunteer at 2.5-, 2- and 1.5-mm isotropic resolution, are shown in Fig. 2. At 1.5-mm spatial resolution, the wavelength map demonstrates much improved alignment with the anatomical reference shown in the axial T1 image with matching FOV. It is also observed that the median wavelength decreases slightly with increasing spatial resolution, whereas the standard deviation follows the opposite trend. When comparing the wavelength images between the two interleaved acquisitions PAR1 and PAR2 acquired in a single fMRE scan (Figures 3a&b), excellent intra-scan reproducibility is observed. Since no functional stimulation was applied between PAR1 and PAR2 in these control scans, the histogram of pixel-by-pixel differences between PAR1 and PAR2 is expected to have a median close to zero, which indeed it is (0.26mm in Figure 3d), and the standard deviation represents the reproducibility between interleaved scans. Similar images were obtained for a second control scan (Figure 3c) that demonstrated robust inter-scan reproducibility. Table 1 summarizes the statistics of reconstructed wavelength maps at all spatial resolutions and demonstrates the consistency between PAR1 and PAR2 images with near 0mm median wavelength differences. Interestingly, the percentage of valid brain voxels did not change significantly despite the expected lower SNR at higher spatial resolution, probably because our quality check criterion is stringent even for 2.5-mm resolution. The standard deviation of the PAR1 and PAR2 differences, however, doubled when acquiring at 1.5-mm iso compared to 2.5-mm.Conclusion
fMRE experiments with functional stimulation require both high spatial resolution, to allow accurate estimation of wavelength in the targeted cortex region associated with an applied stimulation, and excellent repeatability between fast-switching interleaved acquisitions of two stimulation paradigms to make nuanced high-speed neuronal activation measurable. This work demonstrated that within an acceptable scan time, both can be achieved at 1.5-mm isotropic resolution using our Ristretto fMRE sequence. We hypothesize that the increased standard deviation in the reconstructed wavelength at this resolution is not entirely due to decreased SNR but mostly due to the differences in viscoelastic properties between the gray and white matter, now measurable at 1.5-mm resolution, as further studied in a separate abstract by our group. This hypothesis will be validated in a group analysis in the near future.Acknowledgements
This project is supported by NIH grants R01EB028664 and K01EB027726, the Department of Radiology at Brigham and Women’s Hospital, and the European Union’s Horizon 2020 grant 668039.References
- Patz S, Fovargue D, Schregel K, et al., “Imaging localized neuronal activity at fast time scales through biomechanics,” Sci. Adv. 2019;5(4): eaav3816.
- de Arcos J, Fovargue D, Schregel K, Neji R, Patz S and Sinkus R, “Imaging primary neuronal activity in the human visual cortex,” presented at the ISMRM, Paris, 2018.
- de Arcos J, Fovargue D, Neji R, Patz S and Sinkus R, Spatial-temporal dynamics of the visual cortex stiffness driven by a flashing checkerboard stimulus,” presented at the ISMRM, Montreal, 2019.
- Lan P, Glaser K, Ehman R and Glover G, “Simultaneous fMRE and fMRI measures the viscoelastic and BOLD responses of the human brain to functional activation in the visual cortex,” presented at the ISMRM, Montreal, 2019.
- Fabry B, Maksym GN, Butler JP, Glogauer M, Navajas D and Fredberg JJ, “Scaling the microrheology of living cells,” Phys. Rev. Lett. 2001;87: 148102.
- Guenthner C, Sethi S, Troelstra M, Dokumaci AS, Sinkus R and Kozerke S, “Ristretto MRE: a generalized multi-shot GRE-MRE sequence,” NMR in Biomedicine. 2019;32(5): e4049.
Figures
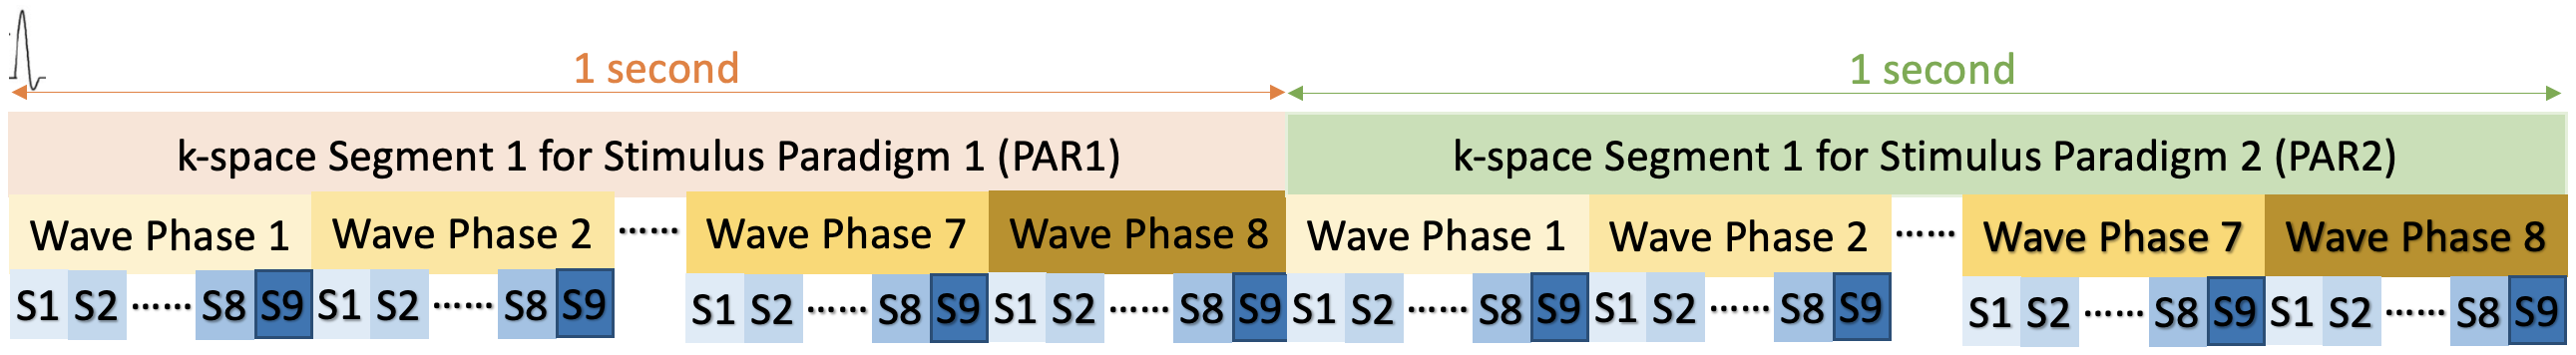
Fig.1: Schematic of fMRE data acquisition with interleaved stimulus paradigms, i.e., PAR1 & PAR2, each containing 9 slices and 8 wave phases. A trigger signal is sent out at the beginning of each block shown to synchronize the k-space acquisition with mechanical vibrations for both paradigms with the loop hierarchy. This block is repeated for each k-space line acquisition and MEG-encoding direction. For fMRE scans with functional activation, a stimulus will be switched ON and OFF in sync with PAR1 and PAR2 sequence timing. In this study, no stimulus is used for either PAR1 or PAR2.
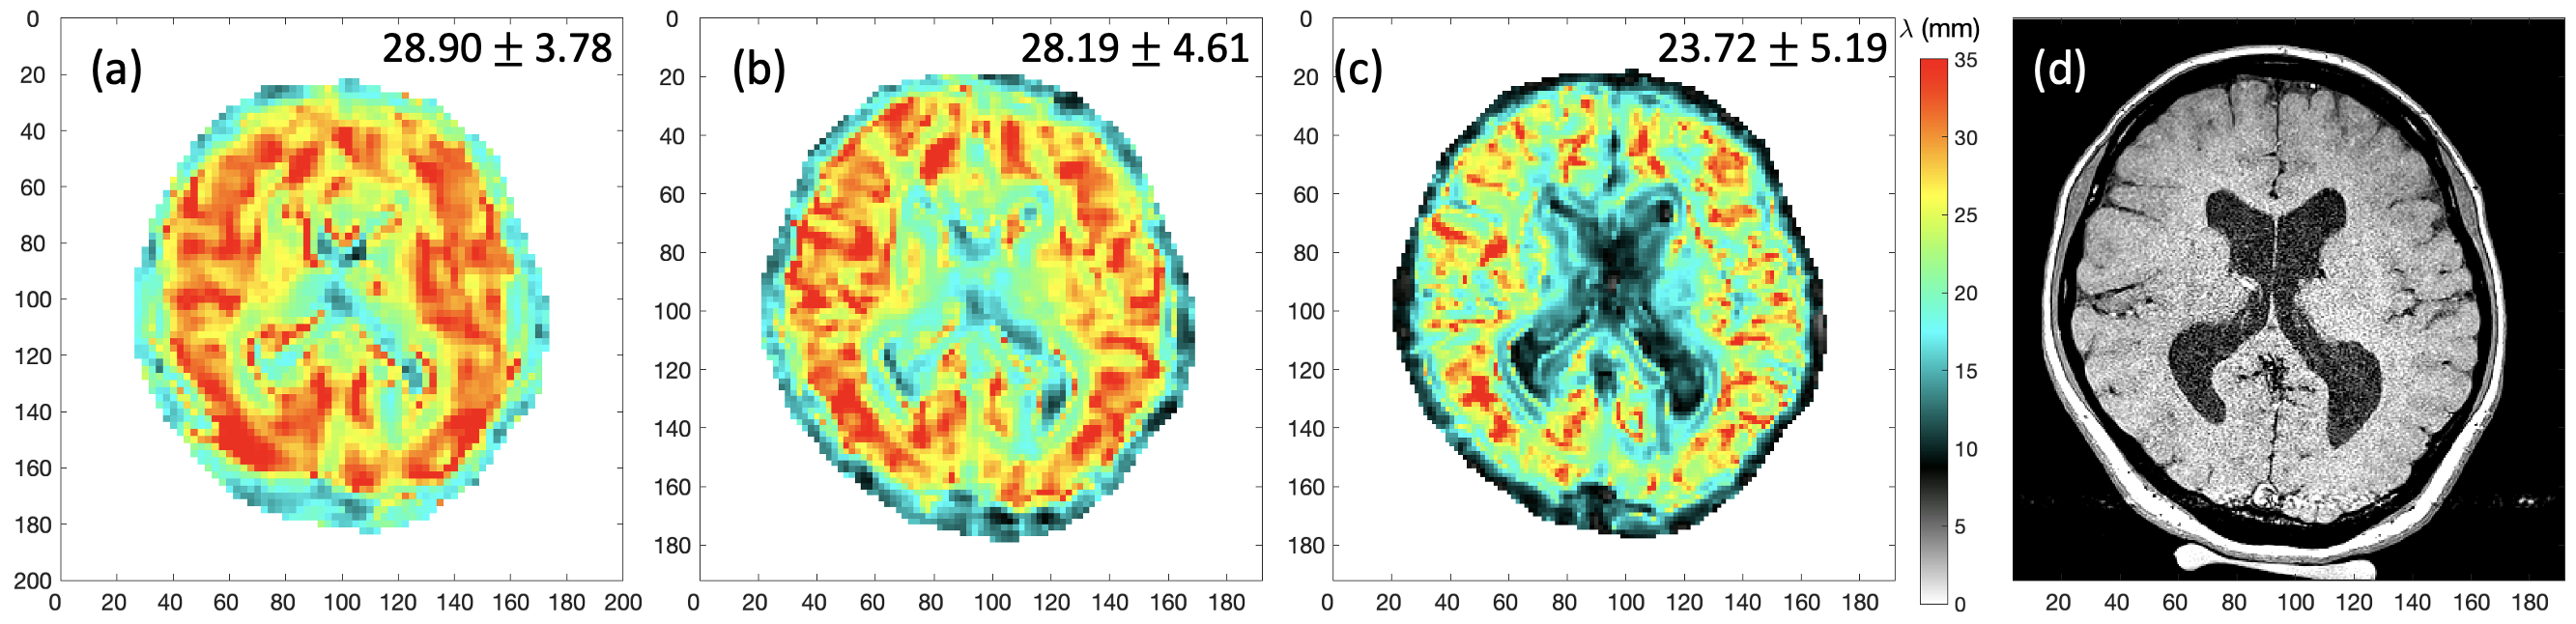
Fig.2: Comparison of reconstructed wavelength maps (λ in mm) of a healthy volunteer acquired at three different spatial resolutions: (a) 2.5 mm isotropic; (b) 2 mm isotropic; and (c) 1.5 mm isotropic voxels. Axial T1 image of 0.5 mm in-plane resolution of the matching slice is shown in (d). Median and standard deviation of valid brain region voxels in the slice are shown on top right corner.
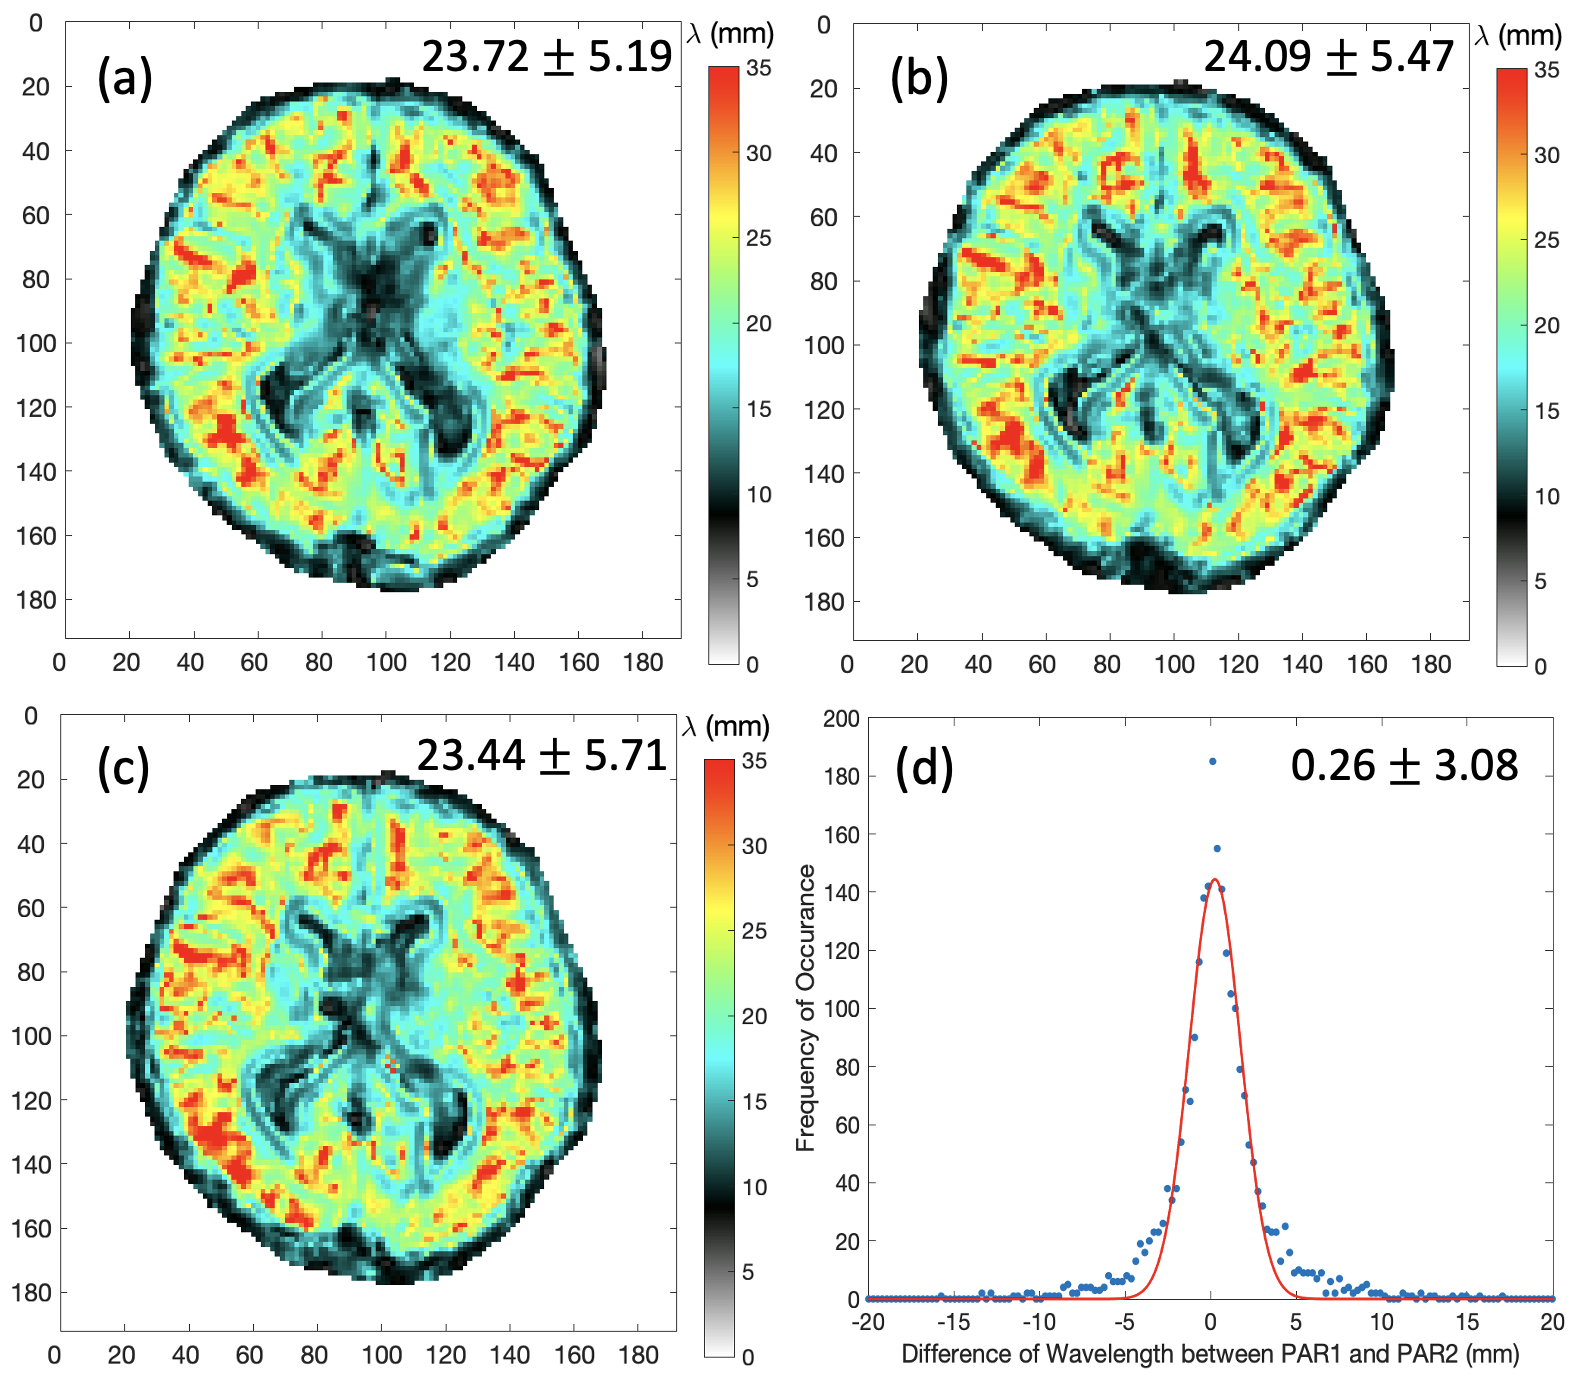
Fig.3: Wavelength maps (mm) of a healthy volunteer acquired with 1.5-mm isotropic spatial resolution. Intra-scan reproducibility is evaluated between (a) and (b) acquired as PAR1 and PAR2 in the same control fMRE scan. Inter-scan reproducibility is evaluated between (a) and (c) where another control scan was acquired separately. Subplot (d) shows the histogram of the voxel-by-voxel differences in wavelength between PAR1 and PAR2 shown in (a) and (b) with a one-term Gaussian fit. Median and standard deviation of valid brain region voxels are shown on top right corner.
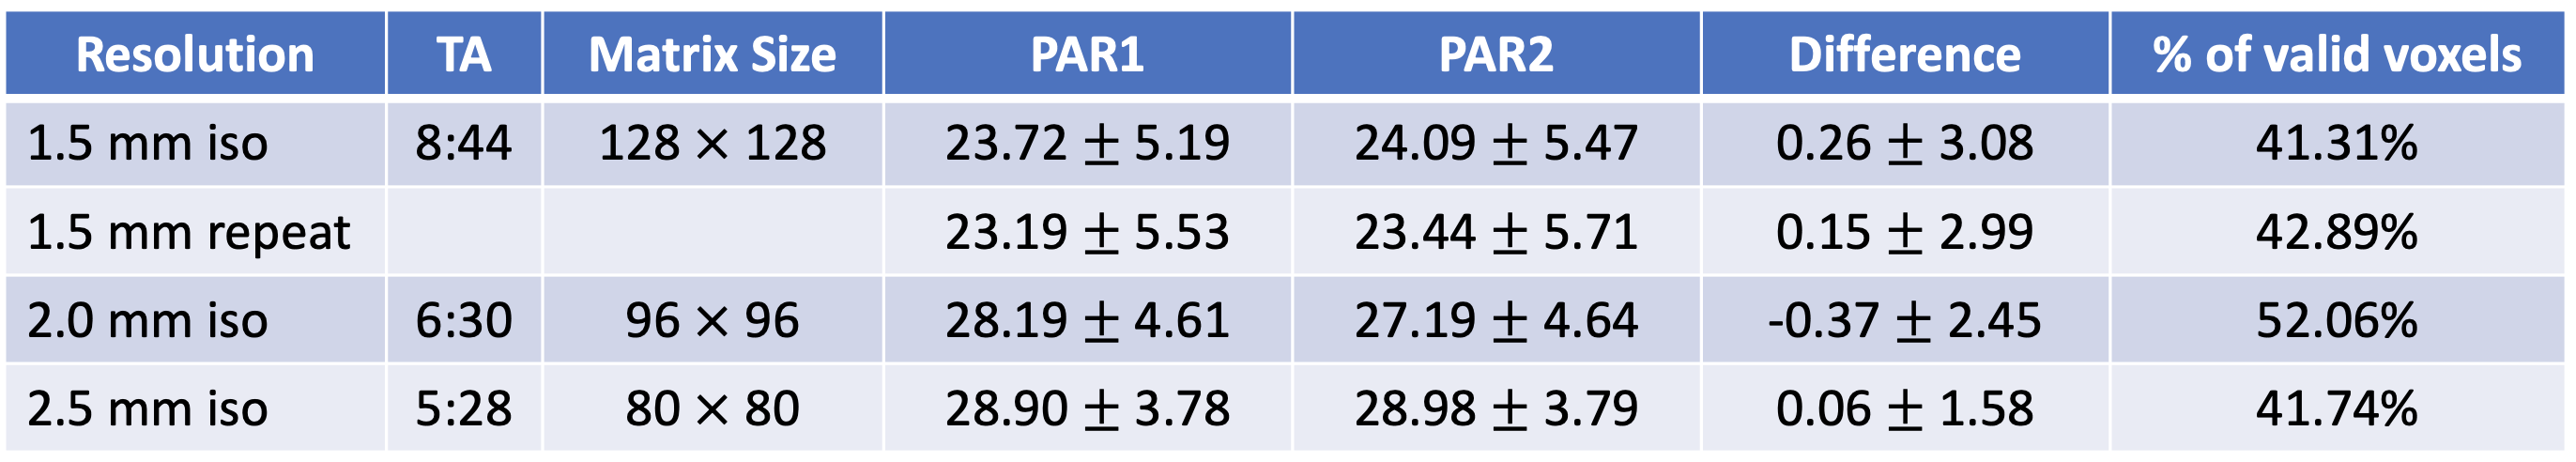
Table 1: Acquisition parameters, as well as the median and standard deviation values of reconstructed wavelength (λ in mm) of PAR1, PAR2 and their difference for three spatial resolution. The percentage of valid voxels is used as a data quality measure and calculated as the ration between the number of voxels that have curl-to-divergence ratio ≥10 and the total number of voxels within the brain region.