1028
Intra-patient comparison of 3D and 2D MRE techniques for assessment of liver fibrosis
Roberta Catania1, Amir A. Borhani1, Camila Lopes Vendrami1, Roger C Grimm2, Bradley D. Bolster3, and Frank Miller1
1Northwestern University Feinberg School of Medicine, Chicago, IL, United States, 2Mayo Clinic, Rochester, MN, United States, 3Siemens Medical Solutions USA, Inc., Salt Lake City, UT, United States
1Northwestern University Feinberg School of Medicine, Chicago, IL, United States, 2Mayo Clinic, Rochester, MN, United States, 3Siemens Medical Solutions USA, Inc., Salt Lake City, UT, United States
Synopsis
3D MRE allows volumetric assessment of liver stiffness. Performance of this method as compared to 2D techniques (GRE and seEPI), was evaluated, with respect to the ROI areas per slice, stiffness values, and presence of artifacts. The 3D MRE provided larger area of liver and was less prone to artifacts. Liver Stiffness Measures (LSM) based on 3D technique were lower than 2D technique. 3D MRE exhibits less susceptibility to artifacts and provides larger measurable areas of liver. LSM based on 3D MRE however were lower than 2D techniques.
Introduction
The purpose of this study was to evaluate performance of 3D magnetic resonance elastography (MRE) using spin-echo echo-planar imaging (seEPI) for assessment of liver stiffness compared with 2D seEPI and 2D gradient recalled echo (GRE) sequences.Materials and Methods
The study was approved by IRB. Imaging studies of patients who underwent liver MRE in a single institution between September 2020 and December 2020 were analyzed retrospectively. All studies were performed using the same 1.5T scanner (MAGNETOM Aera, Siemens Healthcare, Erlangen, Germany) and included 2D GRE MRE and prototype 2D and 3D seEPI MRE sequences. Liver stiffness maps (elastograms) were generated using a 2D and 3D multi-modal direct inversion algorithm, respectively (Mayo Clinic, Rochester MN). The output of these inversions includes a confidence mask that excludes areas determined by the algorithm to be unreliable measurements. Four axial slices were obtained through the liver for GRE and 2D seEPI techniques while 26 slices were generated by 3D seEPI MRE. Elastograms with confidence masks were used for quantitative assessment. A polygonal region of interest (ROI) was manually drawn on each slice, using the magnitude images as the anatomic reference, in order to include the largest cross section of liver while carefully avoiding the liver edge, major vessels, gallbladder fossa, and areas of wave interferences ¹,². A separate “non-curated” ROI was also drawn simply to include the largest cross section of liver within the confidence mask (irrespective of presence of wave interference) to assess the contribution of artifacts. Mean and standard deviation of stiffness (in kPa) was recorded for each measurement, as well as the corresponding ROI area. Liver stiffness measure (LSM) was calculated as the arithmetic mean of individual stiffness values for the acquired slices for each MRE technique. For 3D MRE technique, the 4 slices with the largest cross section were also used for calculation of LSM (so called “abbreviated LSM”). LSMs were categorically classified as advanced (≥4 kPa), significant (≥3.5 kPa), and non-significant (<3.5 kPa)³. Failure of MRE was defined as lack of propagation of waves through the liver and/or complete exclusion of liver on confidence mask. Two-tailed paired t-test, Pearson correlation coefficient, and intraclass coefficient correlation (ICC) were used to assess the concordance and intra-patient variations between LSMs calculated by different pulse sequences and different methods of ROI placement. The magnitude of discordance was evaluated by Bland-Altman plots. A p-value <0.05 was set as a statistically significant difference.Results
33 patients (17 males, mean age 55 ± 12.6, mean BMI 33.6 ± 8.1) were included in the study. Except for single case of failure with GRE technique, all the MREs were deemed diagnostic. The total area of the curated ROIs (based on 4 slices) were 5601 mm² (± 3597), 9358 mm² (± 4132), and 12131 mm² (± 11383) for GRE, 2D seEPI, and 3D MREs, respectively. The curated ROIs based on 3D technique were significantly larger than the ones by GRE technique (p<0.002). Although there was a trend for increased size, the ROIs derived from 3D MRE were not significantly different from 2D seEPI based on paired statistics (p=0.17). While the LSMs based on curated and non-curated ROIs were significantly different for GRE and 2D seEPI (p<0.002 and p<0.001), these 2 methods of segmentation were not significantly different for 3D MRE (p=0.943). Abbreviated 3D LSM (based on 4 slices) had excellent correlation with 3D LSM (based on all slices) (r=0.932; p<0.001) and the LSM based on these 2 approaches were not significantly different (p=0.459). LSM based on 3D technique ranged between 1.92 and 6.7 (mean 3.17 ± 1.16). 3D LSM had excellent correlation with both 2D techniques (r=0.941 and r=0.932 for GRE 2D and seEPI 2D, p<0.001). Notably, 3D LSM was generally lower than its 2D counterparts which was statistically different from GRE LSM (p<0.001) but did not reach statistical significance when compared to 2D seEPI LSM (p=0.058). In 9 patients, there were >0.5 kPa difference between the 3D LSM and 2D seEPI LSM. In 8 patients, the 2D and 3D LSMs resulted in allocation to different fibrosis categories. Most of these cases had small liver area on the 2D confidence map which could have resulted in less accurate measurements.Conclusions
3D seEPI MRE is a robust technique providing larger cross section of liver for measurement (both per slice and in total) and hence a better representation the global liver stiffness. Our preliminary results showed this technique to be less prone to wave interference artifacts, which can translate into more accurate and more reproducible measurement of liver stiffness. Our study also showed that the need for curated ROI placement (which requires higher level of experience) is less crucial for 3D technique which makes this technique more robust and a better option for automated segmentation. While the LSM values based on the 3D technique had excellent correlation with 2D methods, the individual values were slightly lower which reached statistical significance when compared to GRE technique. This difference, which could be attributed to less incidence of “hot spots” on 3D technique, suggests the need for further calibration and definition of new fibrosis classification threshold values for this emerging technique.Acknowledgements
No acknowledgement found.References
1. Idilman IS, Li J, Yin M, Venkatesh SK. MR elastography of liver: current status and future perspectives. Abdom Radiol (NY). 2020 Nov;45(11):3444-3462. doi: 10.1007/s00261-020-02656-7. Epub 2020 Jul 23. PMID: 32705312. 2. Venkatesh SK, Wells ML, Miller FH, Jhaveri KS, Silva AC, Taouli B, Ehman RL. Magnetic resonance elastography: beyond liver fibrosis-a case-based pictorial review. Abdom Radiol (NY). 2018 Jul;43(7):1590-1611. doi: 10.1007/s00261-017-1383-1. 3. Venkatesh SK, Ehman RL. Magnetic resonance elastography of liver. Magn Reson Imaging Clin N Am. 2014 Aug;22(3):433-46. doi: 10.1016/j.mric.2014.05.001.Figures
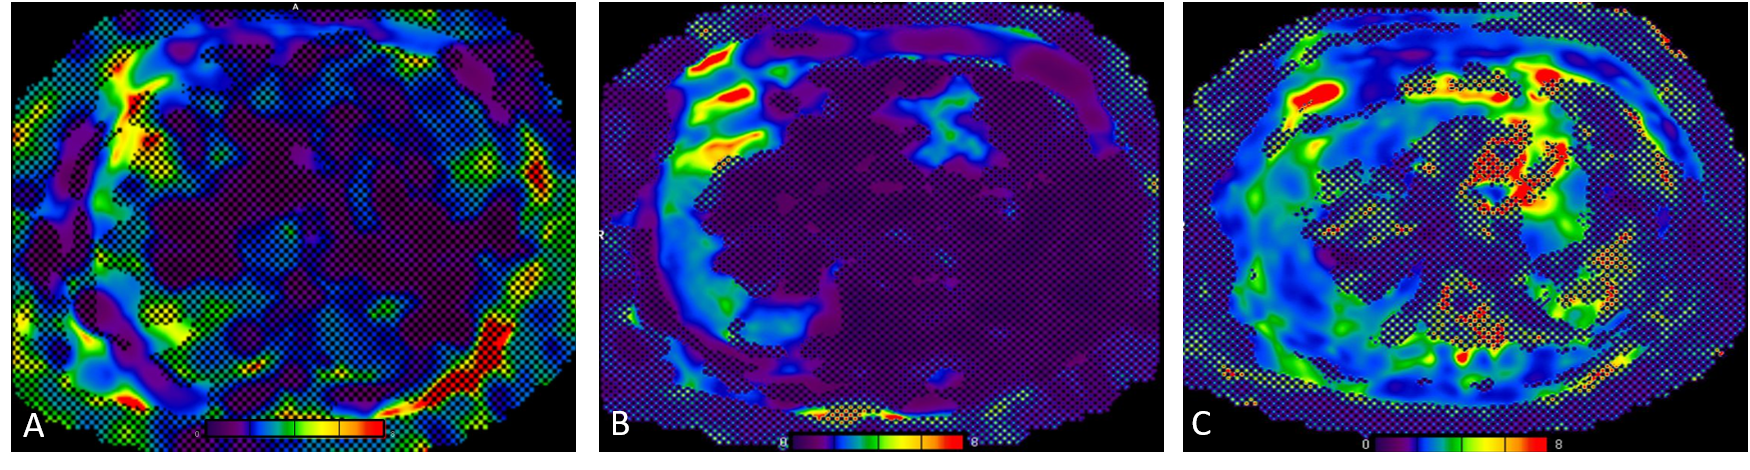
Elastograms with overlying confidence maps
obtained with 2D GRE (A), 2D EPI (B), and 3D EPI (C) MR elastography techniques
in a 70-year-old male patient with non-alcoholic fatty liver disease. The liver
parenchyma available for LSM measurement was significantly larger with 3D MRE.
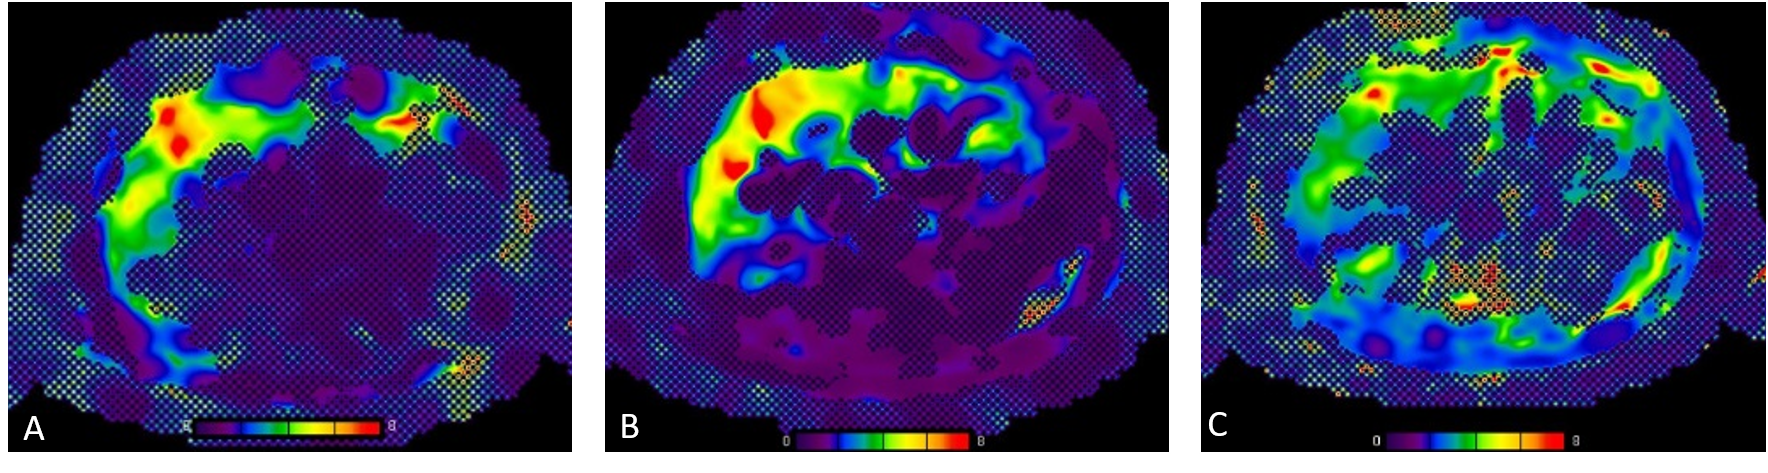
Colored
elastogram with
confidence map using 2D GRE (A), 2D EPI (B), and 3D EPI (C) MRE techniques in a
78-year-old male with history of alcoholic hepatitis. Images were obtained from
the same anatomic level. LSMs were 4.13 kPa, 4.44 kPa, and 3.39 kPa for the 3
techniques, respectively. 3D technique shows lower occurrence of wave interference
(“hot spots”) artifact which can explain the lower LSM with this technique.
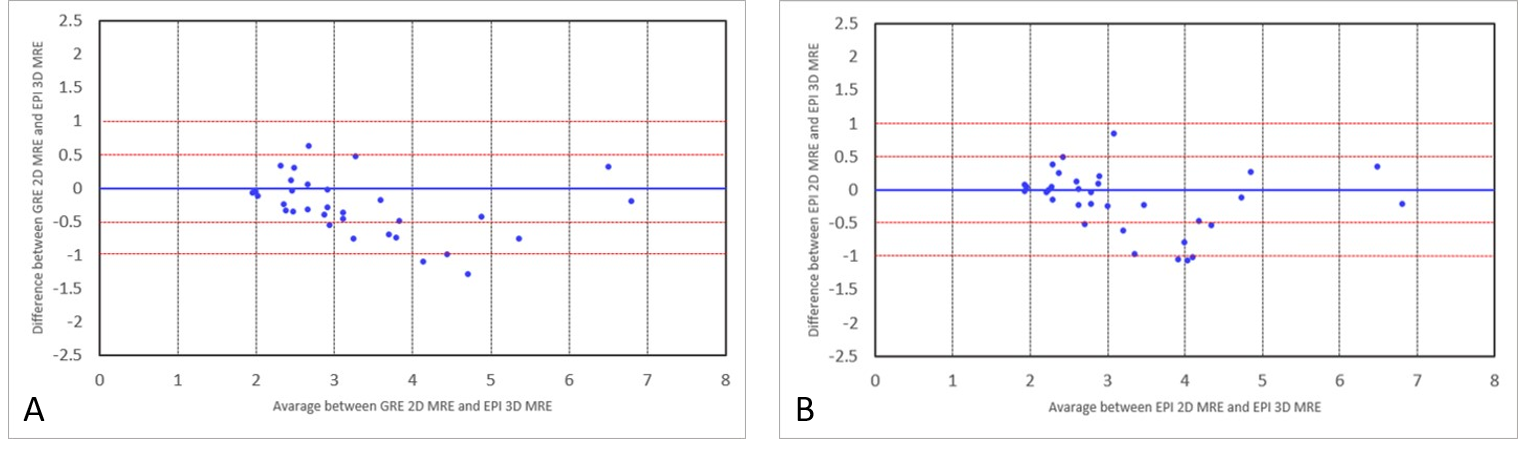
Bland-Altman
plots showing magnitude of variation of LSMs between 3D EPI and 2D GRE (A), and
between 3D EPI and 2D EPI (B). Arbitrary lines for 0.5 kPa and 1 kPa difference
in LSMs are drawn.
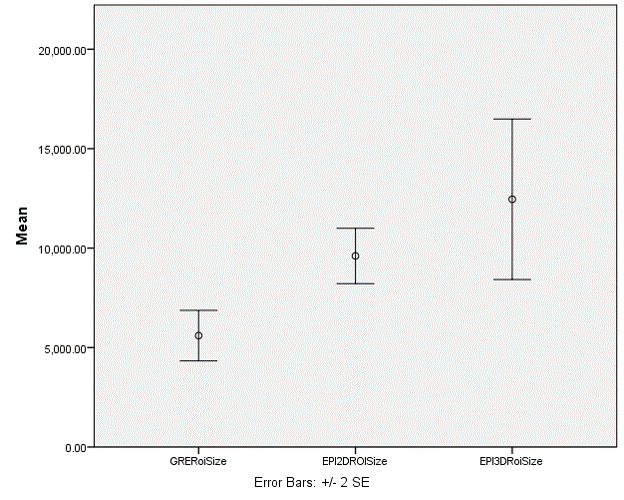
Error
bar graph illustrating mean surface area of the curated ROIs (based on 4
slices) for 2D GRE, 2D EPI, and 3D EPI MRE techniques. Surface area of ROIs based on 3D technique
was significantly larger than the GRE techniques (p<0.05).