1026
Cerebral inversion recovery MR elastography for cortical stiffness quantification
Ledia Lilaj1, Helge Herthum2, Tom Meyer2, Mehrgan Shahryari2, Gergely Bertalan2, Alfonso Caiazzo2, Jürgen Braun3, Thomas Fischer2, Sebastian Hirsch4,5, and Ingolf Sack2
1Radiology, Charité – Universitätsmedizin Berlin, Berlin, Germany, 2Charité – Universitätsmedizin Berlin, Berlin, Germany, 3Institute of Medical Informatics, Charité – Universitätsmedizin Berlin, Berlin, Germany, 4Berlin Center for Advanced Neuroimaging, Charité – Universitätsmedizin Berlin, Berlin, Germany, 5Bernstein Center for Computational Neuroscience, Berlin, Germany
1Radiology, Charité – Universitätsmedizin Berlin, Berlin, Germany, 2Charité – Universitätsmedizin Berlin, Berlin, Germany, 3Institute of Medical Informatics, Charité – Universitätsmedizin Berlin, Berlin, Germany, 4Berlin Center for Advanced Neuroimaging, Charité – Universitätsmedizin Berlin, Berlin, Germany, 5Bernstein Center for Computational Neuroscience, Berlin, Germany
Synopsis
Inversion recovery magnetic resonance elastography (IR-MRE) is a new acquisition technique that performs MRE while selectively nulling the signal generated by one compartment with a specific T1. In phantom and in vivo experiments, free fluid, water or cerebrospinal fluid, was nulled. The shear wave speed (SWS) maps showed no overall change in average values. However, in cortical areas, IR-MRE revealed cortical SWS values 10% higher than in standard MRE, resulting in sharper tissue-CSF interfaces. Besides, ventricles are 39% narrower in IR-MRE than in MRE. In conclusion, IR-MRE allows a more precise quantification of cortical stiffness.
Introduction
Magnetic resonance elastography (MRE) is an emerging imaging technique that allows the analysis of structural changes of soft tissues reflected in their viscoelastic properties. This approach is based on shear wave displacement fields acquired by motion-sensitive phase-contrast imaging sequences and analyzed for estimating shear modulus using inversion routines. One organ that introduces several challenges to an MRE investigation is the brain. One specific challenge is the abundance of solid-fluid interfaces and the presence of freely moving liquid such as cerebrospinal fluid (CSF) near solid tissue boundaries. Therefore, we propose novel inversion recovery MRE (IR-MRE) of the human brain for suppression of CSF signal and quantification of stiffness values in cortical regions unaffected by nearby CSF.Methods
A phantom was produced by diluting 400 mg of melted ViroGel® (Bego, Bremen, Germany) with 400 ml of water. After full solidification, the solid phantom was overlaid with water, as shown in Figure 1a. For the in vivo experiment, 11 male volunteers without any history of neurological events (mean age ± SD: 34 ± 12 years, age range: 22-60 years) were recruited. All the measurements were performed in a 3T MRI scanner (Siemens Prisma Fit, Erlangen, Germany) using a 32-channel head coil. The oscillatory vibration was induced by two pressurized air drivers (Figure 1b). In the phantom experiment, both IR-MRE and standard MRE were applied using 120.05 Hz harmonic vibrations. IR-MRE was performed by standard single-shot, spin-echo echo-planar imaging MRE following 1970-ms inversion recovery time (TI) for nulling the free water signal. Ten axial slices were acquired with 110 × 108 matrix size of 2 × 2 × 3 mm resolution using parallel imaging with GRAPPA factor 2. Echo time (TE) and repetition time (TR) were 64 ms and 28920 ms. The total acquisition time was 24 minutes. A diagram of the IR-MRE sequence is shown in Figure 2. Data were analyzed for shear wave speed (SWS) as an indicator of tissue stiffness by wavenumber-based multi-component inversion [1]. In vivo experiments were performed with the same drivers (Figure 1c) but 31.75 Hz harmonic vibrations and TI = 2800 ms for nulling the CSF signal. All other parameters identical to the phantom. Regions of interest (ROIs) of cortical brain tissue were automatically selected by thresholding time-averaged MRE magnitude signals providing binary masks of the parenchyma of the brain of each volunteer. Masks of cortical regions were automatically generated by selecting a three-voxel thick contour in the parenchyma ROIs. The average SWS values estimated with MRE and IR-MRE of parenchyma and cortical region, magnitude signal SNR, wave SNR (estimated with Donoho’s method [2]), and parenchyma size were analyzed and compared using Student’s paired t-tests.Results
Signal from the fluid compartments was efficiently nulled, both in the phantom and in vivo magnitude images (Figure 3 and 4). The fluid-filled areas appear noisy in IR-MRE. In the phantom experiment, SWS maps revealed that mean stiffness values of the solid gel were not significantly different in MRE and IR-MRE (MRE: 4.5 ± 0.3 m/s, IR-MRE: 4.7 ± 0.3 m/s, p = 0.09). However, MRE in the free water compartment showed spuriously high SWS values while IR-MRE better reflected shear stiffness close to zero in free water. Moreover, IR-MRE did not show the very low values of SWS usually present at boundary areas, which are due to very high gradients in shear strain (Figure 3). In the in vivo study, SNR in IR-MRE was 17% lower than in standard MRE, however, without influencing parenchymal SWS, which did not show significant differences (MRE: 1.38 ± 0.02 m/s, IR-MRE: 1.39 ± 0.03 m/s, P = 0.18). Tissue-CSF interfaces appeared sharper in IR-MRE as reflected by 10% higher SWS values in cortical areas (MRE: 1.01 ± 0.03 m/s, IR-MRE: 1.11 ± 0.01 m/s, P < 0.001) and 39% smaller ventricle sizes than in standard MRE maps (P < 0.001) (Figure 4 and 5).Conclusions
Our results show that MRE of the cerebral cortex is degraded by fluid vibrations, which are suppressed in IR-MRE. Consequently, IR-MRE improves the quantification of cortical stiffness values in the human brain. Moreover, MRE and IR-MRE resulted in similar stiffness values in brain parenchyma. This indicates that shear wavelengths in solid and fluid compartments are identical, consistent with the theory of biphasic poroelastic media [3], which has been successfully applied to brain tissue in previous studies [4].Acknowledgements
The authors gratefully acknowledge support from the German Research Foundation (GRK2260 BIOQIC, SFB1340 Matrix in Vision).References
- Tzschatzsch H, Guo J, Dittmann F, Hirsch S, Barnhill E, Johrens K, Braun J, Sack I. Tomoelastography by multifrequency wave number recovery from time-harmonic propagating shear waves. Medical Image Analysis 2016;30:1-10.
- Donoho DL, Johnstone IM, Kerkyacharian G, Picard D. Wavelet shrinkage – asymptopia? Journal of the Royal Statistical Society Series B-Methodological 1995;57(2):301-337.
- Hirsch S. A Biphasic Poroelastic Model for Soft Tissues. In: Sack I, Schaeffter T, editors. Quantification of Biophysical Parameters in Medical Imaging. 1st ed. Heidelberg: Springer; 2018. p 71.
- Lilaj L, Fischer T, Guo J, Braun J, Sack I, Hirsch S. Separation of fluid and solid shear wave fields and quantification of coupling density by magnetic resonance poroelastography. Magn Reson Med. 2020; 85: 1655–1668.
Figures
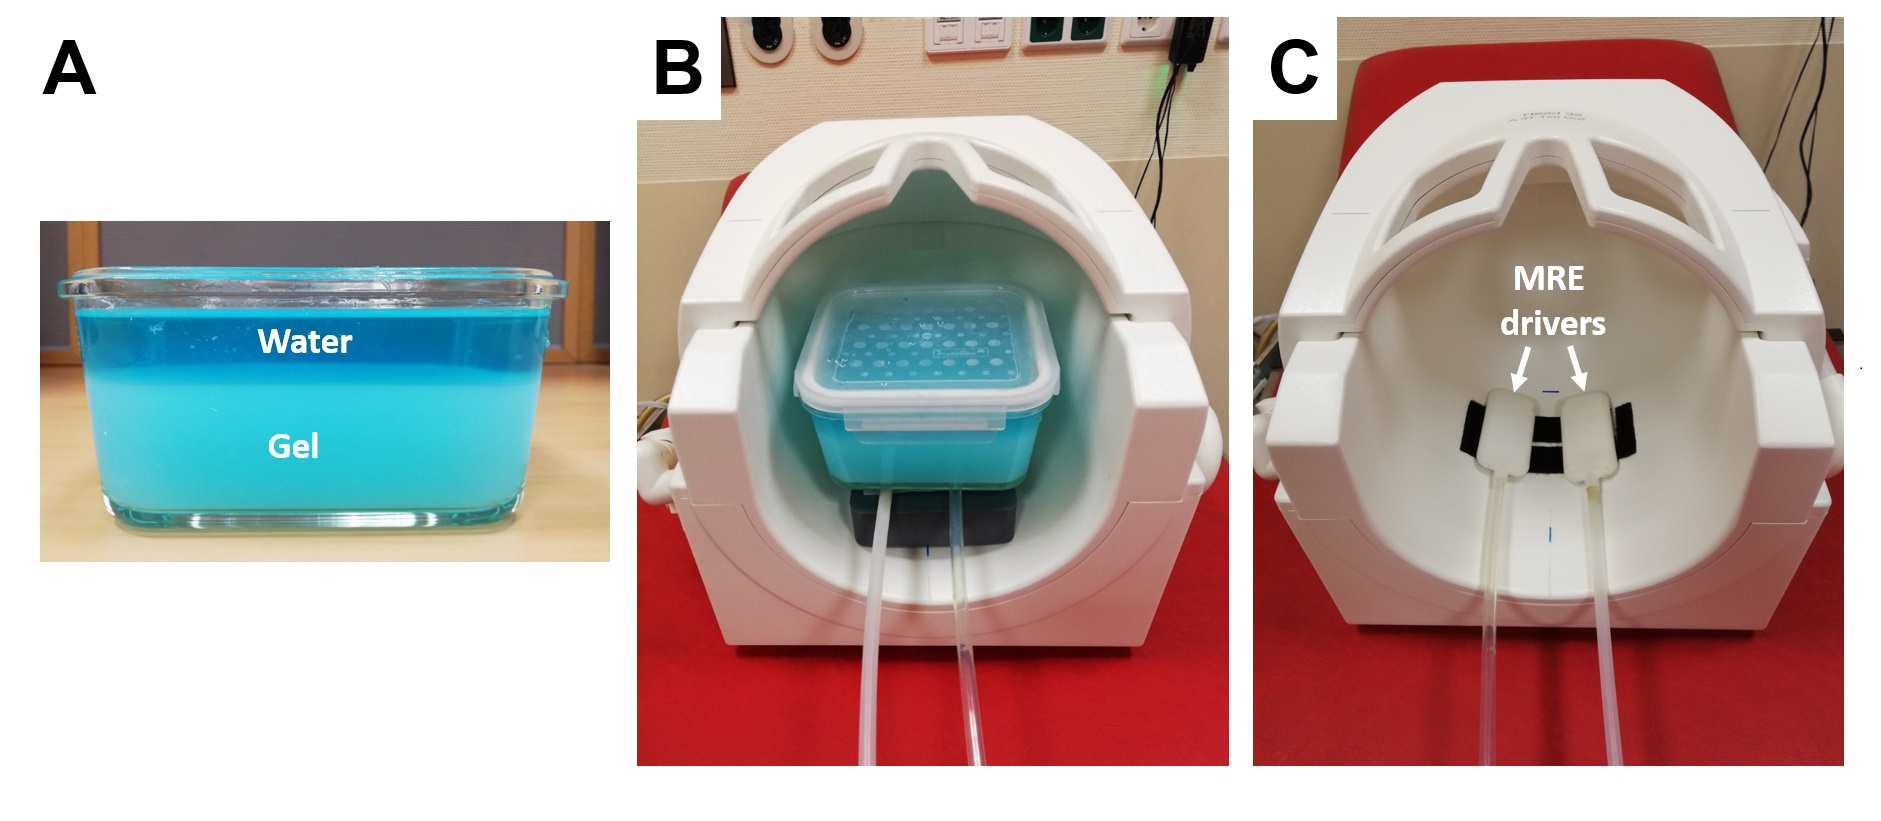
Experimental
setup. (A) Phantom consisting of
solid and fluid layers to demonstrate fluid-solid motions induced and encoded
by MRE and IR-MRE. (B) Placement of
the phantom in the head RF coil of the MRI scanner on top of two pressurized
air actuators. (C) Pressurized air
actuators for in vivo brain experiments. The head is placed directly on top of
the two drivers to induce lateral (rotational) motion.
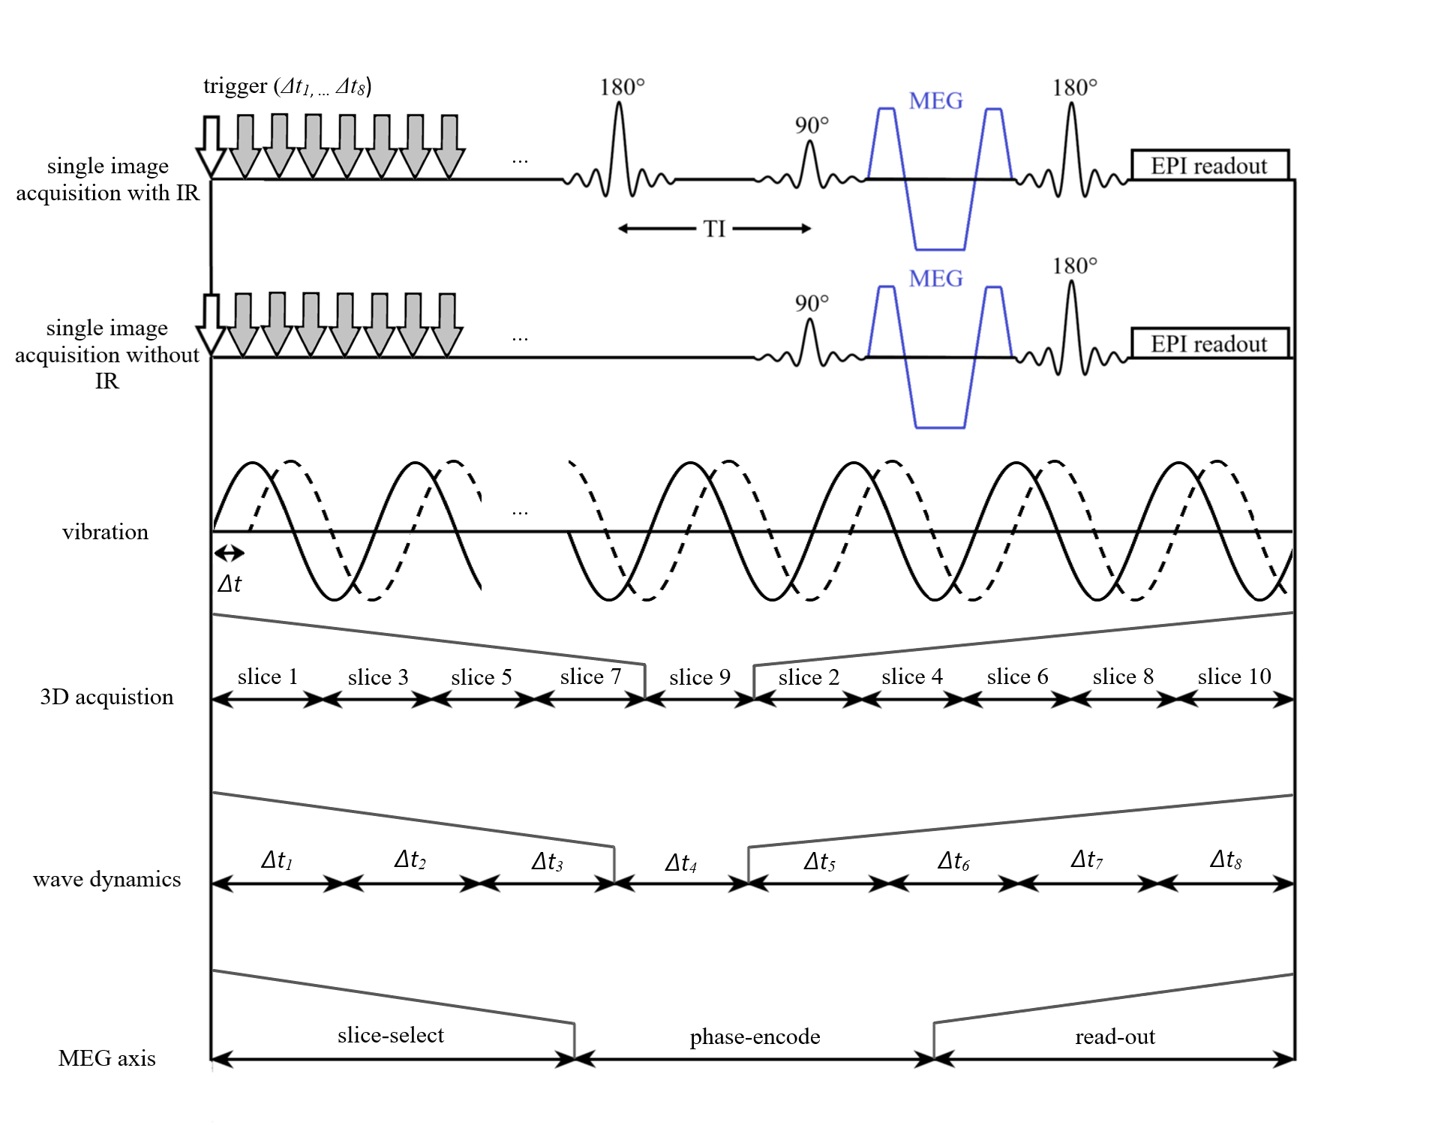
Sequence
timing diagrams for MRE and IR-MRE. Note that the time axis is not to scale.
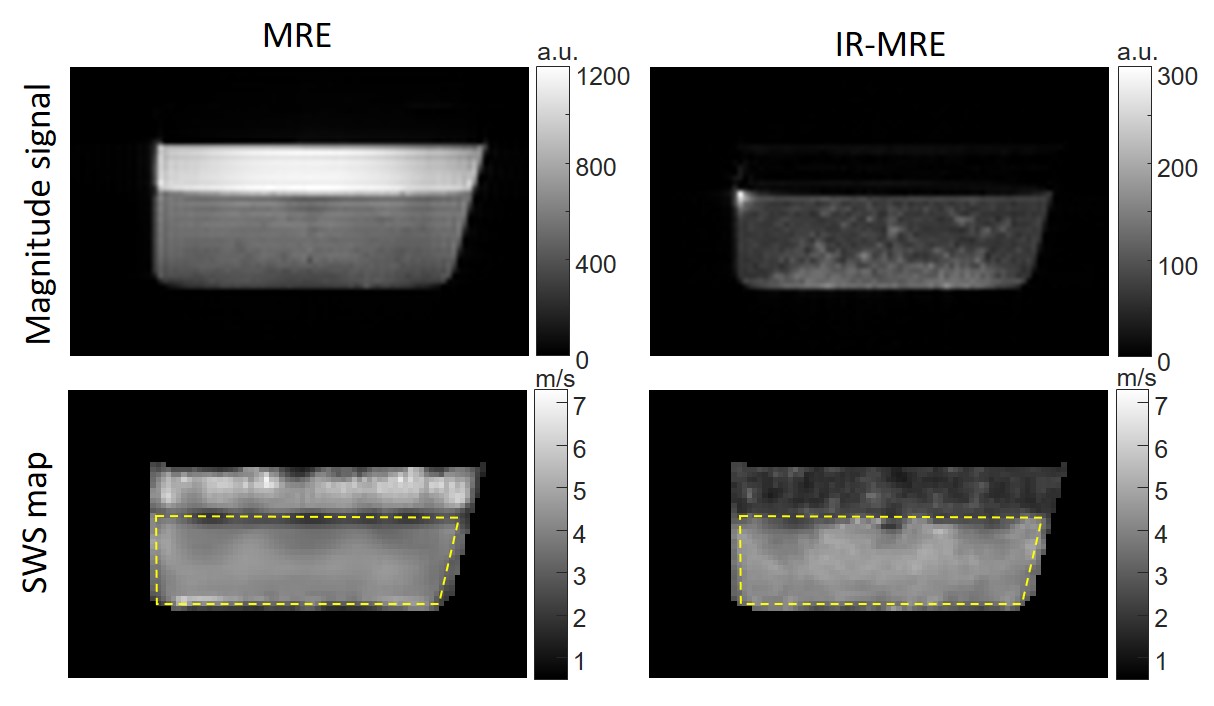
In
the phantom IR-MRE magnitude images, the fluid compartment appears dark instead
of bright, as in the MRE images. The suppressed liquid in IR-MRE appears dark
in the SWS map instead of spuriously bright as in MRE due to surface waves
inside the liquid. The
fluid-solid interface appears stiffer in the solid compartment when fluid
motion is suppressed.
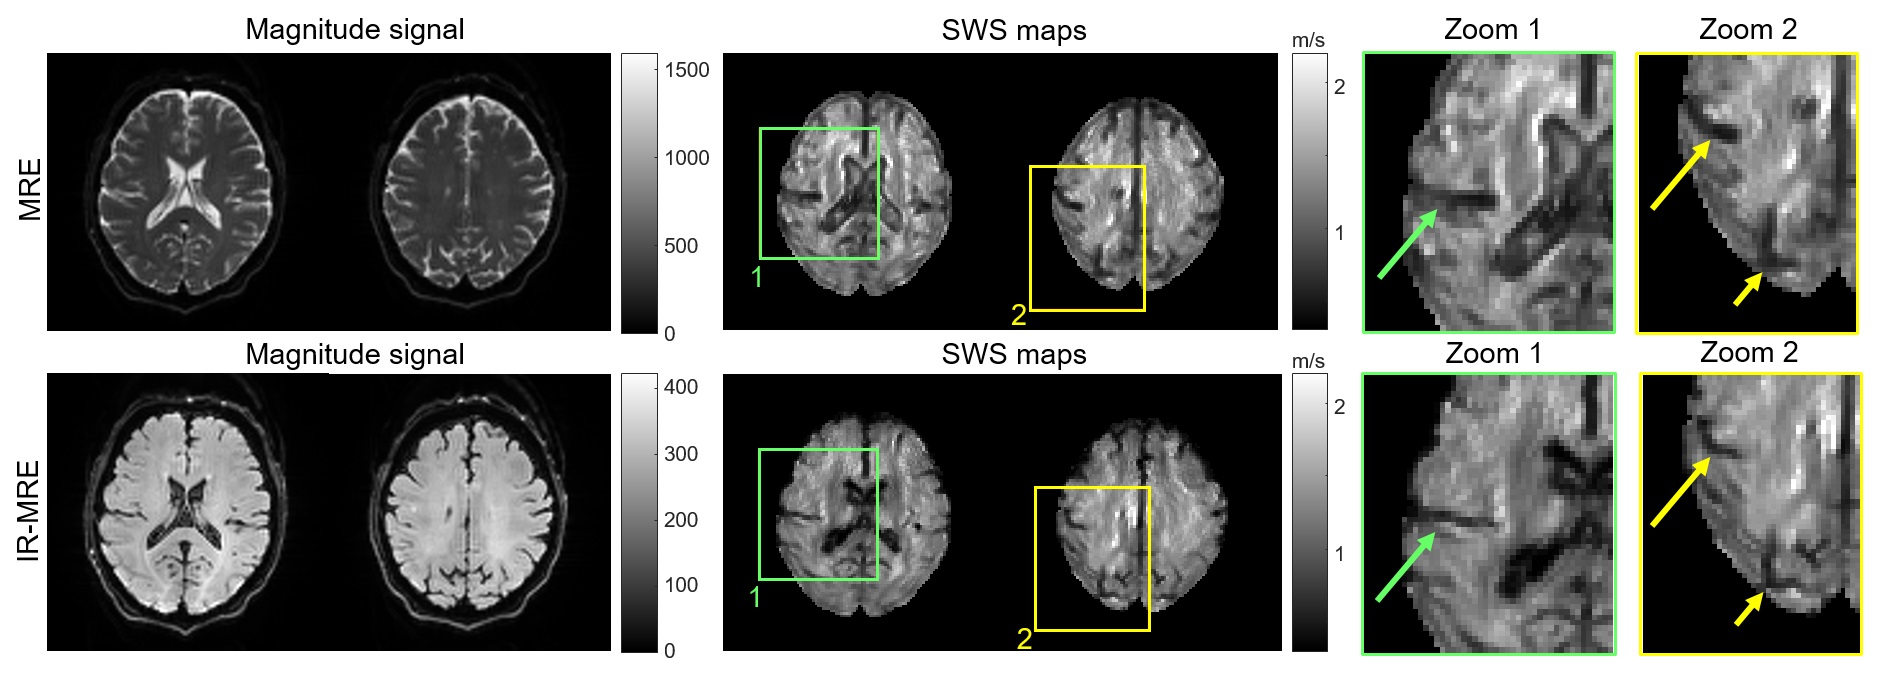
Representative brain images obtained by MRE and IR-MRE in the same
volunteer. The magnitude signals in IR-MRE show solid tissue without freely moving
water, leading to significantly improved depiction of fluid-solid boundaries in
SWS maps (arrows). Note that sulci and ventricles are narrower in IR-MRE than
MRE due to suppressed phase discontinuities, similar to the phantom experiments
shown in Figure 3.
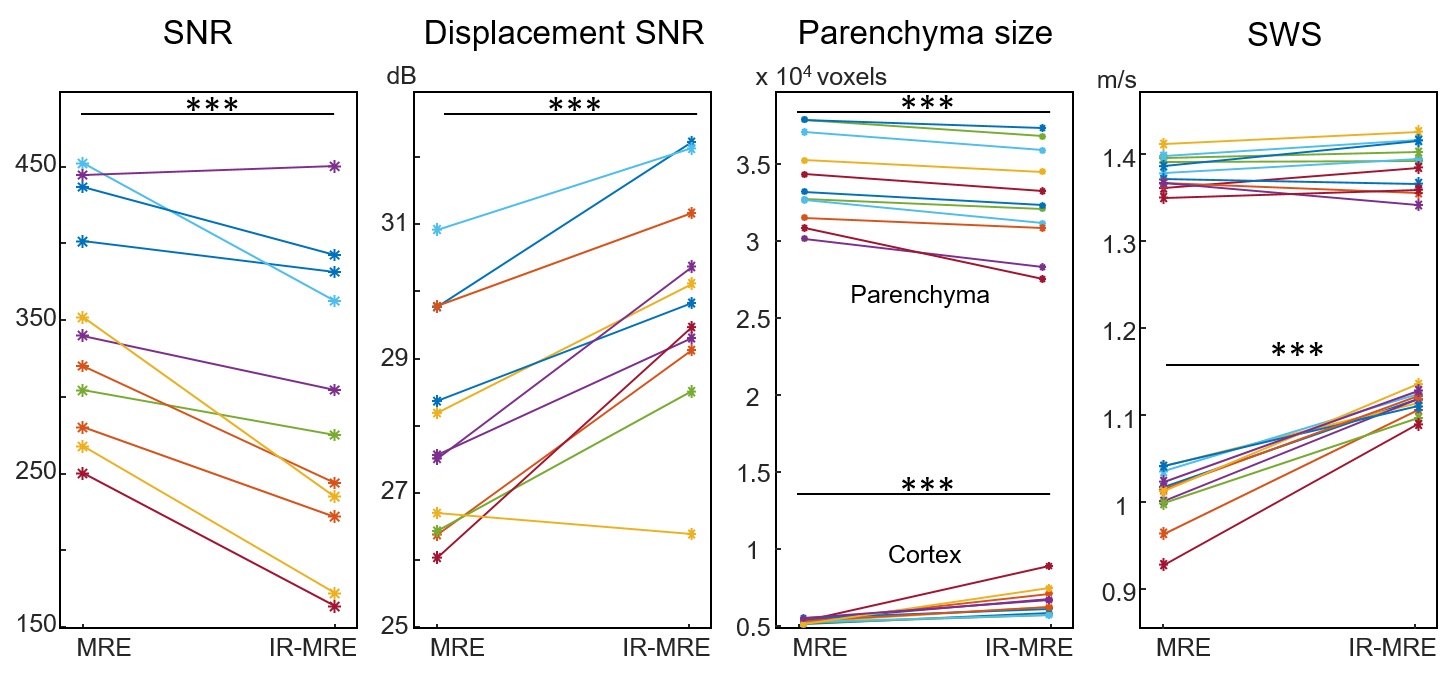
Group values of parameters quantified in this study. *** p < 0.001.