1023
Magnetic resonance elastography of the in vivo human brain using multifrequency wavenumber analysis in 2D and 3D.1Experimentelle Radiologie, Charité Universitätsmedizin Berlin, Berlin, Germany, 2Institut für medizinische Informatik, Charité Universitätsmedizin Berlin, Berlin, Germany
Synopsis
Wavenumber analyses in MR elastography (MRE), which use first-order finite difference operators, are known to be more stable against noise than second-order finite derivative methods. However, wavenumber analyses for the human brain normally suffer from abundant heterogeneities and solid-fluid interfaces. We here present multifrequency wavenumber analysis for MRE of the human brain in 2D and 3D based on adapted bandpass filters. We show that both approaches provide better repeatability in test-retest experiments compared to standard analyses. Moreover, wavenumber analyses yield stable values and rich detail in regions of lower signal-to-noise-ratio such as deep gray matter.
Introduction
In vivo mechanical properties of soft tissues as measured by magnetic resonance elastography (MRE) are increasingly recognized as being sensitive to various diseases[1-3].Inversion techniques that determine wavenumbers based on the phase gradient of propagating plane waves (first-order finite difference operator (FDO)) such as two-dimensional multifrequency wavenumber inversion (k-MDEV)[4] have been widely used in abdominal MRE and were recently applied to mouse brain MRE[5]. In the human brain, however, inversion techniques such as multifrequency dual elasto-visco inversion (MDEV)[6] are normally used, which are based on the direct solution of the Helmholtz equation invoking second-order FDO[7-9].
FDO-based stiffness estimates are susceptible to underestimation due to noise and overestimation due to discretization[10]. Both over- and underestimation is more pronounced in second-order FDOs than in first-order FDOs, making k-MDEV more robust against noise than MDEV inversion[4,5]. However, k-MDEV has never been used for the human brain since heterogeneities and abundant solid-fluid interfaces degraded the results.
The aim of this study is to set-up k-MDEV filters for the human brain and to develop a 3D k-MDEV inversion.
Methods
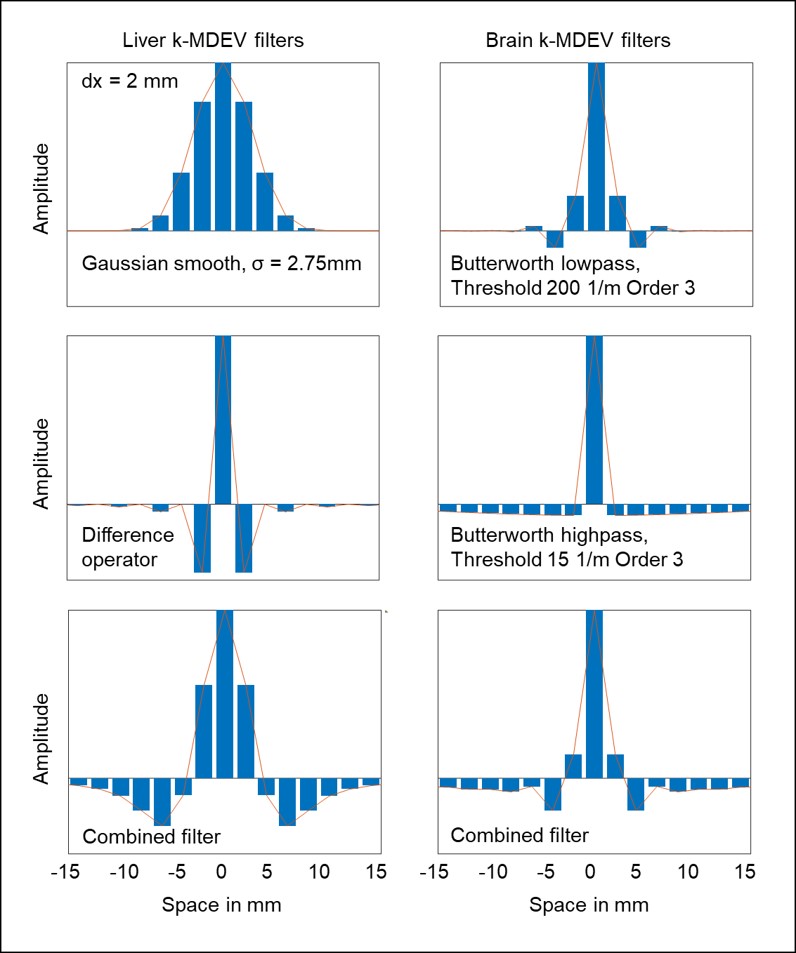
The brains of seven healthy volunteers (mean: 28 (range:22-51) years) were investigated by multifrequency MRE using a single-shot, spin-echo echo-planar imaging sequence at a 1.5-Tesla scanner (Siemens-Aera). For retest, the volunteers walked around and were re-positioned to simulate variations in the positioning. Eight phase offsets over one vibration period were recorded in 30 axial slices with 192x156 mm2 field-of-view and 2x2x2 mm3 voxel size, echo time = 88 ms, repetition time = 4540 ms. Harmonic vibrations at 25,30,35,40Hz were induced using pressurized air drivers[11]. One volunteer was measured at a 3.0-Tesla scanner (Siemens-Lumina) with 1.6x1.6x2 mm3 voxel size and echo time = 67 ms.Pre-processing of MRE data in the k-MDEV pipeline (available at https://bioqic‐apps.charite.de)[12] was improved for the brain. Therefore, prior to unwrapping the phase images, the Gaussian smoothing kernel was replaced with a Butterworth lowpass filter of order 3 and threshold 250m-1. The radial filter in the spatial frequency domain (linear cone) was replaced by a radial bandpass Butterworth filter of third order with highpass threshold of 15 m-1 and lowpass threshold of 200 m-1. All frequency components were weighted equally in the inversion.
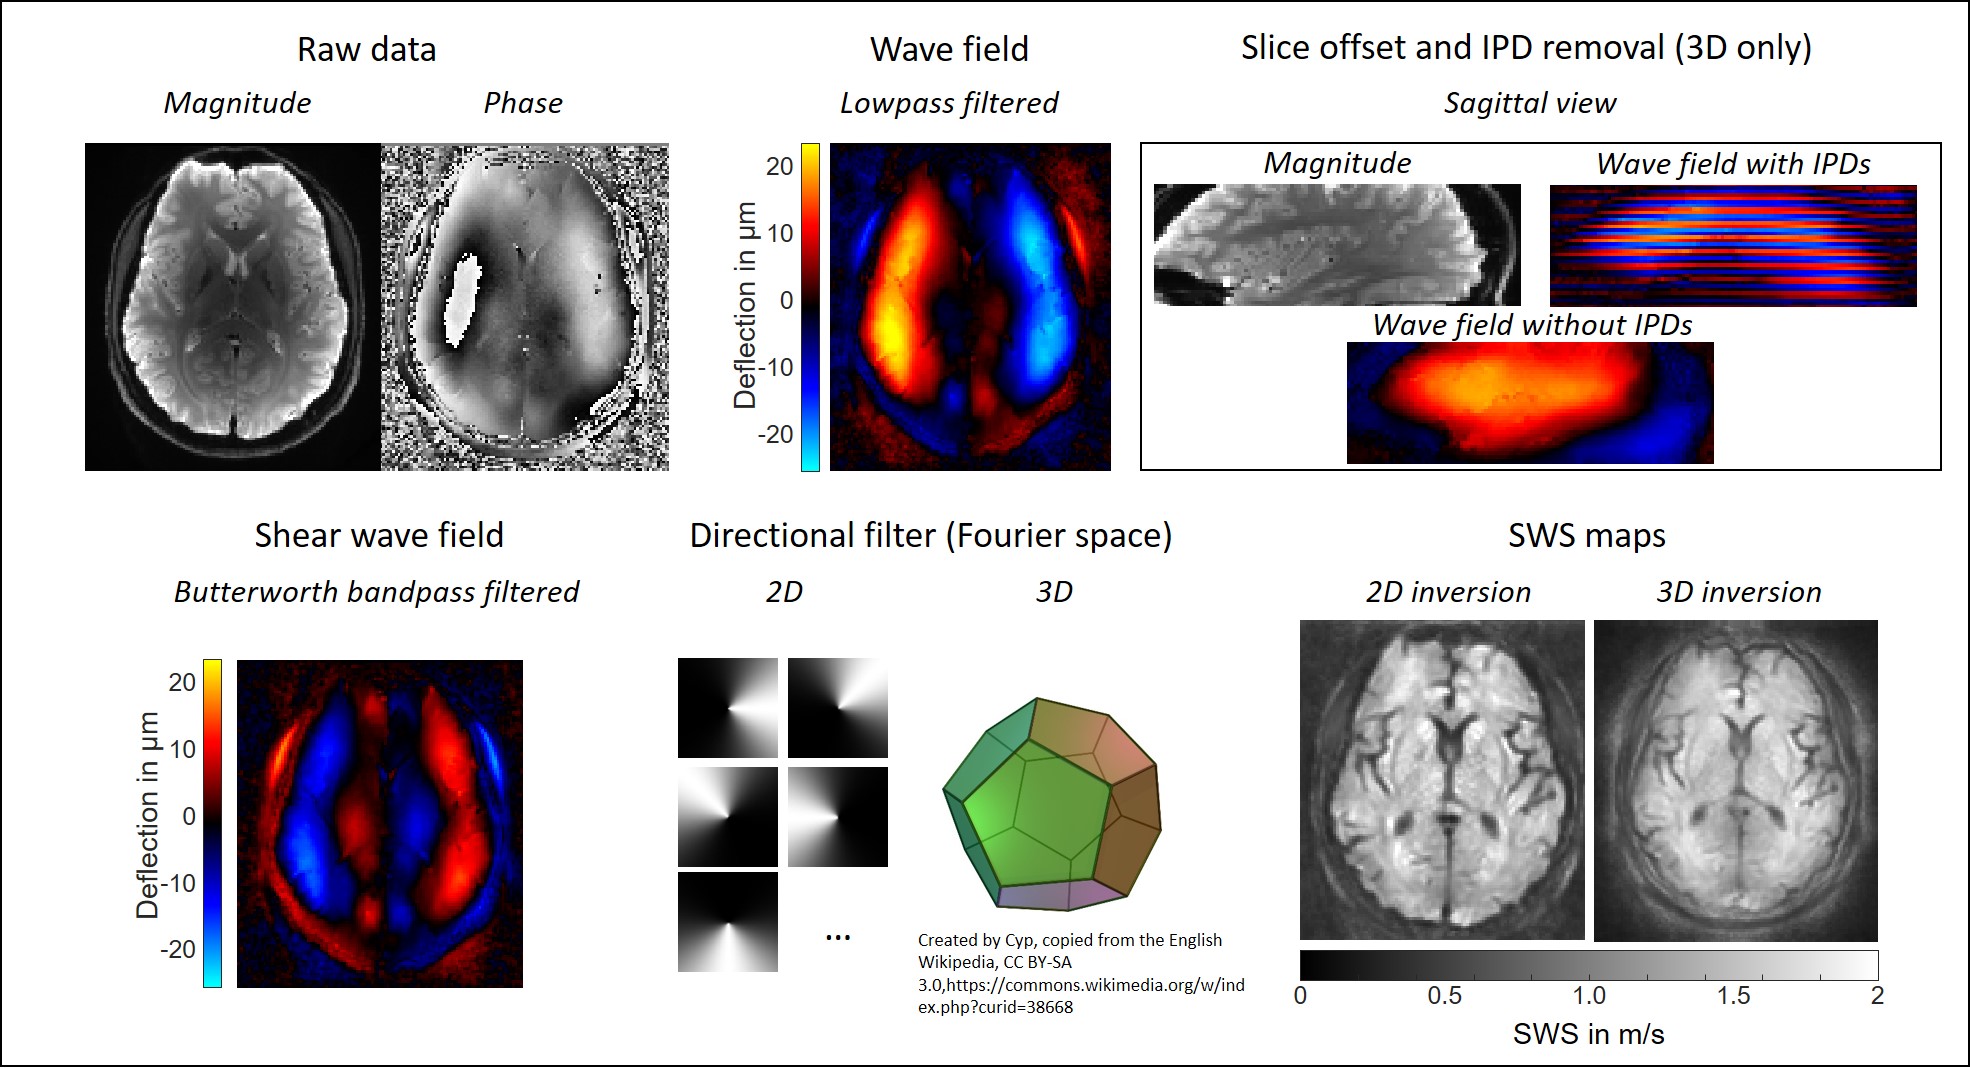
For 3D processing, slice phase offsets and interphase discontinuities(IPD) between the slices were removed after the temporal Fourier transform according to Barnhill et al.[13]. The slice wise 2D directional filter with eight equally distributed segments was extended to 3D by a dodecahedron with 20 corners, splitting the wave field into 20 propagation directions. The 3D phase gradient was calculated for reconstructing SWS maps.
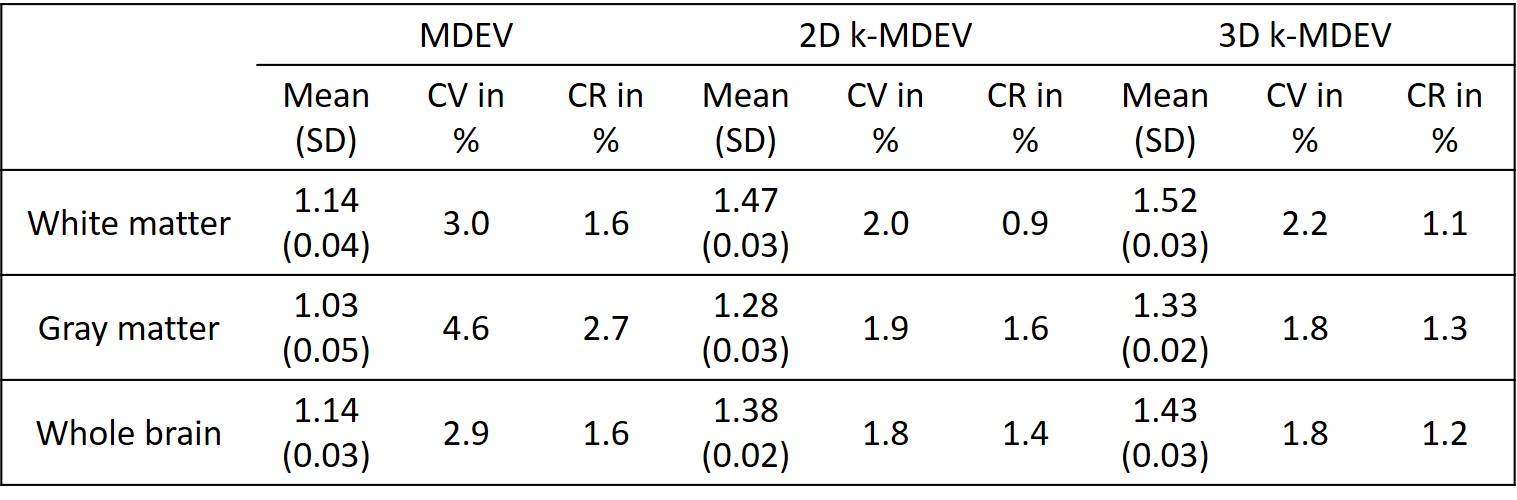
2D and 3D brain k-MDEV values (shear wave speed, SWS) were compared with standard MDEV inversion which provides shear modulus values |G*| and phase angle φ. Averages of white matter, gray matter and the full brain were analyzed for repeatability using the coefficient of variation (CV)[14] and coefficient of repeatability (CR)[15]. Segmentation was done using spm12-segment[16].
Results
Figure 1 shows the filters in image space for the proposed 2D brain k-MDEV in comparison to the originally proposed settings. The kernel for smoothing is much smaller, which reduces blurring.Figure 2 shows the post-processing steps for the 2D and 3D brain-adapted k-MDEV with reconstructed SWS maps. The raw data is smoothed and unwrapped using Laplacian unwrapping and the wave field is extracted using the temporal Fourier transform. The slice offsets are clearly visible in the sagittal view of the wave field and IPD removal is necessary for the 3D approach. Compression waves are suppressed using a Butterworth highpass filter to remain the shear wave field, which is further decomposed into 8 (2D) or 20 (3D, dodecahedron) directions by applying a directional filter in the spatial Fourier domain. Results from k-MDEV inversion for 2D and 3D phase gradient are shown at the bottom left.
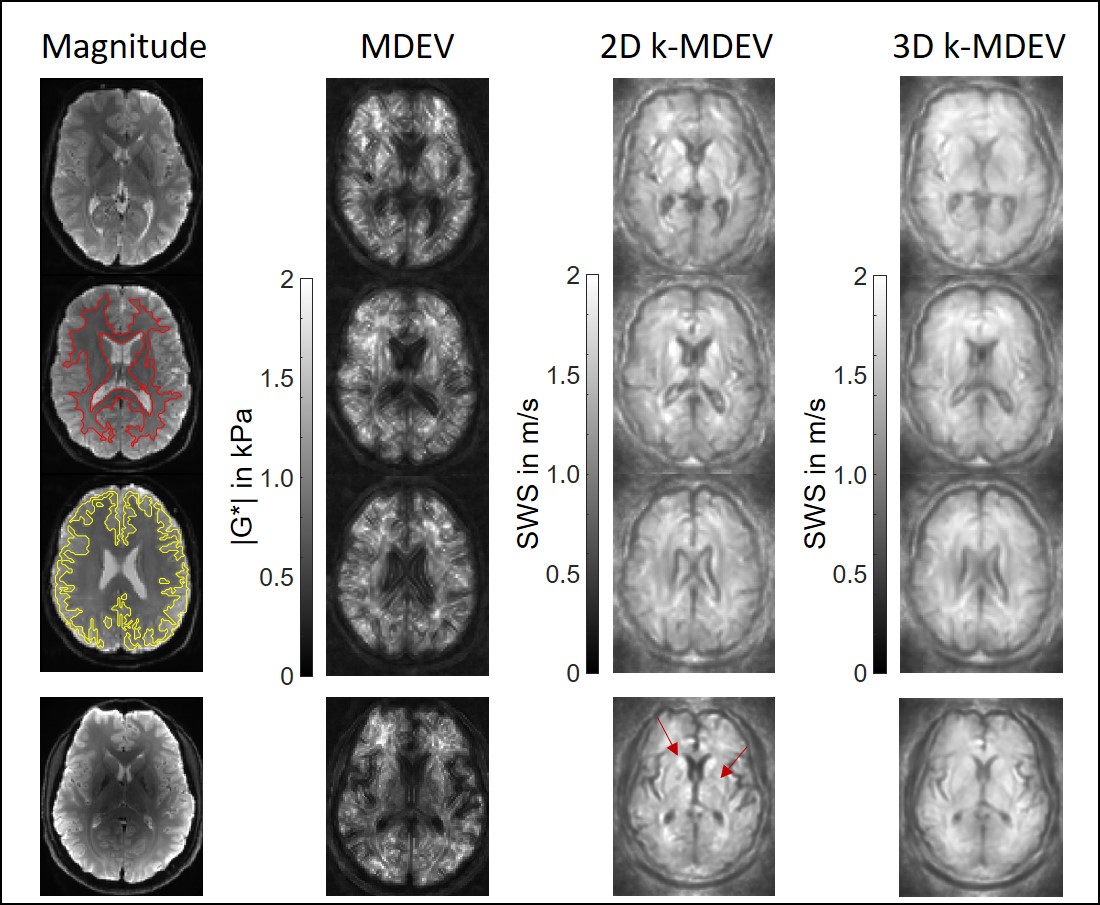
In Figure 3 representative results for MDEV, 2D k-MDEV and 3D k-MDEV are shown together with magnitude images. Gray and white matter segmentations are demarcated by yellow and red lines, respectively. The last row shows results from the 3.0-Tesla measurement. Contrast and sharpness of edges are increased compared to 1.5-Tesla.
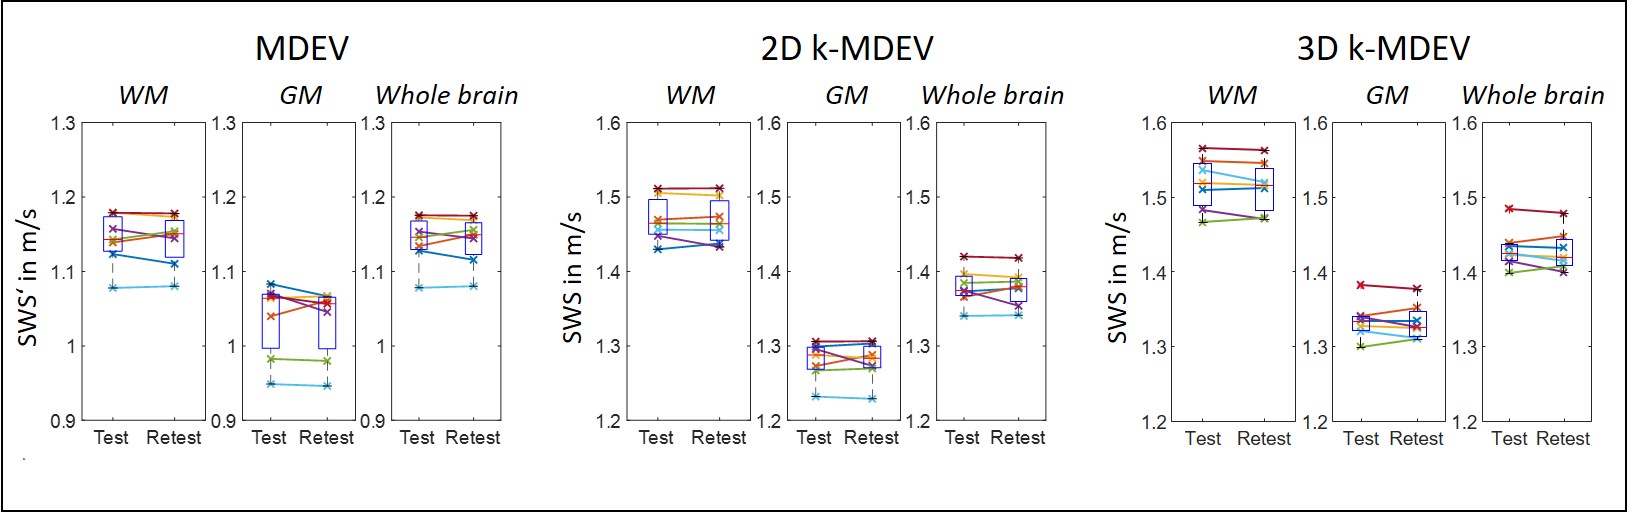
Test-retest evaluation for the three pipelines are presented in Figure 4. Overall, inter-subject and test-retest variability was reduced using the k-MDEV pipeline in comparison to MDEV. A summary is given in Table 1. Mean values were higher for both k-MDEV pipelines but still consistent with literature findings[17].
Discussion
This work proposes multifrequency wavenumber-based reconstruction of SWS maps in the human brain in 2D and 3D. Brain MRE data has higher SNR with better resolution compared to liver data, which allowed us to shrink the width of smoothing kernels und to reduce blurring in the SWS maps. As a result, SWS maps appeared visually closer to the anatomical reference. Moreover, the excellent noise stability of k-MDEV inversion yielded a better test-retest reproducibility than MDEV inversion. The extension to 3D was a straightforward step, which permitted inclusion of the full wave field for determining the spatial phase gradient.Conclusion
Since k-MDEV inversion presents a promising strategy for parameter recovery in MRE of the liver and mouse brain, we adapted and extended this method to the human brain in 2D and 3D.Acknowledgements
Funding from the German Research Foundation (GRK 2260 BIOQIC, SFB1340 Matrix in Vision) and from the European Union’s Horizon 2020 Program (ID 668039, EU FORCE – Imaging the Force of Cancer) is gratefully acknowledged.References
1 Venkatesh, S. K. & Ehman, R. L. Magnetic resonance elastography of abdomen. Abdom Imaging 40, 745-759 (2015).
2 Jamin, Y., Boult, J. K. R., Li, J., Popov, S., Garteiser, P., Ulloa, J. L., Cummings, C., Box, G., Eccles, S. A., Jones, C., Waterton, J. C., Bamber, J. C., Sinkus, R. & Robinson, S. P. Exploring the biomechanical properties of brain malignancies and their pathologic determinants in vivo with magnetic resonance elastography. Cancer Res 75, 1216-1224, doi:10.1158/0008-5472.CAN-14-1997 (2015).
3 Murphy, M. C., Huston, J., 3rd & Ehman, R. L. MR elastography of the brain and its application in neurological diseases. Neuroimage 187, 176-183, doi:10.1016/j.neuroimage.2017.10.008 (2019).
4 Tzschatzsch, H., Guo, J., Dittmann, F., Hirsch, S., Barnhill, E., Johrens, K., Braun, J. & Sack, I. Tomoelastography by multifrequency wave number recovery from time-harmonic propagating shear waves. Med Image Anal 30, 1-10, doi:10.1016/j.media.2016.01.001 (2016).
5 Bertalan, G., Guo, J., Tzschatzsch, H., Klein, C., Barnhill, E., Sack, I. & Braun, J. Fast tomoelastography of the mouse brain by multifrequency single-shot MR elastography. Magn Reson Med 81, 2676-2687, doi:10.1002/mrm.27586 (2019).
6 Papazoglou, S., Hirsch, S., Braun, J. & Sack, I. Multifrequency inversion in magnetic resonance elastography. Phys Med Biol 57, 2329-2346, doi:10.1088/0031-9155/57/8/2329 (2012).
7 Dittmann, F., Hirsch, S., Tzschatzsch, H., Guo, J., Braun, J. & Sack, I. In vivo wideband multifrequency MR elastography of the human brain and liver. Magn Reson Med 76, 1116-1126, doi:10.1002/mrm.26006 (2016).
8 Streitberger, K. J., Lilaj, L., Schrank, F., Braun, J., Hoffmann, K. T., Reiss-Zimmermann, M., Kas, J. A. & Sack, I. How tissue fluidity influences brain tumor progression. Proc Natl Acad Sci U S A 117, 128-134, doi:10.1073/pnas.1913511116 (2020).
9 Guo, J., Bertalan, G., Meierhofer, D., Klein, C., Schreyer, S., Steiner, B., Wang, S. Q., da Silva, R. V., Infante-Duarte, C., Koch, S., Boehm-Sturm, P., Braun, J. & Sack, I. Brain maturation is associated with increasing tissue stiffness and decreasing tissue fluidity. Acta Biomaterialia 99, 433-442, doi:10.1016/j.actbio.2019.08.036 (2019).
10 Mura, J., Schrank, F. & Sack, I. An analytical solution to the dispersion-by-inversion problem in magnetic resonance elastography. Magn Reson Med 84, 61-71, doi:10.1002/mrm.28247 (2020).
11 Schrank, F., Warmuth, C., Tzsch?tzsch, H., Kreft, B., Hirsch, S., Braun, J., Elgeti, T. & Sack, I. Cardiac-gated steady-state multifrequency magnetic resonance elastography of the brain: Effect of cerebral arterial pulsation on brain viscoelasticity. Journal of Cerebral Blood Flow and Metabolism 40, 991-1001, doi:10.1177/0271678x19850936 (2020).
12 Meyer, T., Tzschätzsch, H., Braun, J., Kalra, P., Kolipaka, A. & Sack, I. in Proc 23st Annual Meeting ISMRM. (ed In: Proceedings of the 27st Annual Meeting of ISMRM) 3966.
13 Barnhill, E., Nikolova, M., Ariyurek, C., Dittmann, F., Braun, J. & Sack, I. Fast Robust Dejitter and Interslice Discontinuity Removal in MRI Phase Acquisitions: Application to Magnetic Resonance Elastography. IEEE Trans Med Imaging 38, 1578-1587, doi:10.1109/TMI.2019.2893369 (2019).
14 Everitt, B. Encyclopedia of statistics in behavioral science. Vol. 2 (Wiley-Blackwell, 2005).
15 Bland, J. M. & Altman, D. G. Applying the right statistics: analyses of measurement studies. Ultrasound Obstet Gynecol 22, 85-93, doi:10.1002/uog.122 (2003).
16 Penny, W. D., Friston, K. J., Ashburner, J. T., Kiebel, S. J. & Nichols, T. E. Statistical parametric mapping: the analysis of functional brain images. (Elsevier, 2011).
17 Hall, C. M., Moeendarbary, E. & Sheridan, G. K. Mechanobiology of the brain in ageing and Alzheimer's disease. Eur J Neurosci, doi:10.1111/ejn.14766 (2020).
Figures