1021
Optimization of GRE-MRE in the pancreas1Radiology and Nuclear Medicine, Amsterdam UMC location AMC, Amsterdam, Netherlands, 2Department of Imaging Sciences and Biomedical Engineering, King's College London, London, United Kingdom, 3Inserm U1148, LVTS, University Paris Diderot, Paris, France, 4Radiology and Nuclear medicine, Amsterdam UMC location AMC, Amsterdam, Netherlands
Synopsis
Pancreatic Magnetic Resonance Elastography (MRE) allows non-invasive estimation of pancreatic tissue visco-elastic properties for multiple pathophysiological diseases. The aim of this study is to optimize pancreatic GRE-MRE to provide an in-depth analysis of the propagation and registration of shear waves. Optimization was performed using four combinations of frequency, the number of measured wave-phase offsets, and TE. Pancreas GRE-MRE at 40Hz, TE 6.9ms and 4 or 5 wave-phase offsets can estimate the SWS of the pancreas head with optimal encoding and propagation and has an acceptable breath-hold duration for clinical purposes.
Introduction
Magnetic Resonance Elastography (MRE) allows non-invasive estimation of tissue visco-elastic properties, such as stiffness and viscosity, which differ for healthy and diseased tissues. Pancreatic MRE has the potential to elucidate multiple pathophysiological processes, such as inflammation, endocrine dysfunction and cancer. However, assessing the pancreas with MRE remains challenging due to its small size, elongated shape and central abdominal location. Consequently, pancreatic MRE requires careful sequence parameter optimization.The aim of this study is to optimize the rapid interleaved multi-slice (Ristretto) GRE acquisition for pancreatic MRE1,2 to provide an in-depth analysis of the propagation of shear waves into and through the pancreas.
Methods
10 healthy volunteers (age 27+/-2.7 years) were scanned at 3.0T (Ingenia, Philips, Netherlands). Volunteers fasted 4 hours prior to scanning.3 The gravitational transducer was attached to a 3D printed curved polylactic acid plate for a better fit to an average adult torso including a gel-pad between plate and body surface to enhance patient comfort.2 The transducer was strapped to the right flank of the volunteer at the level of the pancreas. Ristretto GRE-MRE acquisitions were performed with 3x3x3mm3 voxelsize (FOV:384x256x27mm), SENSE2 and four consecutive breath-holds.3 Optimization of the wave propagation and registration and motion-encoding was performed using four combinations of frequency, the number of measured wave-phase offsets, and TE (Table 1). Hadamard encoding was used for interleaved optimal encoding.4Lower vibration frequencies have a deeper penetration depth that could improve penetration in the pancreas. A higher number of wave-phase offsets should improve accuracy. Longer TE allows for longer motion-encoding gradients, which increases phase shifts due to shear wave displacement in tissue. This could improve accuracy of shear wave fitting for small displacements. Post-processing was performed using dedicated software. Phase data are unwrapped and smoothed before 3D Fourier transformation using a 3D Blackman-Harris window. The shear wave displacement was calculated per voxel and a finite element method was used to extract visco-elastic parameters. Shear wave speed (SWS) was calculated for all scans for each volunteer by averaging over a manually drawn ROI over the pancreatic head.
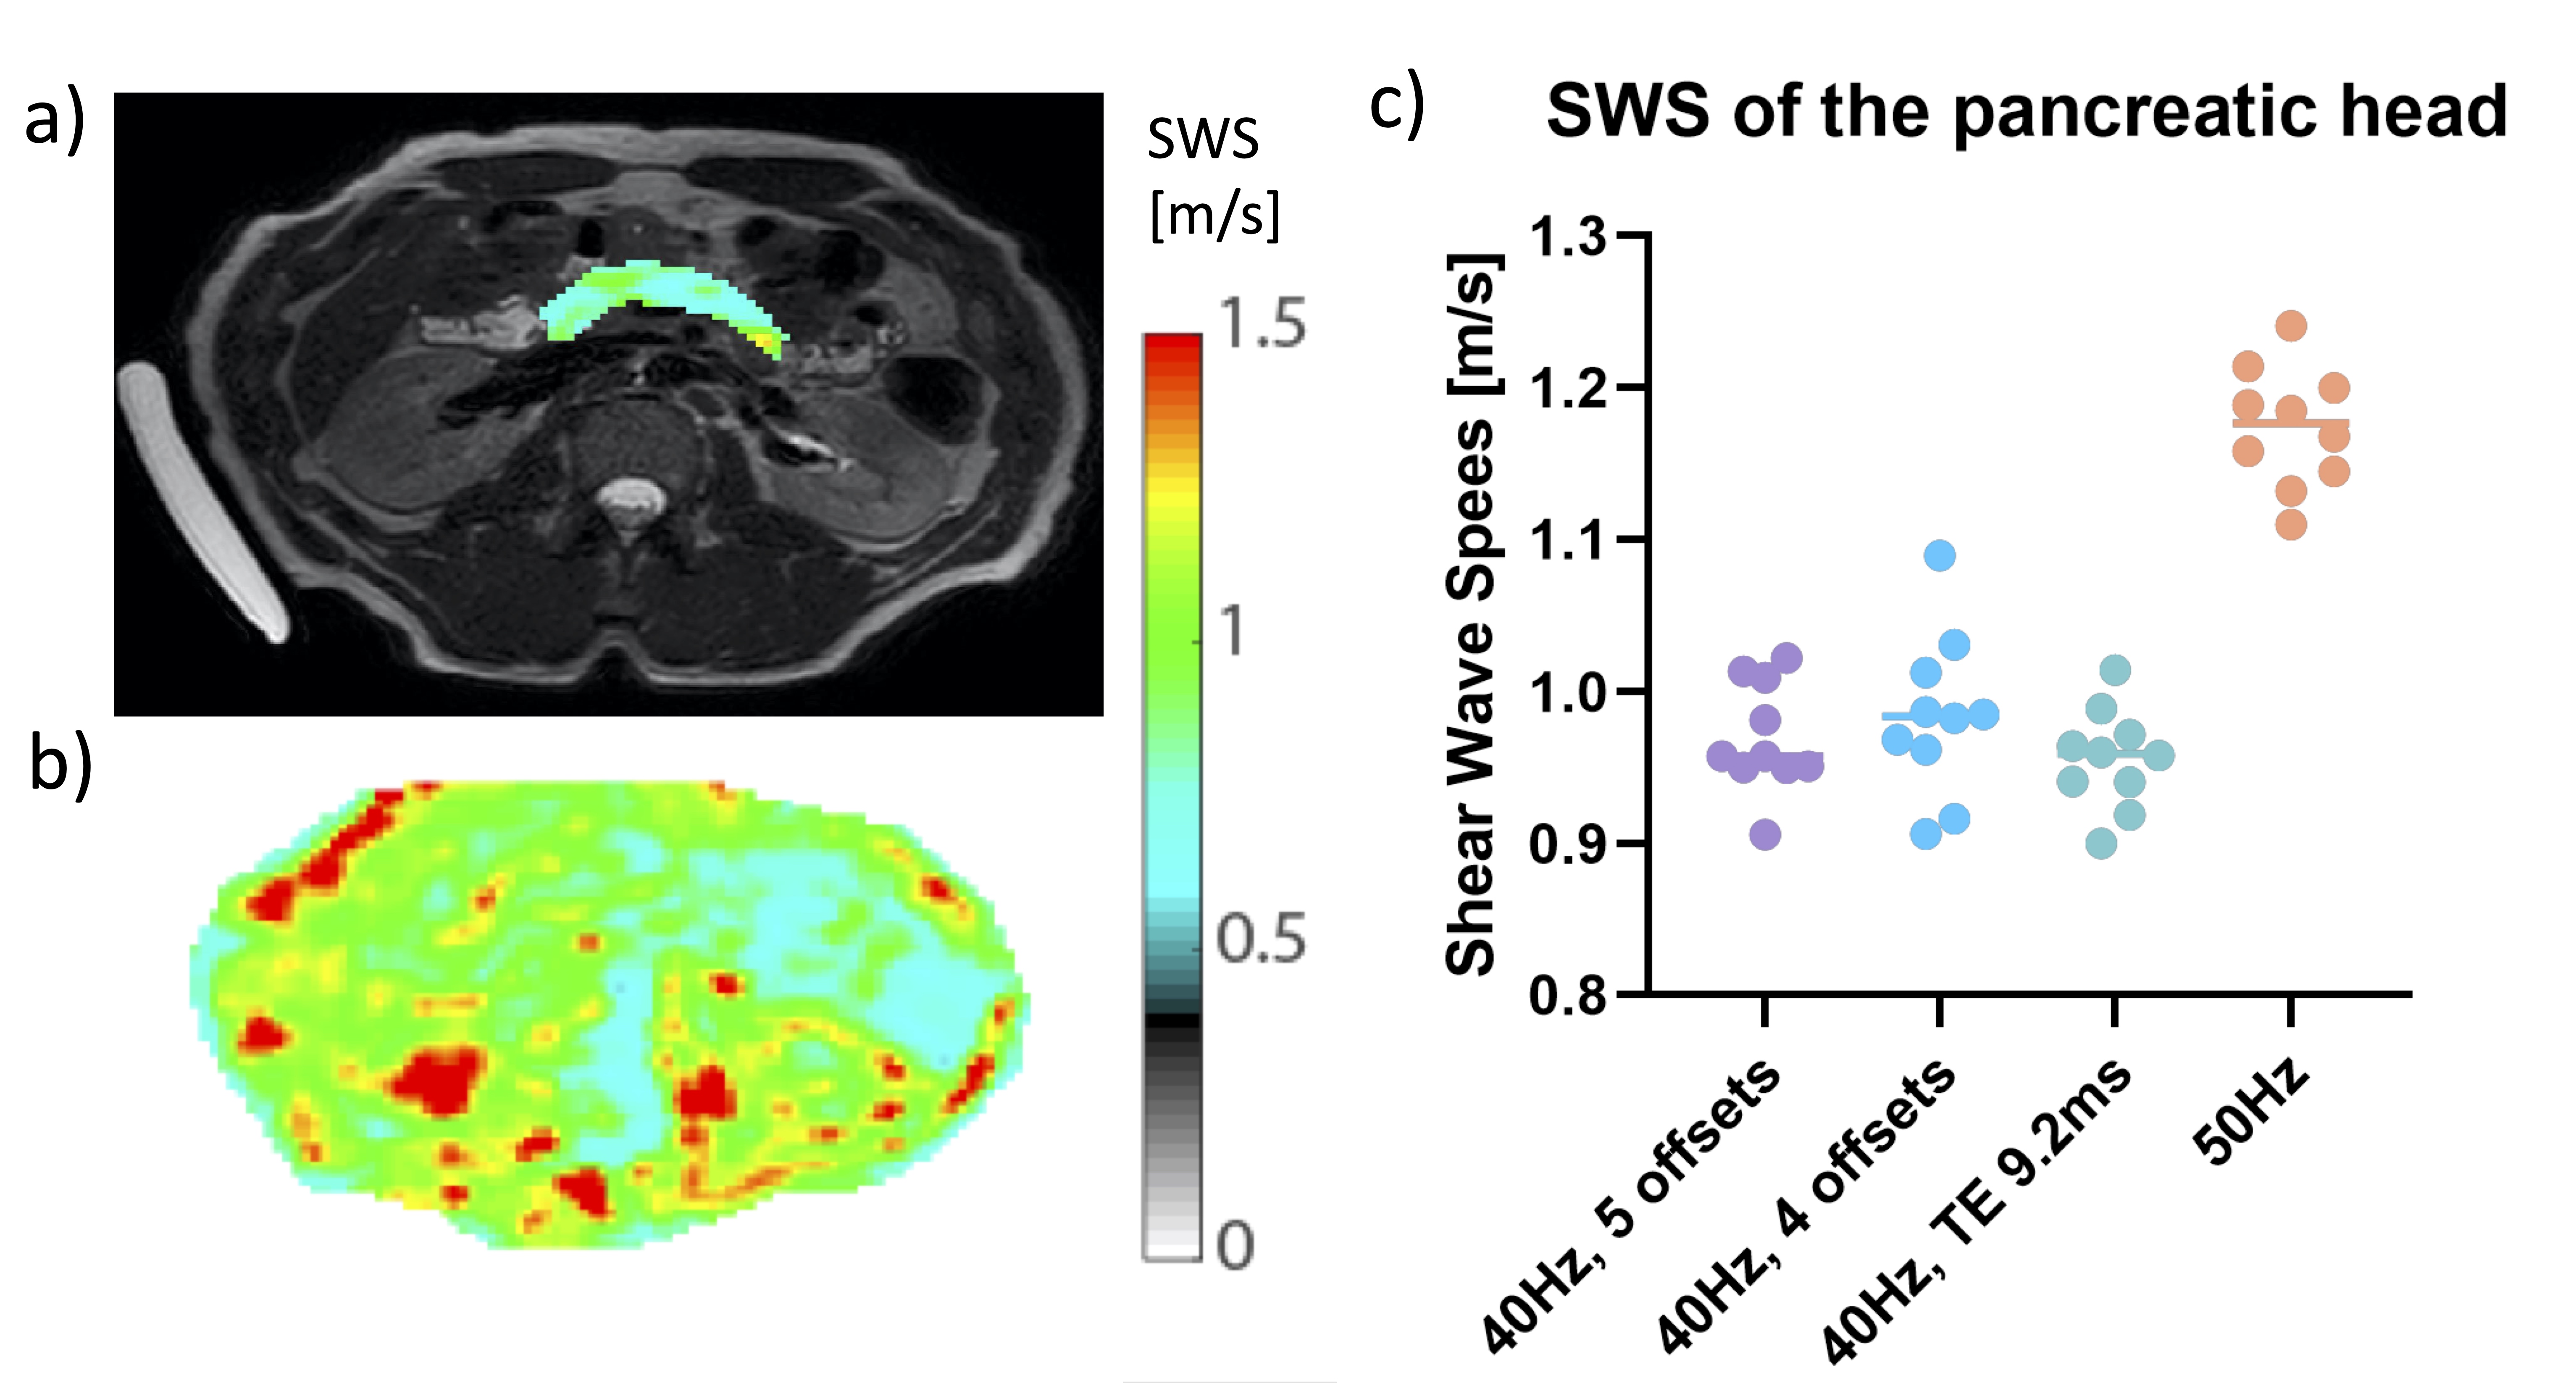
Analysis of the data was performed by estimating the shear wave amplitude, the deviation of the vibration from a perfect sinus denoted “nonlinearity”, and examining the reconstructed shear wave period. The wave amplitude was taken over a line-profile ranging from the centre of the transducer to the centre of the pancreas head (Figure 1a-b). The average amplitude in the pancreas head was calculated for each scan protocol. Nonlinearity is the ratio of the wave amplitude of the higher harmonics divided by the amplitude of the fundamental harmonic. The nonlinearity gives an indication of the quality of the measured shear wave and should be below 50%. Repeated measures ANOVA and pairwise comparison were used to determine intra-subject variability for all quality parameters.
Results
The average shear wave amplitude in the pancreas head (Figure 1b-c) was significantly higher at 40Hz than at 50Hz (40Hz = 90+/-28µm; 50Hz = 65+/-20µm; F(3,27)=11, p=0.00, Fig. 1c). A difference in amplitude was found between 40Hz, 5 offsets and 50Hz (p<0.01) and 40Hz, 5 offsets and TE9.2 (p=0.02). The average nonlinearity for all scans was below 40%.There was no significant difference for the average nonlinearity in the pancreas head across all scans (F(3,27)=1.82, p=0.17, Figure 2). All values were below the threshold of 50%.
A single wave period has been plotted for a voxel in the back-muscle and the pancreas head (Figure 4).
The average SWS in the pancreas head for 40Hz scans was 0.97+/-0.5m/s (Figure 3). There was no significant difference between 40Hz vibration scans (F(2,18)=1.64, p=0.22). The average pancreatic SWS was 1.17+/-0.04 for 50Hz.
Discussion
The average pancreatic SWS was in line with values found in literature.5,6 The higher SWS for higher vibration frequencies has also been reported previously.7,8 Wave penetration is the most important factor in the pancreas and was crucial for successful pancreatic MRE. With lower wave amplitudes the shear wave displacement can be submerged in the noise and become indistinguishable.9 We found significantly improved wave penetration using mechanical wave generation at 40Hz compared to 50Hz, deeming it to be the preferred choice. The nonlinearity for all scans is below 50%, indicating that the fundamental frequency is substantial in the pancreas head and the amplitude of the frequency is larger than the second harmonic. Longer TE allows for longer motion-encoding gradients. However, it will increase breath-hold duration severely. A higher number of offsets (in this case, 5 versus 4) should improve accuracy, however this was not evident in our limited study. Future studies could look at increasing the offset number further (e.g. 8), but would come with breath-hold duration and scan time compromises.Conclusion
A frequency of 40Hz allows for deeper wave penetration. A minimum of 4 offsets need to be measured for shear wave reconstruction, however allowing more than 5 offsets could give a more accurate measurement. Increasing the TE can allow for smaller displacements to be measured, however this will lengthen the breath-hold duration. Pancreas GRE-MRE at 40Hz, TE6.9ms and 4 or 5 wave-phase offsets can estimate the SWS of the pancreas head and has an acceptable breath-hold duration for clinical purposes.Acknowledgements
No acknowledgement found.References
[1] Guenthner, C., Sethi, S., Troelstra, M., Dokumaci, A. S., Sinkus, R., & Kozerke, S. (2019). Ristretto MRE: A generalized multi-shot GRE-MRE sequence. NMR in Biomedicine, 32(5). https://doi.org/10.1002/nbm.4049
[2] Runge, J. H., Hoelzl, S. H., Sudakova, J., Dokumaci, A. S., Nelissen, J. L., Guenthner, C., … Sinkus, R. (2019). A novel magnetic resonance elastography transducer concept based on a rotational eccentric mass: Preliminary experiences with the gravitational transducer. Physics in Medicine and Biology, 64
[4] https://doi.org/10.1088/1361-6560/aaf9f8
[3] Venkatesh, S. K., & Ehman, R. L. (2015). Magnetic resonance elastography of abdomen. Abdominal Imaging, 40(4), 745–759. https://doi.org/10.1007/s00261-014-0315-6[4] G. C, R. JH, S. R, K. S., in Intl. Soc. Mag. Reson. Med. (Honolulu, 2017), vol. 25, pp. 1378.
[5] An, H., Shi, Y., Guo, Q., & Liu, Y. (2016). Test–retest reliability of 3D EPI MR elastography of the pancreas. Clinical Radiology, 71(10), 1068.e7-1068.e12. https://doi.org/10.1016/j.crad.2016.03.014
[6] Decker, G. A., Glaser, K. J., Miller, L. J., Pannala, R., Faigel, D. O., Nguyen, C. C., … Silva, A. C. (2012). Su1240 Magnetic Resonance Elastography (MRE) of the Pancreas, a Feasibility Study in Healthy Volunteers. Gastroenterology, 142(5), S-458. https://doi.org/10.1016/s0016-5085(12)61732-6
[7] Shi, Y., Glaser, K. J., Venkatesh, S. K., Ben-Abraham, E. I., & Ehman, R. L. (2015). Feasibility of using 3D MR elastography to determine pancreatic stiffness in healthy volunteers. Journal of Magnetic Resonance Imaging, 41(2), 369–375. https://doi.org/10.1002/jmri.24572
[8] Dittmann, F., Tzschätzsch, H., Hirsch, S., Barnhill, E., Braun, J., Sack, I., & Guo, J. (2017). Tomoelastography of the abdomen: Tissue mechanical properties of the liver, spleen, kidney, and pancreas from single MR elastography scans at different hydration states. Magnetic Resonance in Medicine, 78(3), 976–983. https://doi.org/10.1002/mrm.26484
[9] Papazoglou, S., Xu, C., Hamhaber, U., Siebert, E., Bohner, G., Klingebiel, R., … Sack, I. (2009). Scatter-based magnetic resonance elastography. Physics in Medicine and Biology, 54(7), 2229–2241. https://doi.org/10.1088/0031-9155/54/7/025
Figures