1020
In Silico Evaluation of Magnetic Resonance Elastography of the Kidney1Sir Peter Mansfield Imaging Centre, University of Nottingham, Nottingham, United Kingdom
Synopsis
The accuracy of clinical magnetic resonance elastography (MRE) is difficult to determine. Finite element modelling (FEM) simulation allows evaluation of the errors on acquired MRE measures, and also informs methodological optimisation. In this study kidney MRE is simulated using an anthropomorphic personalised model of the kidneys, and simulated data is compared with a 2D GRE MRE acquisition of the same volunteer on whom the model was based. The optimum MRE imaging resolution was identified, and through adding simulated noise to the FEM data, errors were estimated for the acquired MRE data, and recommendations made for kidney MRE optimisation.
INTRODUCTION
Magnetic Resonance Elastography (MRE) measures the biomechanical properties of biological tissue to detect changes caused by disease. Mechanical vibrations are delivered to the tissue and measured via MRI phase contrast, with an inversion algorithm used to produce an elasticity map or "elastogram". Initial studies assessing renal MRE in Chronic Kidney Disease (CKD) and transplanted kidneys1,2 have demonstrated that MRE holds potential for understanding pathophysiology in these conditions. However, it is difficult to validate human MRE studies; one solution is to perform computational modelling. A personalised anthropomorphic finite element model (FEM) of the body can be built and MRE simulated with known ground-truth properties3. In silico elastograms can be compared with ground-truth for varying factors such as imaging resolution and motion-noise levels, and compared with acquired MRE data. Error estimates can be obtained for the acquired data, and simulations can inform optimisation of MRE acquisitions. This work presents findings of a FEM of the human kidneys compared to acquired 2D GRE MRE data.METHODS
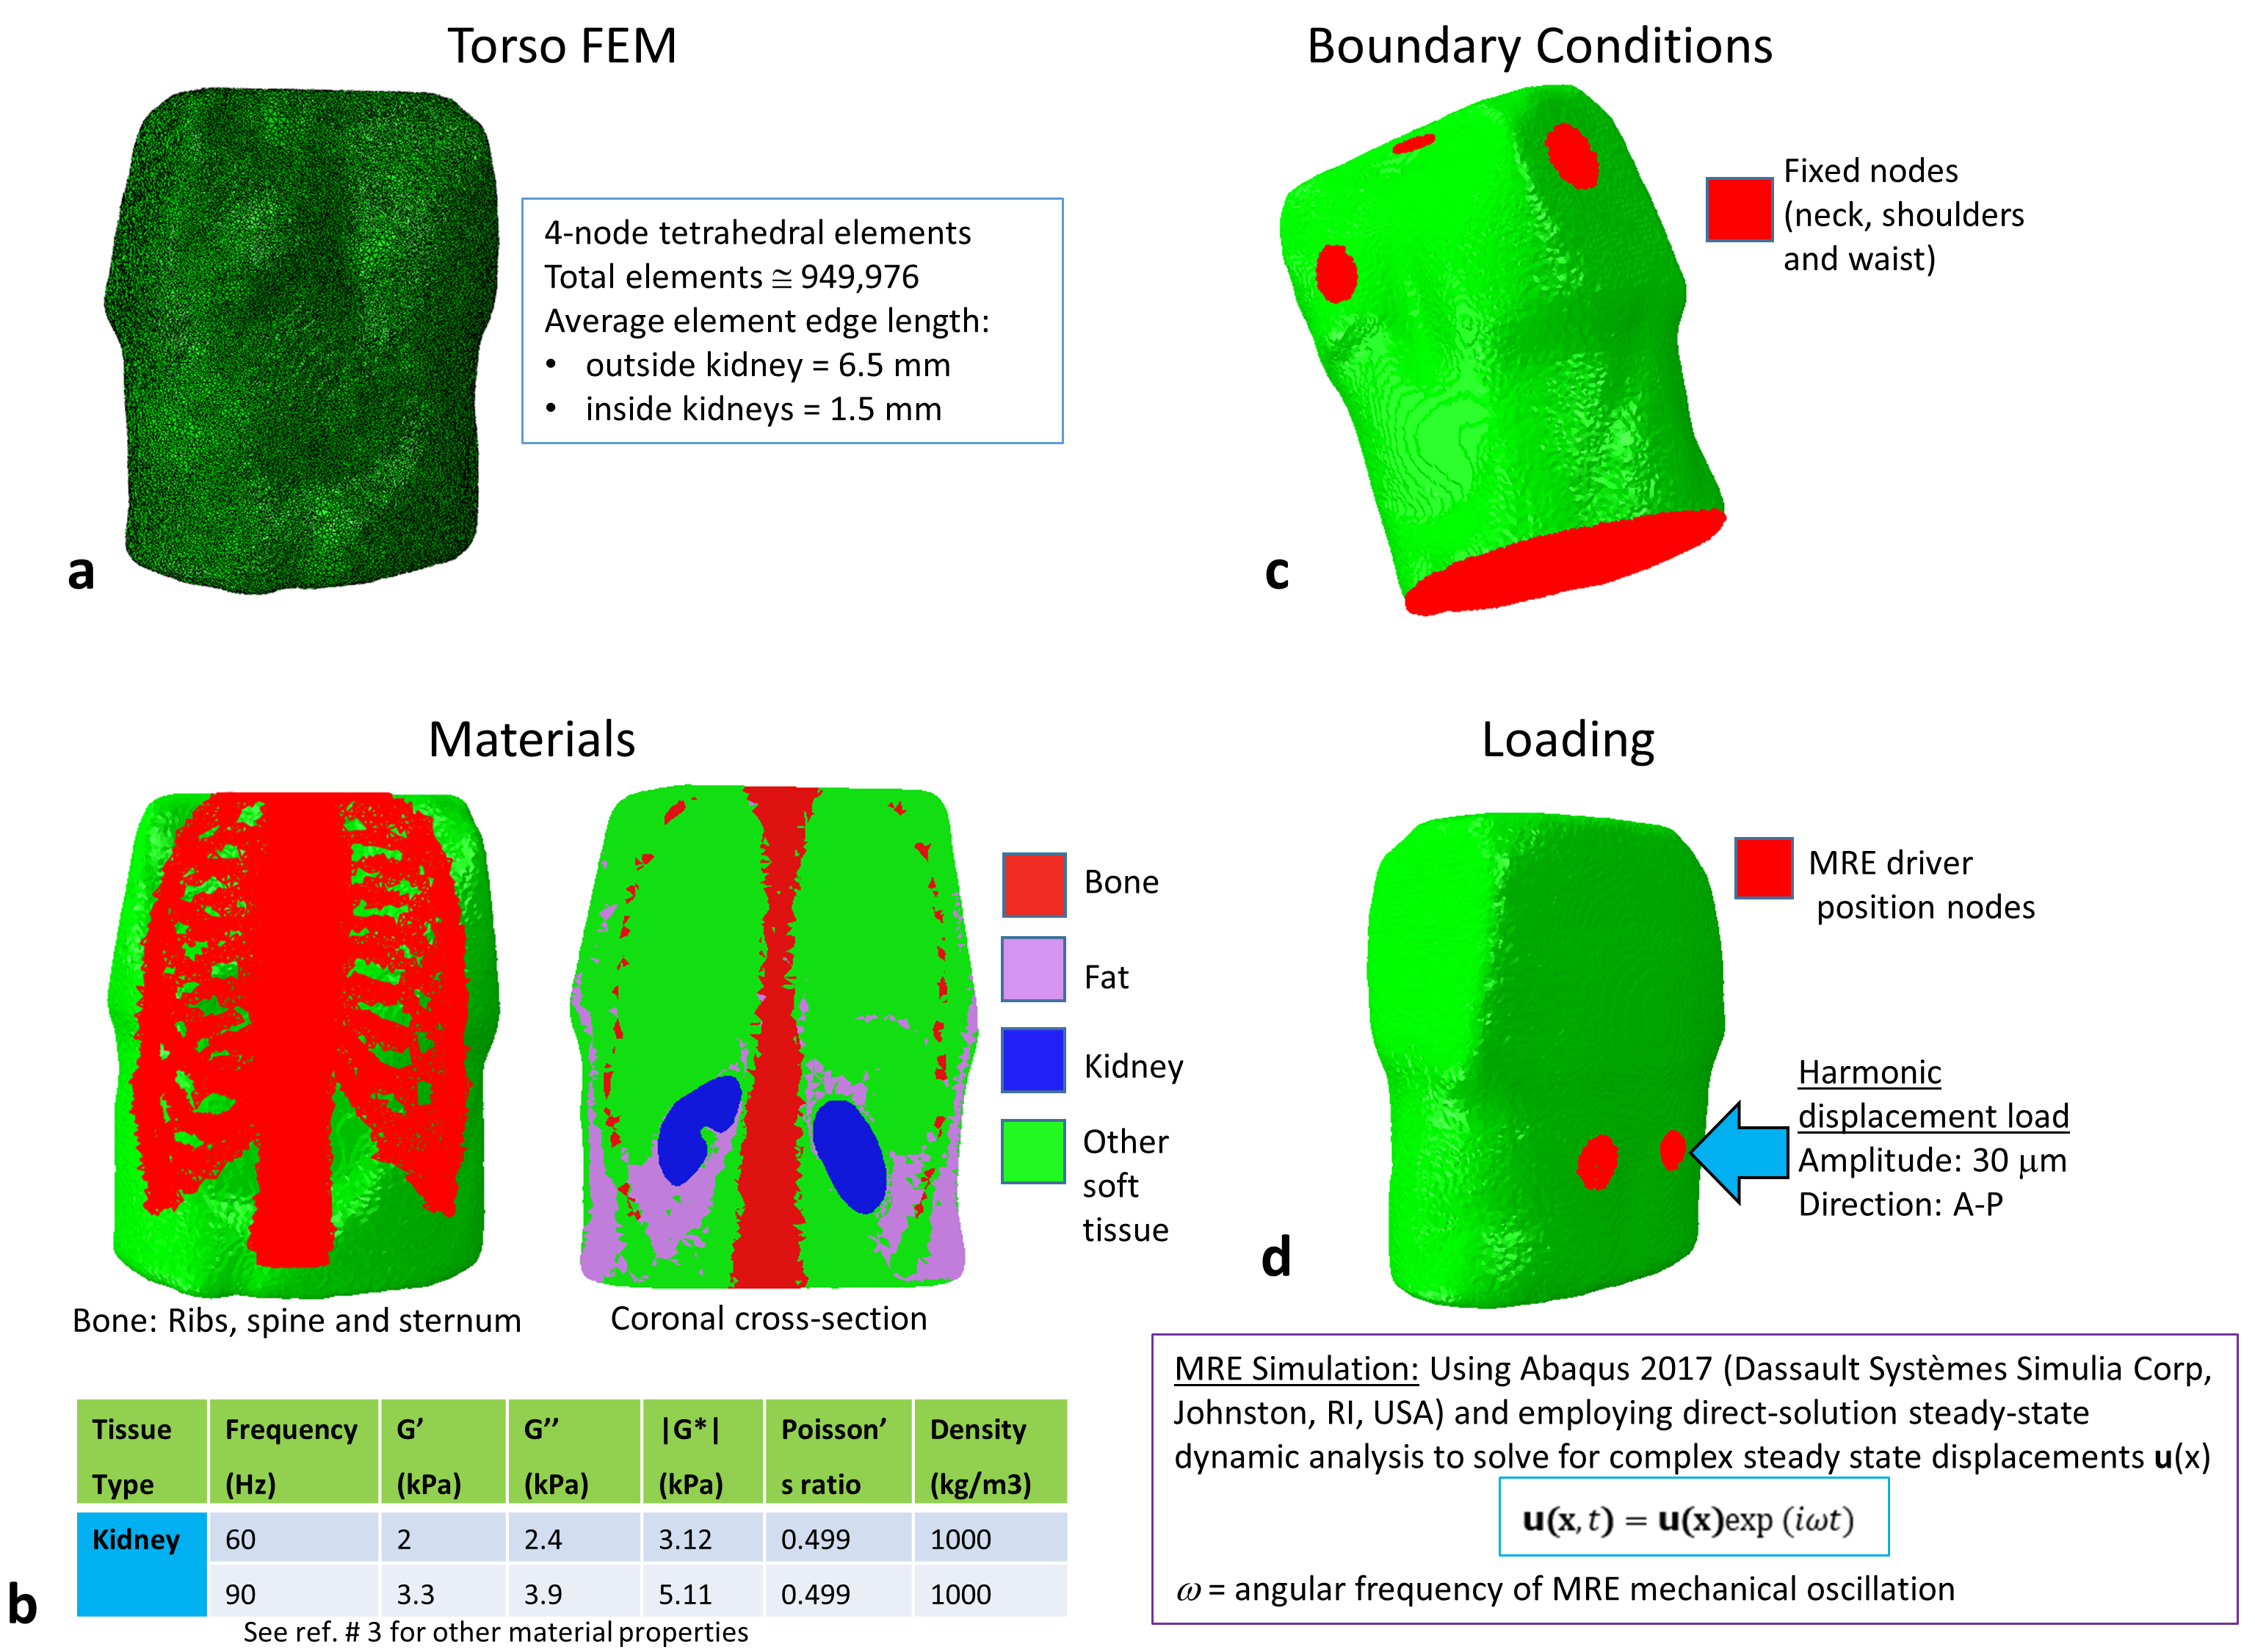
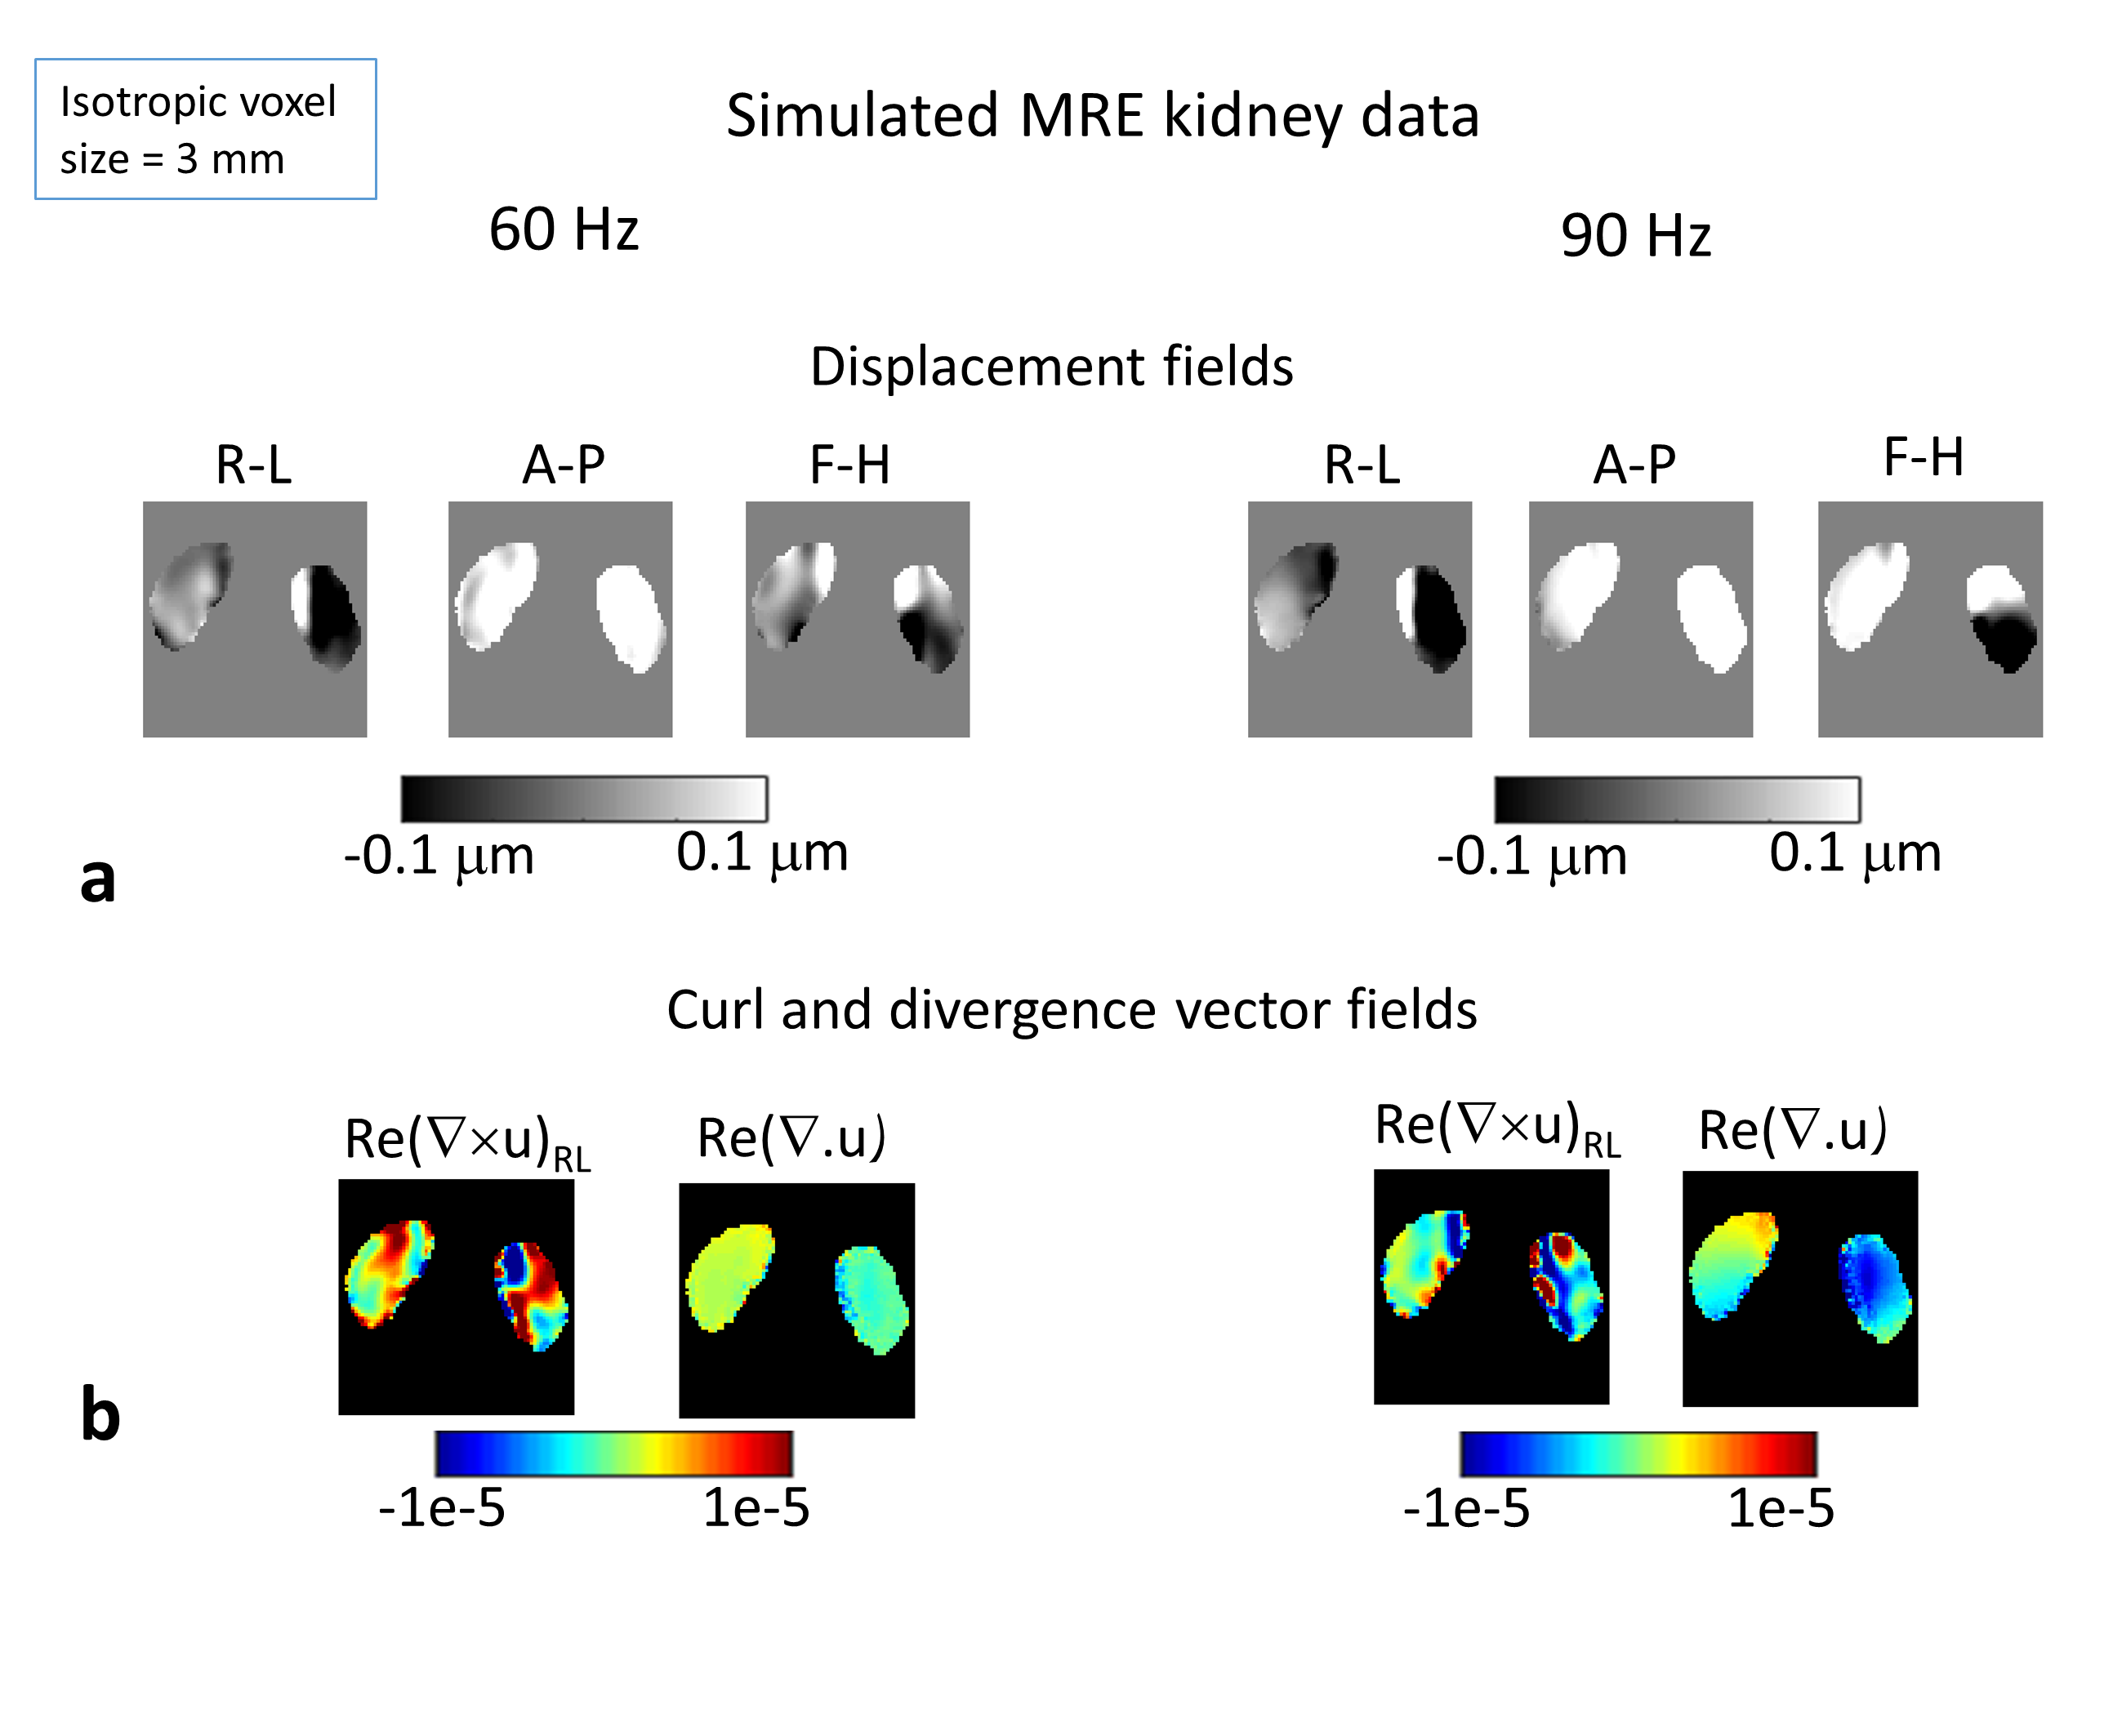
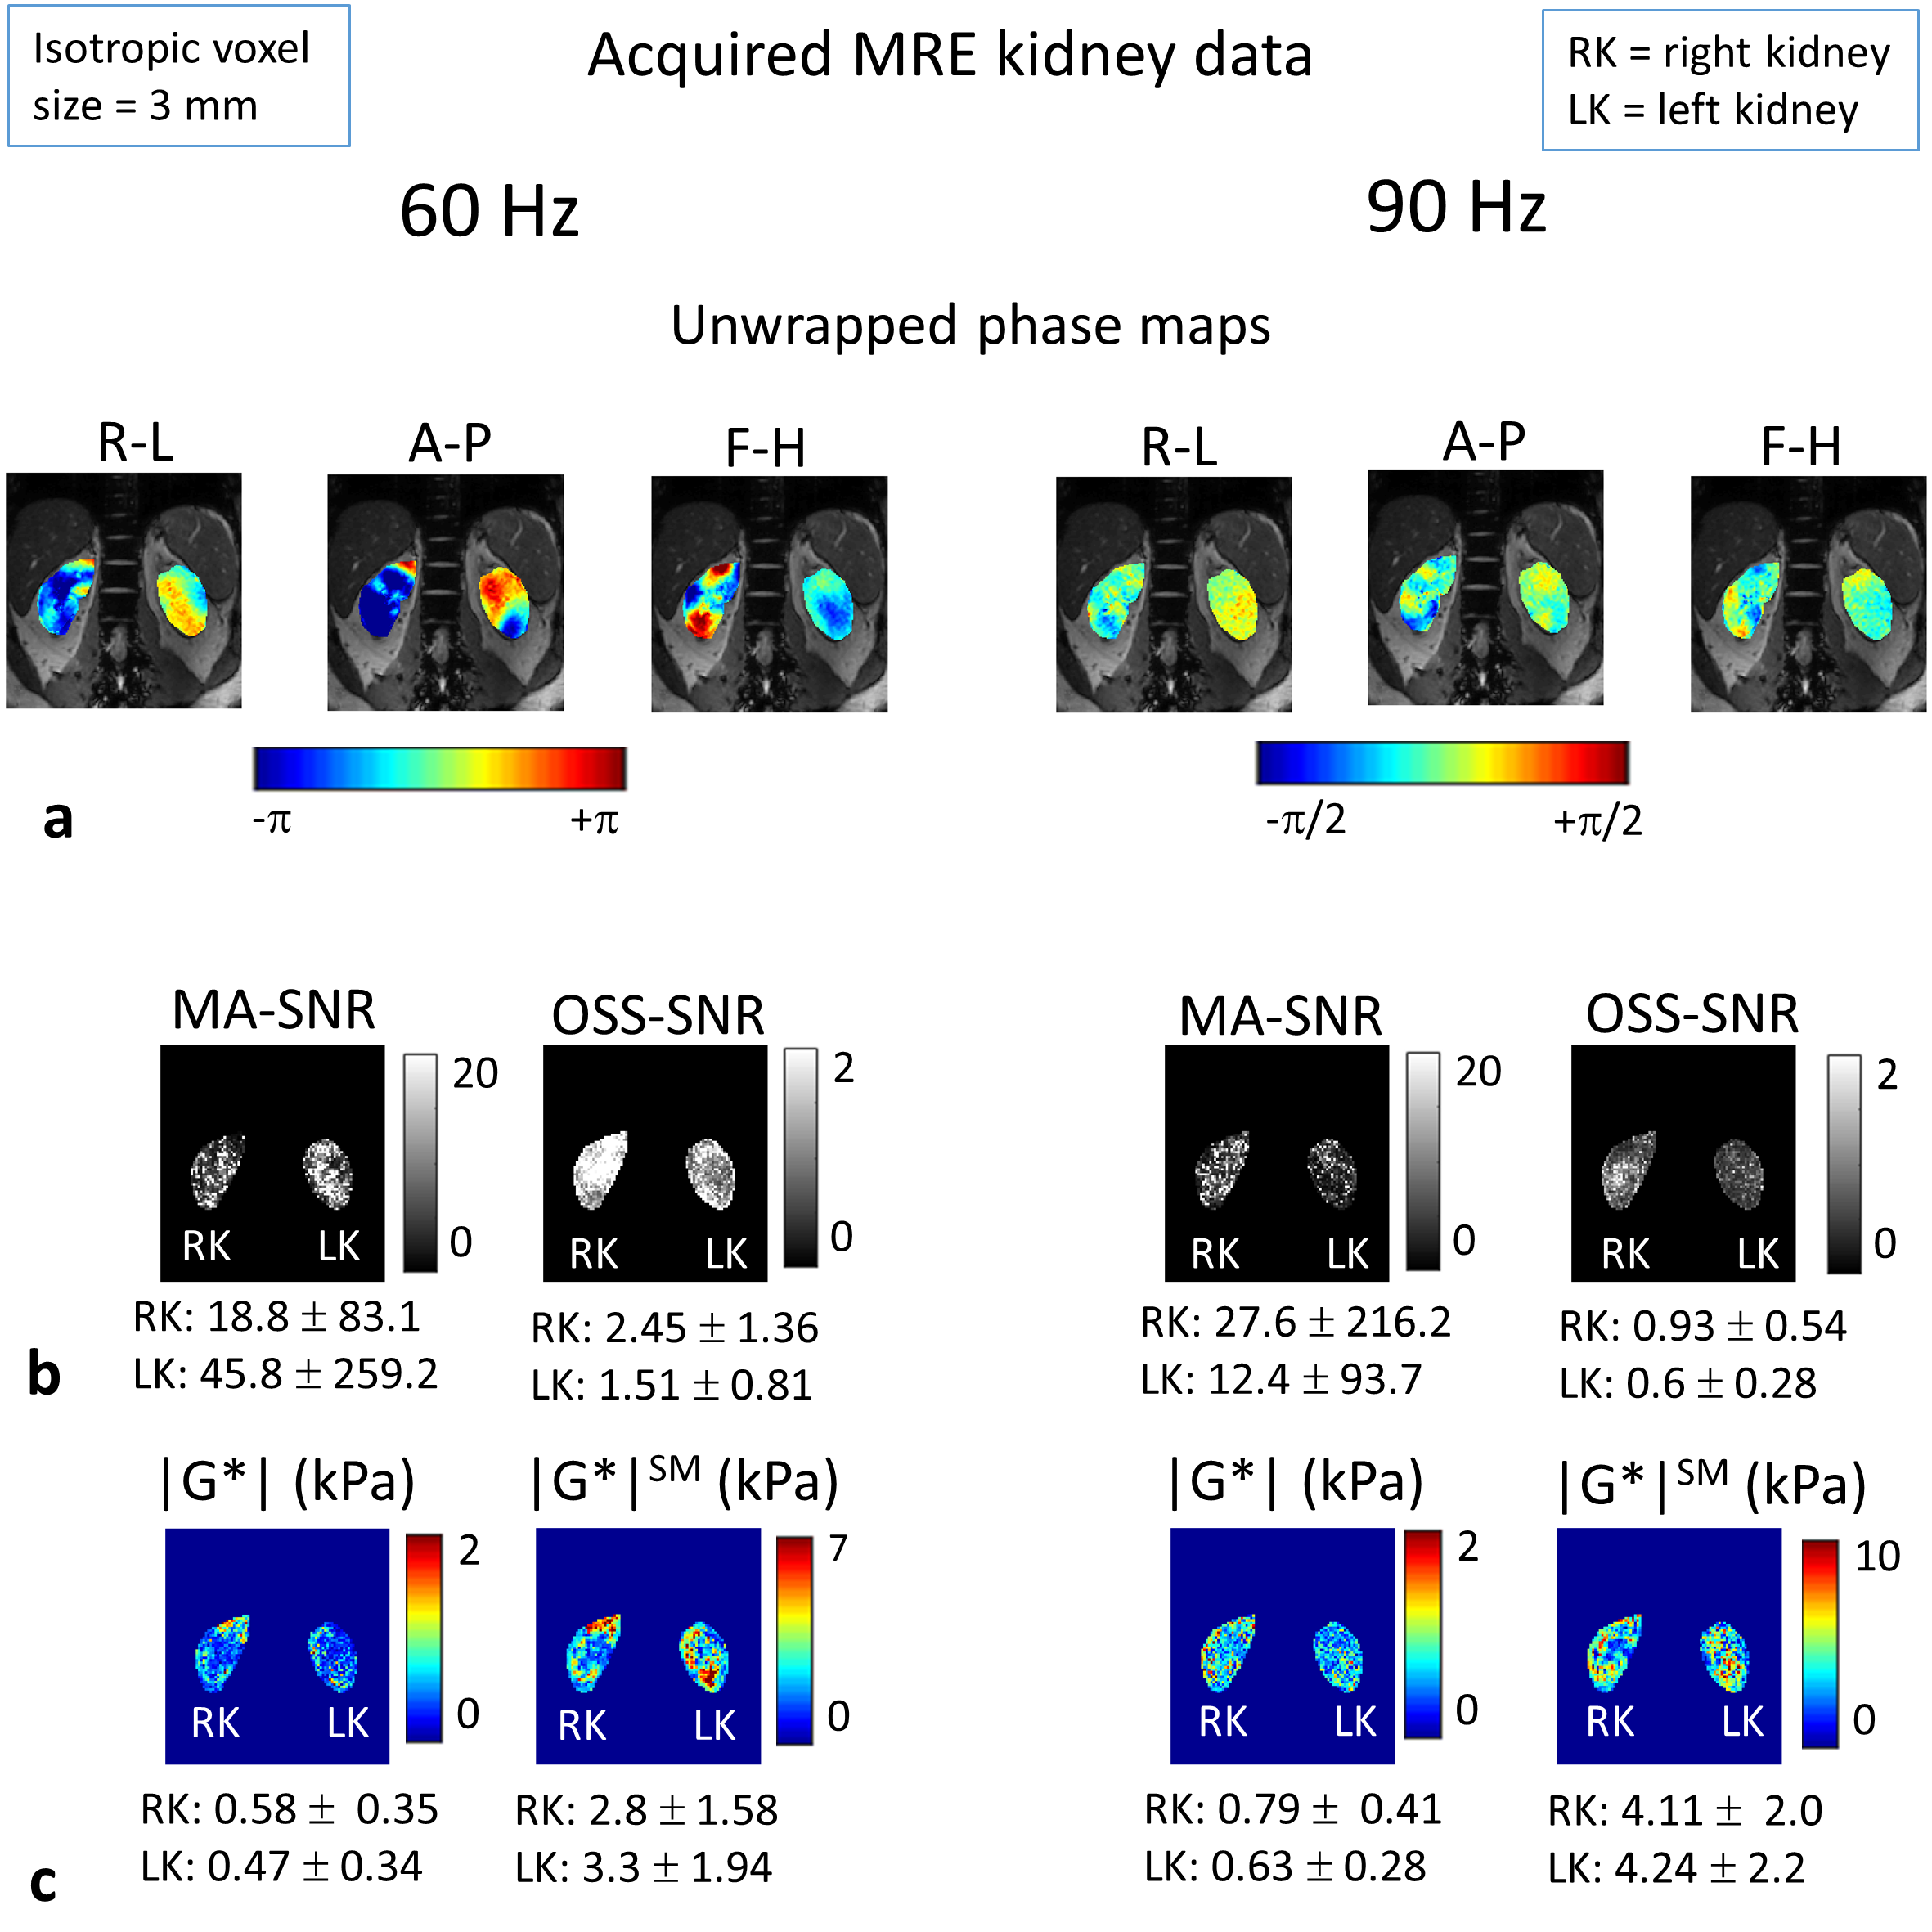
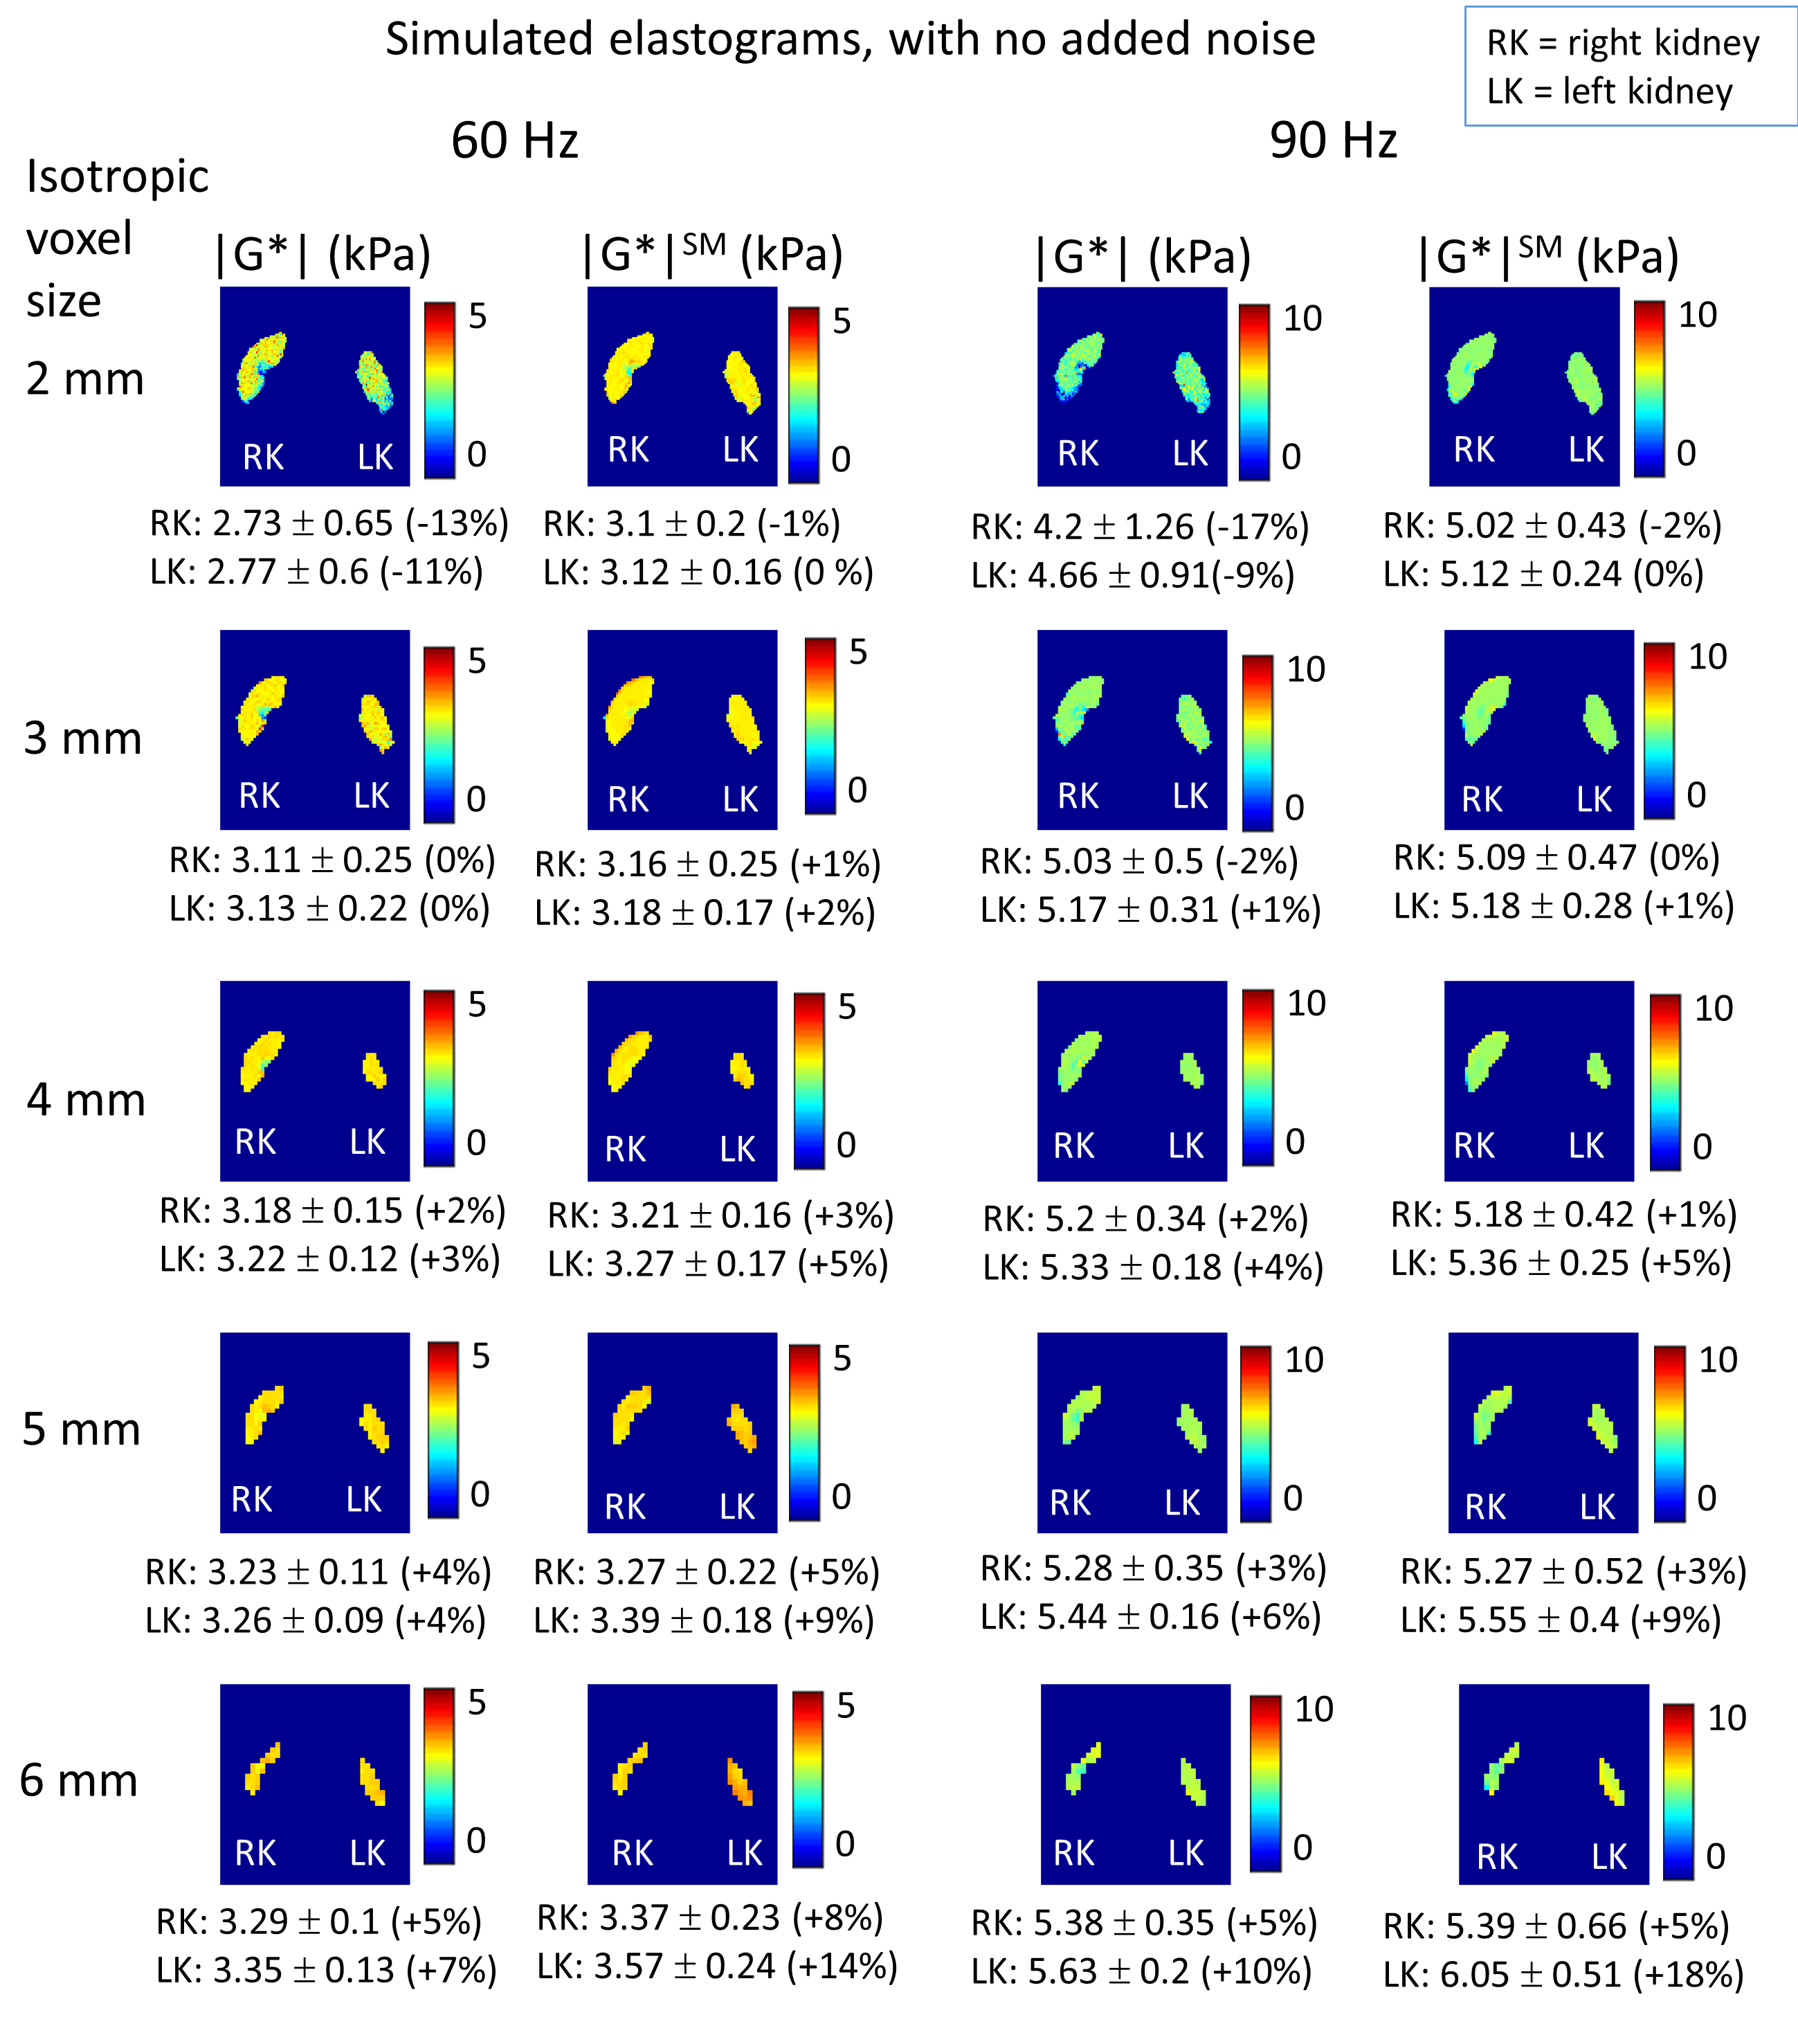
MRE Simulation: A FEM of the torso was created including both kidneys, bone (spine and ribs), fat, and other soft tissue3 (Fig.1). Both kidneys were modelled as uniform tissue with values estimated from literature4,5. MRE was simulated at 60 and 90 Hz by delivering a 30-μm harmonic displacement in the anterior-posterior direction at nodes selected to match the driver positions on the subject's back. Nodal displacements were resampled on a virtual-voxel grid to create isotropic voxels of varying size (2-6 mm). Simulated phase offset images (4 offsets to match acquisition) were generated from the simulated steady-state data and Gaussian random noise added at varying levels of SNR (denoted "measured-motion-SNR", MM-SNR), and the steady-state recalculated by Discrete Fourier Transform. Direct inversion6 was employed to reconstruct the magnitude of the complex shear modulus |G*|, with and without added noise, and with and without smoothing of the displacements with a 3D box filter (3x3x3 voxels). For each voxel steady-state motion-SNR ("motion-amplitude-SNR", MA-SNR) and the octahedral-shear-strain-SNR (OSS-SNR) were estimated7.MRI Acquisition: 2D GRE MRE was acquired on a 3-Tesla Philips Ingenia (healthy male volunteer, 26 years) with 3 coronal slices positioned through the centre of both kidneys (3-mm isotropic, FOV=9x288x288mm3, TR=56 ms, TE=20 ms, for each slice 4 phase offsets acquired in 16-s breath-hold). Two passive drivers (connected via a T-connector of acoustic wave-guide) were positioned inside a foam layer on the scanner bed, for stability and comfort, and placed under each kidney. Acquisitions were made at 60 and 90 Hz vibration frequencies for 3 motion-encoding directions. Direct inversion was employed with and without smoothing. A whole body mDixon dataset3 was acquired in the same subject for FEM development.
RESULTS
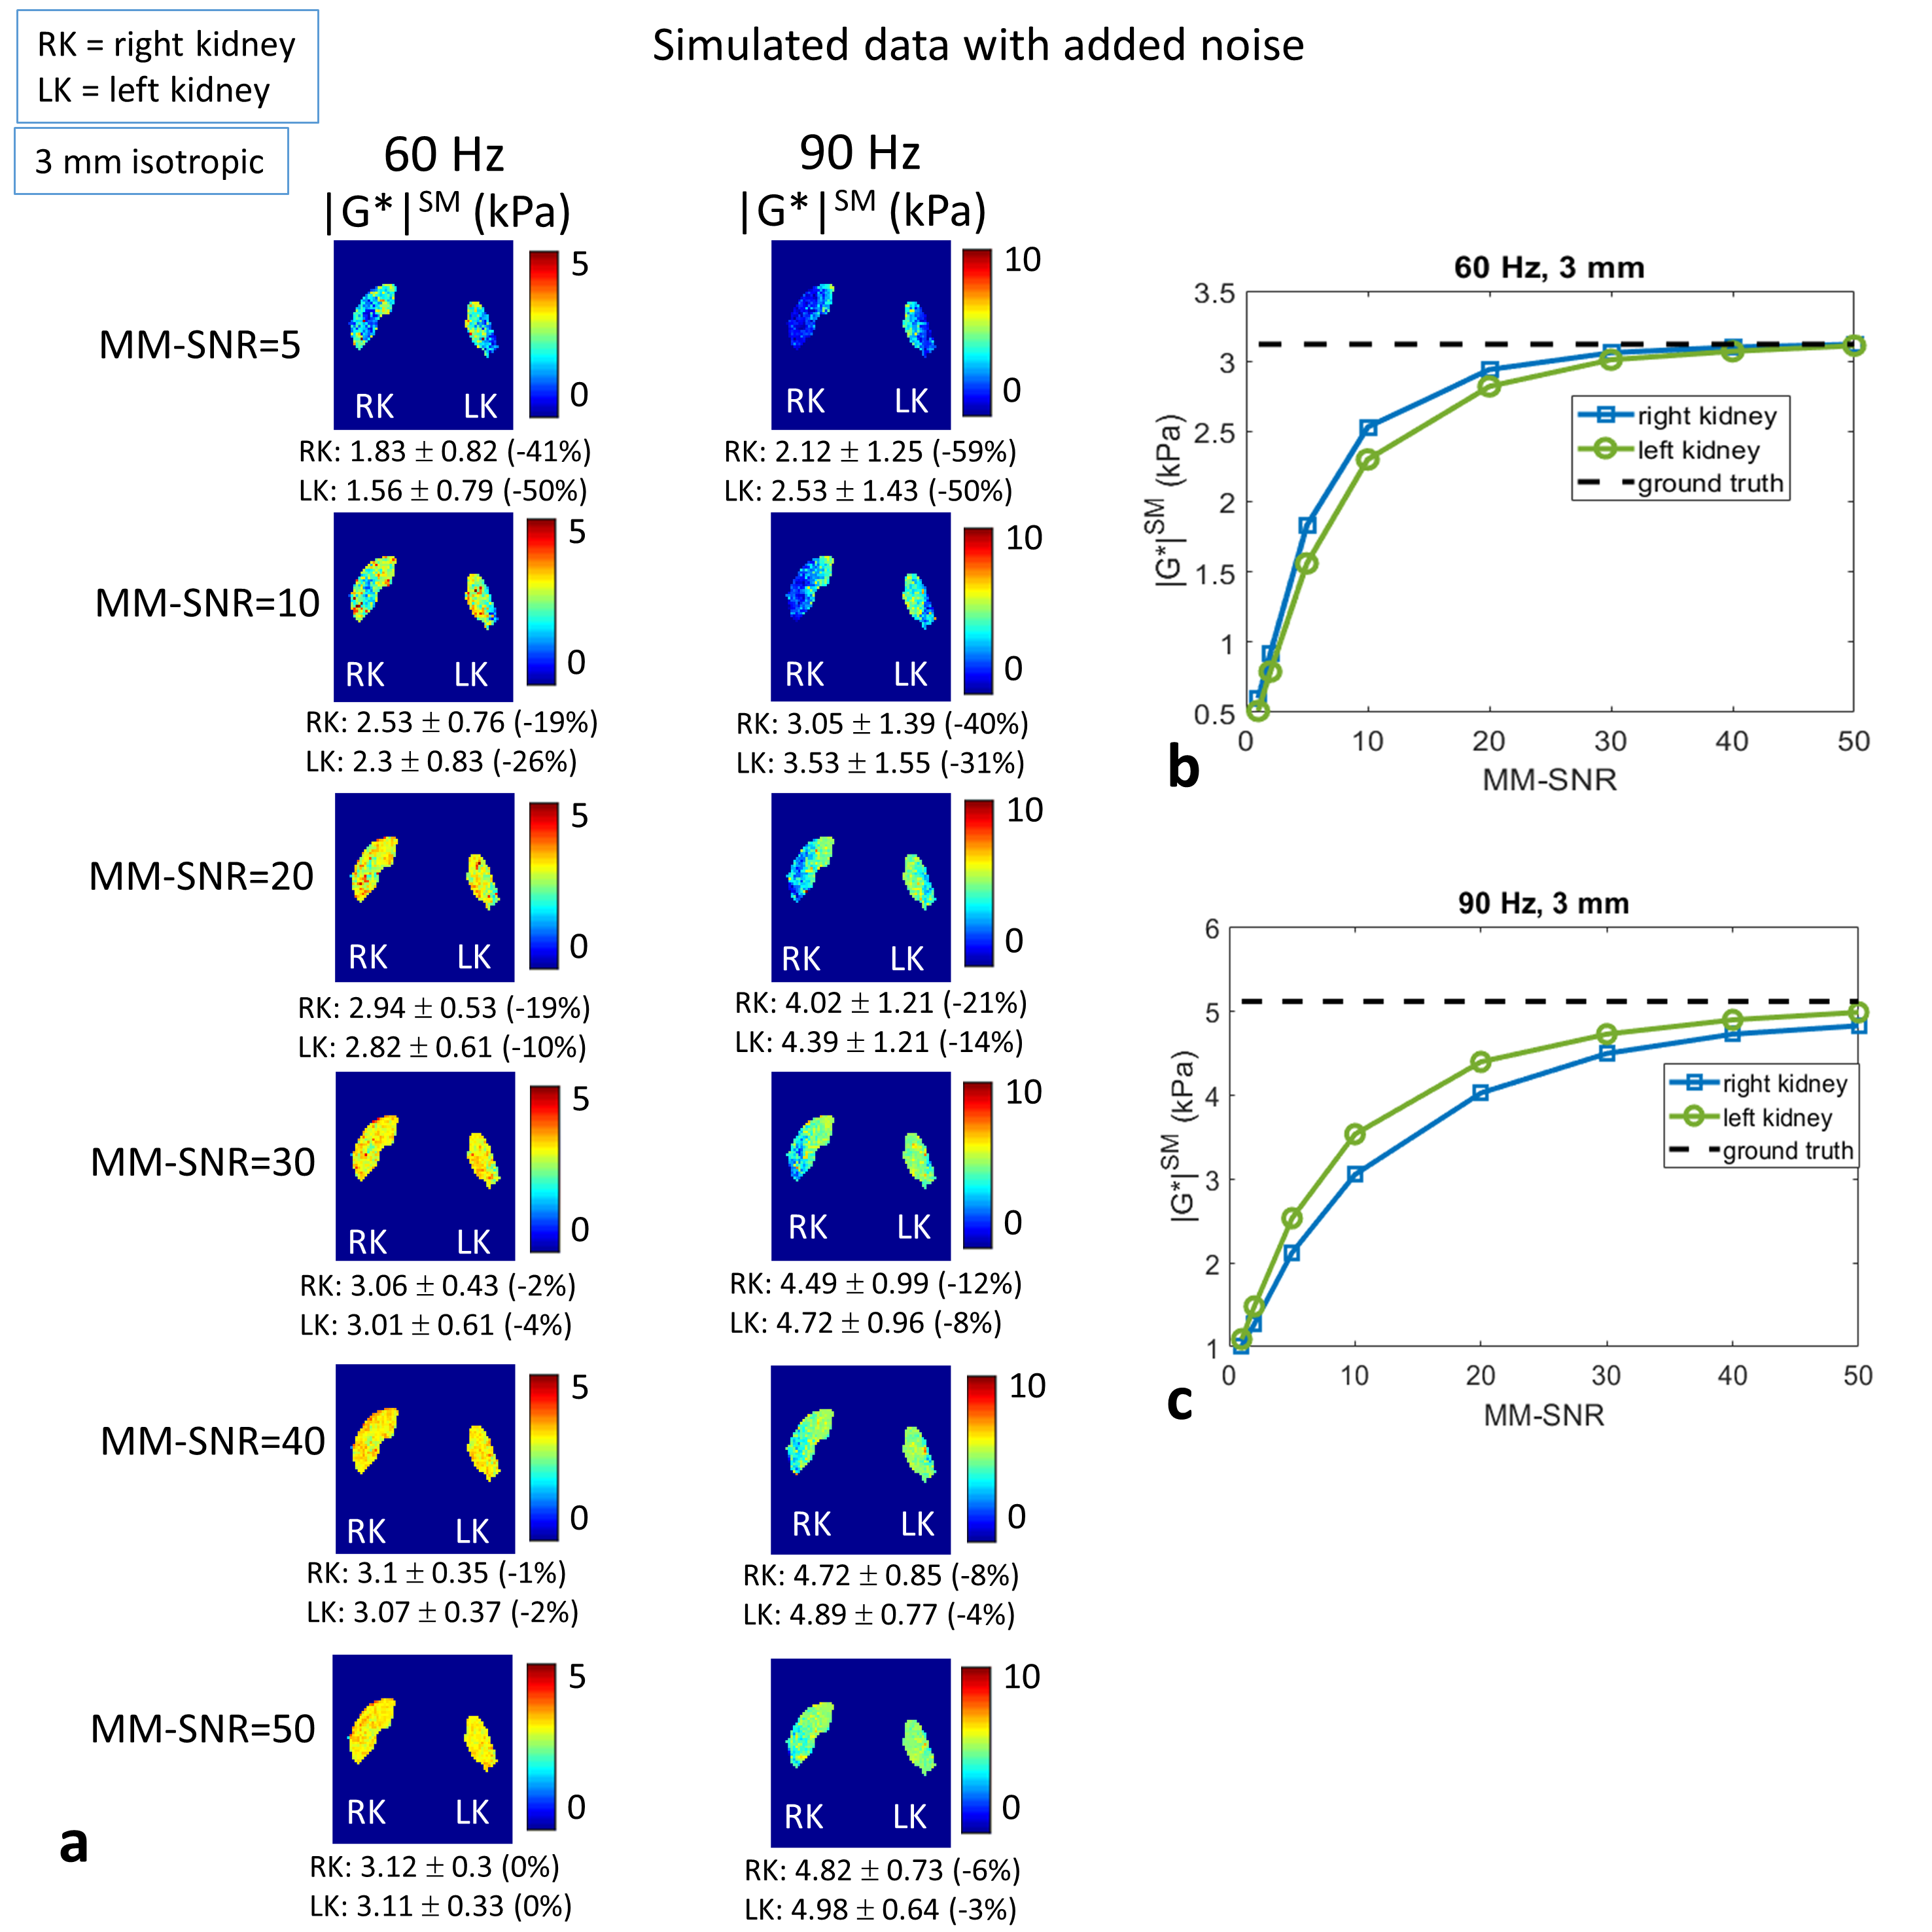
Simulated (Fig.2a) and acquired (Fig. 3a) displacement fields show similarities; the delivered waves (simulated and acquired) reflect off the spine into the kidneys, discernible in the R-L direction motion, and in the 90 Hz divergence (Fig. 2b). MA-SNR varied greatly between frequencies and kidneys, while OSS-SNR also varied but to a lesser extent (Fig 3b). Notably, if the MA-SNR was higher in one kidney, it did not necessarily follow that the OSS-SNR was also higher on that side. This demonstrates how motion-SNR can be associated with compressive rather that shear-wave motion. The acquired elastograms (Fig 3c) with smoothing were closer to literature values than those without smoothing. Simulated noise-free elastograms for different imaging resolutions (Fig.4) demonstrate 3-mm isotropic is the theoretical optimum resolution for the model, giving overall the lowest errors on the mean kidney |G*| compared with ground truth. Figure 5 explores the effect of noise at 3-mm for a range of frequencies in the range of motion-SNR from acquired data (note: MA-SNR will be higher than MM-SNR and a function of the number of phase offsets7). Elastograms and plots in Fig.5 demonstrate that for a given MM-SNR, different magnitudes of error can occur for the two kidneys and for different frequencies, but the mean values approach ground-truth at MM-SNR > 50, although the errors are already low at MM-SNR=30.DISCUSSION
This preliminary investigation provides important information for renal MRE development: 1) Optimum resolutions can be identified for an assumed ground truth, also implying that non-optimal resolutions can lead to systematic biases (Fig 4). However other work has shown that larger voxels can offset the influence of imaging noise when using direct inversion8,9. 2) Kidney MRE motion fields are potentially highly dominated by compression waves, which are less relevant to shear modulus determination than the shear waves, and hence finding ways to increase OSS-SNR should be a focus. 3) Different measures for the left and right kidney should not be assumed to be true variation of properties, but may be affected by wave characteristics and anatomy. 4) Apparent heterogeneity of properties within the kidney may be due to noise (Fig.5). Future work will explore optimisation of the MRE acquisition through simulations, especially for tailoring wave-delivery to maximise shear wave formation in kidney tissue. As acquired wave amplitudes were lower at 90 Hz, likely due to viscoelastic wave attenuation, solutions will be sought to counterbalance this effect. In future a heterogeneous kidney tissue will be modelled, and different inversion algorithms compared with direct inversion.Acknowledgements
This work was funded by Kidney Research UK (Grant number KS_RP_016_20190919).References
1. Jiang K, Ferguson CM, Lerman LO. Noninvasive assessment of renal fibrosis by magnetic resonance imaging and ultrasound techniques. Transl Res 2019;209:105-120.
2. Leong SS, Wong JHD, Md Shah MN, Vijayananthan A, Jalalonmuhali M, Ng KH. Shear wave elastography in the evaluation of renal parenchymal stiffness in patients with chronic kidney disease. Br J Radiol 2018;91(1089):20180235.
3. McGrath D, Bradley C, Francis S. Validation of the Accuracy of Magnetic Resonance Elastography of the Liver via 3D Finite Element Modelling Simulation. Proc Intl Soc Mag Res Med 2020;28:3334.
4. Low G, Owen NE, Joubert I, Patterson AJ, Graves MJ, Glaser KJ, Alexander GJ, Lomas DJ. Reliability of magnetic resonance elastography using multislice two-dimensional spin-echo echo-planar imaging (SE-EPI) and three-dimensional inversion reconstruction for assessing renal stiffness. J Magn Reson Imaging 2015;42(3):844-850.
5. Streitberger KJ, Guo J, Tzschätzsch H, Hirsch S, Fischer T, Braun J, Sack I. High-resolution mechanical imaging of the kidney. J Biomech 2014;47(3):639-644.
6. McGrath DM, Ravikumar R, Wilkinson ID, Frangi AF, Taylor Z. Magnetic resonance elastography of the brain: An in silico study to determine the influence of cranial anatomy. Magn Reson Med 2016;76(2):645-662.
7. McGarry MD, Van Houten EE, Perrinez PR, Pattison AJ, Weaver JB, Paulsen KD. An octahedral shear strain-based measure of SNR for 3D MR elastography. Phys Med Biol 2011;56(13):N153-164.
8. Papazoglou S, Hamhaber U, Braun J, Sack I. Algebraic helmholtz inversion in planar magnetic resonance elastography. Phys Med Biol 2008;53:3147-3158.
9. Yue JL, Tardieu M, Julea F, Boucneau T, Sinkus R, Pellot-Barakat C, Maitre X. Acquisition and reconstruction conditions in silico for accurate and precise magnetic resonance elastography. Phys Med Biol 2017;62(22):8655-8670.
Figures