1018
Effect of different driver power amplitudes on the measurement of liver stiffness in pediatric liver MR elastography1Radiology, Armed Forces Capital Hospital, Seongnam, Korea, Republic of, 2Center for Clinical Imaging Data Science, Severance Hospital, Seoul, Korea, Republic of, 3Radiology, Severance Hospital, Seoul, Korea, Republic of
Synopsis
The standard driver power of magnetic resonance elastography (MRE) in pediatric patients is recommended to be reduced by 20–50%, compared to adult patients, to keep the patients from any injury due to the vibrating driver, however, there is limited published information on driver power of MRE in pediatric applications. Furthermore, there is lack of study to evaluate whether different amplitudes of driver power may affect the measurement of liver stiffness on pediatric MRE. In this abstract, we assessed the effect of different driver power amplitudes on the measurement of liver stiffness in pediatric liver MRE.
Introduction
For diagnosis of hepatic fibrosis, the magnetic resonance elastography (MRE) is one of the most commonly used methods by measuring liver stiffness.1-3 On MRE protocol, the active driver typically generates 60-Hz vibrations, passed to the passive driver placed on patient.4 A few of previous studies recommended the standard driver power of MRE in pediatric patients to be reduced by 20–50%, compared to adult patients in order to keep the patients from any injury due to the vibrating driver.5,6 However, there is limited published information on driver power of MRE in pediatric applications and appropriate power level could be subjectively chosen by patient’s weight,7 height and size.5 Furthermore, there is lack of study to evaluate whether different amplitudes of driver power may affect the measurement of liver stiffness on pediatric MRE. Therefore, the aim of this study was to assess the effect of different driver power amplitudes on the measurement of liver stiffness in pediatric liver MRE.Methods
1) Study populationFrom January 2018 to May 2018, pediatric patients (≤ 18 years old) who underwent MRE with two driver power amplitudes of 20% (70% reduction from adults’ default level of 70%) and 56% (20% reduction from adults’ default level) were included in this study.
2) Data acquisition
On MRE protocol, mechanical waves with 60-Hz frequency were typically generated in the active driver, which was located outside the MRI room. The driver power amplitudes of 20% and 56% were used in each patient, according to the previous studies.5,6,8 Four axial quantitative images displaying shear stiffness on MRE were generated by processing the sequence to collect axial wave images sensitized along the through-plane motion direction.
3) Data analysis
Quantitative measurement was performed using a commercial three-dimensional software program (Aquarius iNtuition version 4.4.12, TeraRecon Inc., Foster City, CA, USA). Four axial fusion images combining T2-weighted axial images and stiffness maps with 95% confidence map were obtained using the software. Free-hand region-of-interests (ROIs) were drawn on four contiguous images of liver stiffness map to include the largest areas of liver parenchyma. Intraclass correlation coefficients (ICCs) of area, mean, maximum, minimum and standard deviation of liver stiffness were evaluated to assess the agreement of measured values between two different driver power amplitudes.9
Results
A total 16 patients (M:F = 10:6, median age = 12.5 years, range: 7-18 years) underwent liver MRE using two driver power amplitudes. All stiffness maps of MRE showed areas within 95% confidence interval in the liver and there was no patient with technical failure of MRE. On MRE using driver power amplitudes of 20% and 56%, the median ROI areas were 82.9 cm2 (range, 46.9-961.4 cm2) and 61.7 cm2 (range, 5.4-123.4 cm2), respectively. Median values of mean stiffness value were 2.1 kPa (1.7-8.0 kPa) and 2.8 kPa (1.9-8.5 kPa), respectively. Maximum values of liver stiffness were 5.1 kPa (2.4-12.0 kPa) and 7.9 kPa (3.4-12.0 kPa). Minimum values of liver stiffness were 1.8 kPa (0-8.0 kPa) and 1.1 kPa (0-4.1 kPa). The standard deviation were 0.6 kPa (0.3-2.7 kPa) and 1.0 kPa (0.4-3.1 kPa). The ICC values between 20% and 56% driver powers were 0.09-0.38 for areas, maximum, minimum and standard deviation values, while mean stiffness value showed ICC value of 0.898 (95% CI, 0.690-0.955).Discussion
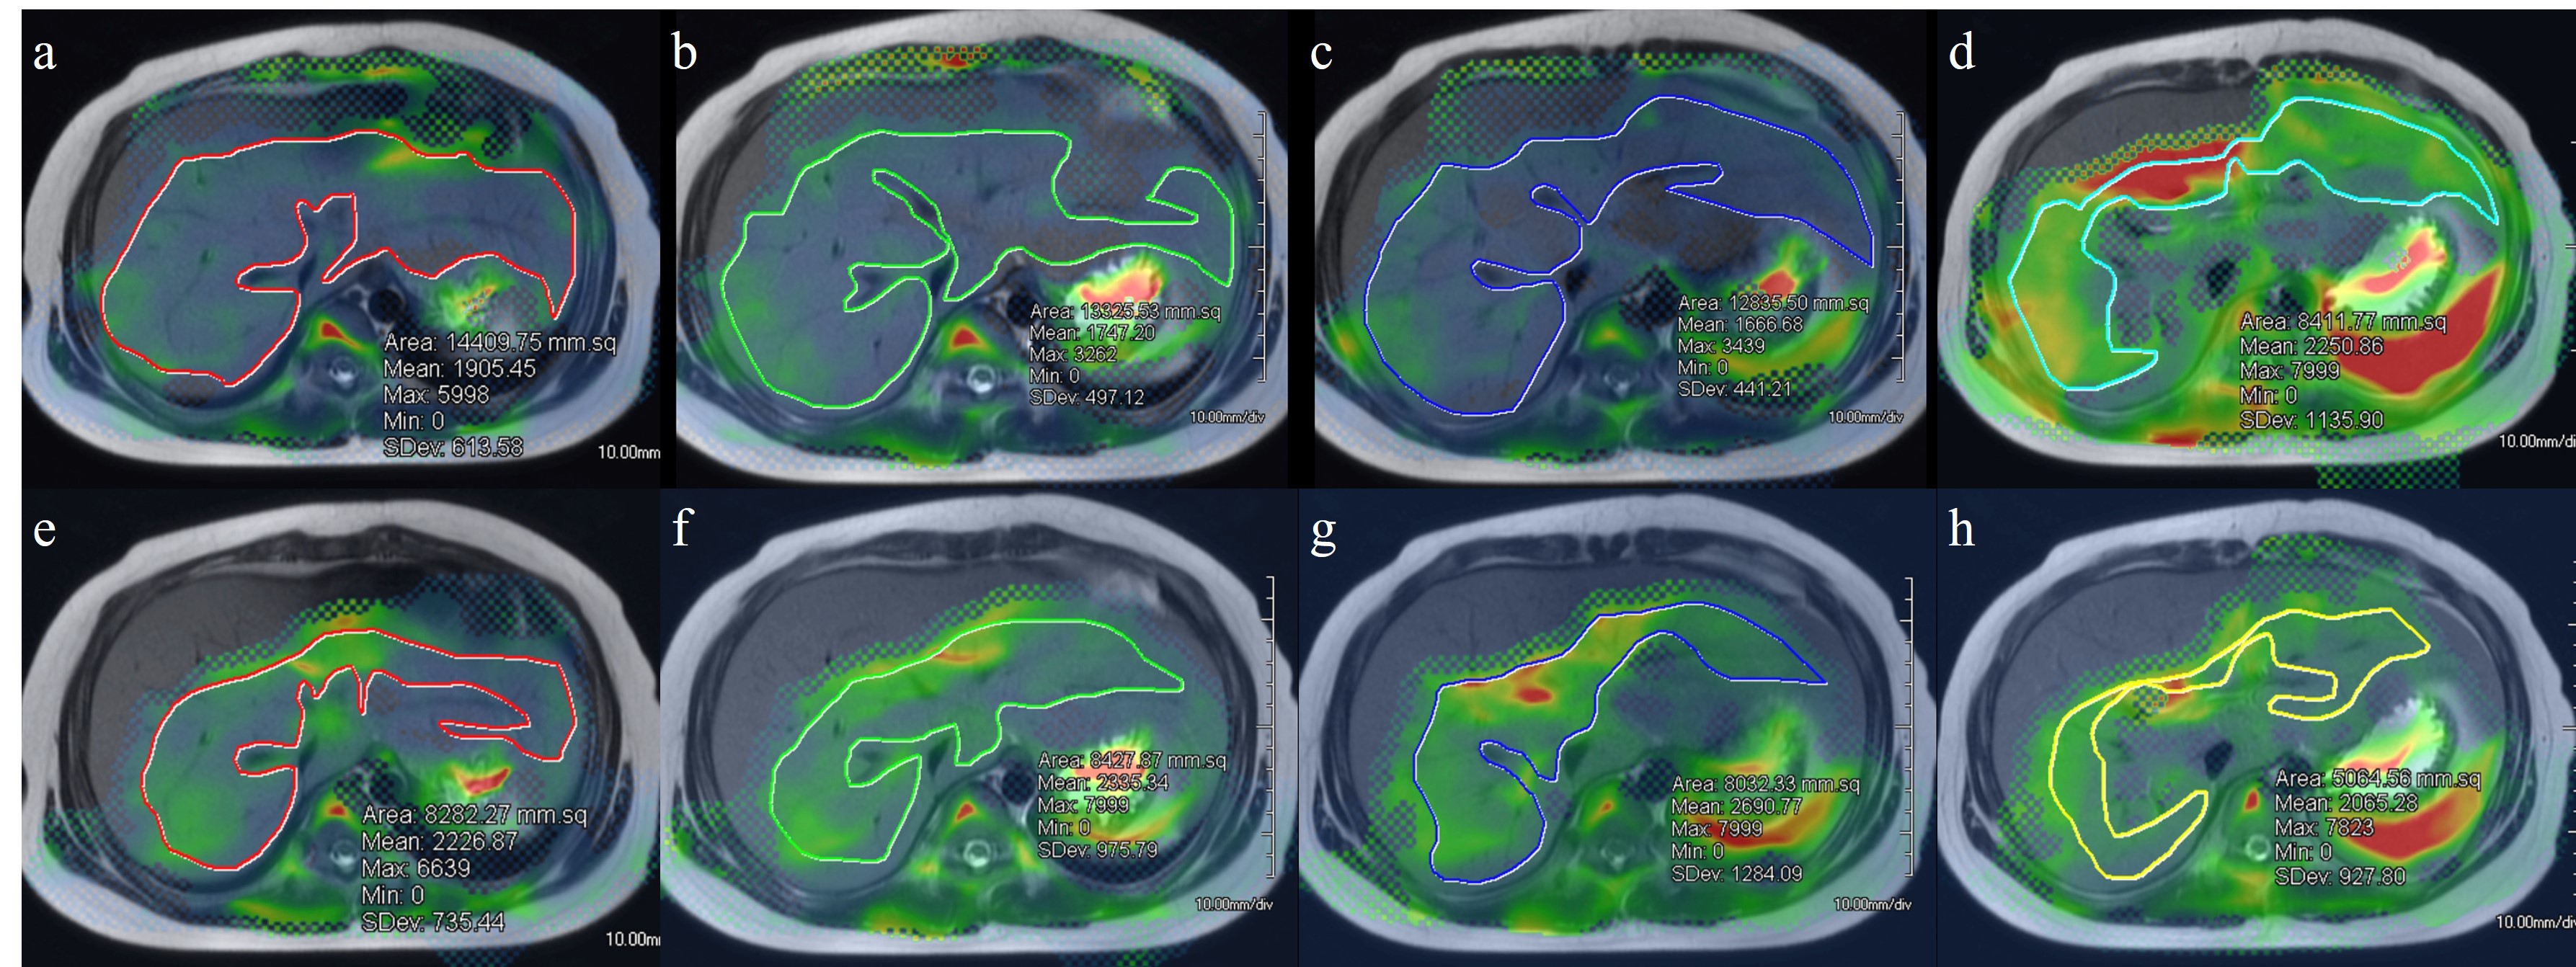
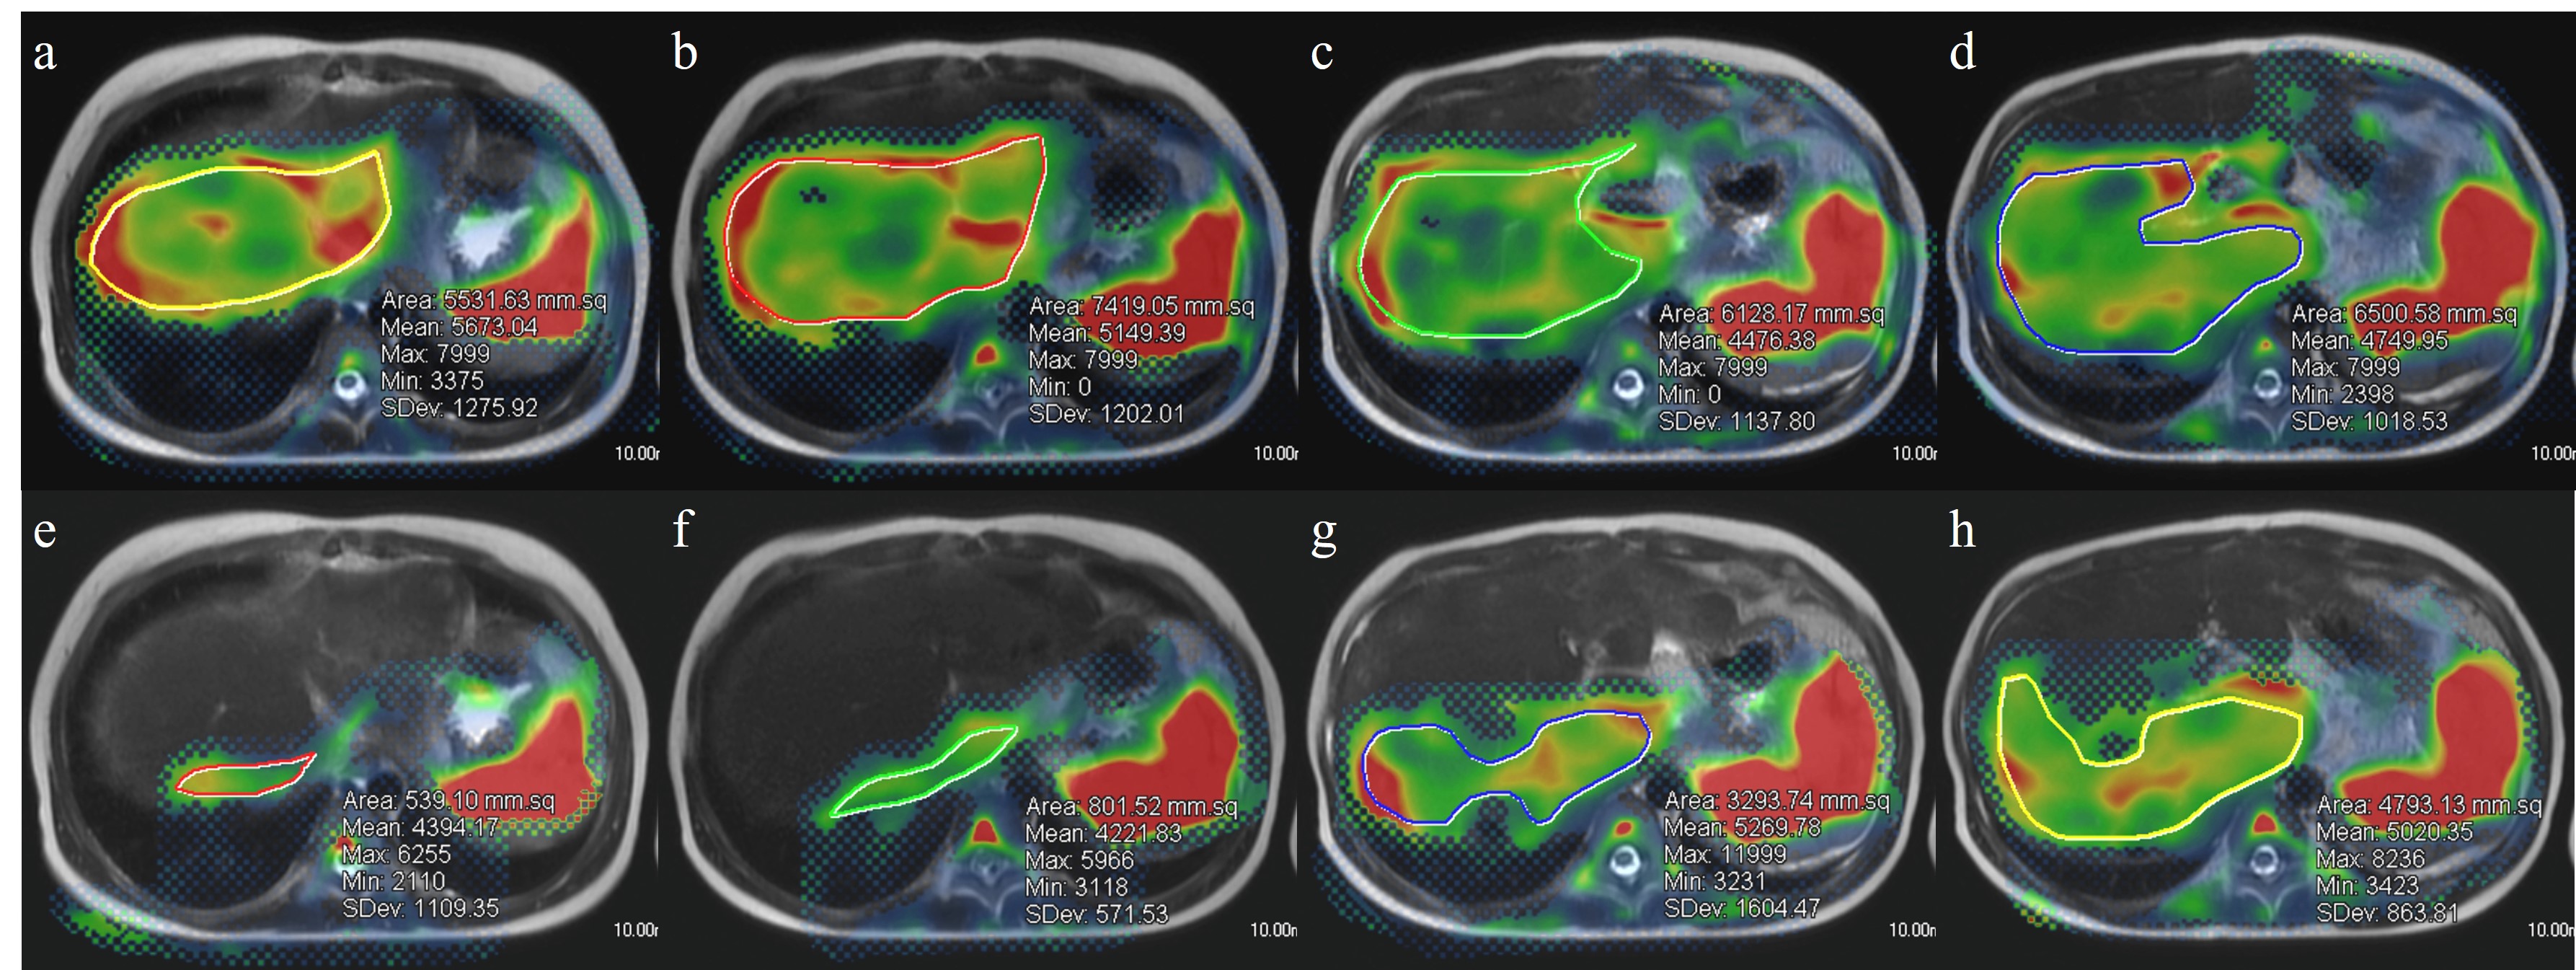
For optimizing the driver power amplitude on MRE, quality control of images, patient’s comfort and consistent values of quantitative parameters should be focused on. One previous study revealed that there was no significant difference in the liver stiffness values between MRE with amplitude 50% and 70% in adult volunteers.4 Our result in pediatric patients was similar to that of previous study in which mean liver stiffness value showed good reliability (ICC: 0.898, 95% CI: 0.690-0.955) between 20% and 56% driver amplitudes. However, the measurable ROI areas as well as maximum, minimum and standard deviation values showed poor reliability. Using the higher driver amplitude, the ROI size was smaller and standard deviation was larger (Figure 1 and 2). The exact reasons for small ROI areas in MRE with higher driver amplitude are unknown, but it could be associated with image artifacts due to excessive vibration artifact.10 Proper adjustment of driver power amplitude is necessary especially for younger children, because liver size would be smaller than adolescent. From our results, determining lower driver power amplitude is needed not only for reducing patients’ discomfort, but also for coverage of adequate liver parenchyma and reducing standard deviation for more comprehensive evaluation of liver disease, even with consistent mean value. Therefore, it seems to be important to determine the appropriate driver amplitude in pediatric MRE according to not only age but also body size.Conclusion
The liver stiffness values measured with two different driver power amplitudes on MRE showed good reliability in pediatric patients. However, areas and standard deviations showed poor reliability, with tendency of higher the driver amplitude, the smaller the ROI areas and larger standard deviation. Therefore, further studies are needed to optimize appropriate driver power amplitude on liver MRE according to the size of pediatric liver.Acknowledgements
NoneReferences
1. Etchell E, Jugé L, Hatt A, Sinkus R, Bilston LE. Liver Stiffness Values Are Lower in Pediatric Subjects than in Adults and Increase with Age: A Multifrequency MR Elastography Study. Radiology 2017; 283:222-230
2. Serai SD, Dillman JR, Trout AT. Spin-echo Echo-planar Imaging MR Elastography versus Gradient-echo MR Elastography for Assessment of Liver Stiffness in Children and Young Adults Suspected of Having Liver Disease. Radiology 2017; 282:761-770
3. Trout AT, Sheridan RM, Serai SD, et al. Diagnostic Performance of MR Elastography for Liver Fibrosis in Children and Young Adults with a Spectrum of Liver Diseases. Radiology 2018; 287:824-832
4. Shinagawa Y, Mitsufuji T, Morimoto S, et al. Optimization of scanning parameters for MR elastography at 3.0 T clinical unit: volunteer study. Jpn J Radiol 2014; 32:441-446
5. Serai SD, Towbin AJ, Podberesky DJ. Pediatric liver MR elastography. Dig Dis Sci 2012; 57:2713-2719
6. Binkovitz LA, El-Youssef M, Glaser KJ, Yin M, Binkovitz AK, Ehman RL. Pediatric MR elastography of hepatic fibrosis: principles, technique and early clinical experience. Pediatr Radiol 2012; 42:402-409
7. Joshi M, Dillman JR, Towbin AJ, Serai SD, Trout AT. MR elastography: high rate of technical success in pediatric and young adult patients. Pediatr Radiol 2017; 47:838-843
8. Kim JK, Yoon H, Lee M-J, et al. Feasibility of Spin-Echo Echo-Planar Imaging MR Elastography in Livers of Children and Young Adults. Investig Magn Reson Imaging 2019; 23:251-258
9. Bland JM, Altman D. Statistical methods for assessing agreement between two methods of clinical measurement. Lancet 1986; 327:307-310
10. Siegel MJ, Priatna A, Bolster Jr BD, Kotyk JJ. Pediatric MR elastography of the liver. Clin Pediatr Imaging 2012:108-111
Figures