1015
Investigation of Motion as a Source of Error in MR Elastography1School of Biomedical Engineering & Imaging Sciences, King's College London, London, United Kingdom, 2Perspectum, Oxford, United Kingdom, 3INSERM U1148, Laboratory for Vascular Translational Science, University Paris Diderot, University Paris 13, Paris, France
Synopsis
Clinically, motion occurring between breath-hold acquisitions during a magnetic resonance elastography (MRE) scan is assumed negligible and therefore not corrected. In this work, we demonstrate through simulations on a phantom that motion of this degree does impact elasticity reconstruction, which highlights the need for care to be taken to account for this motion.
Introduction
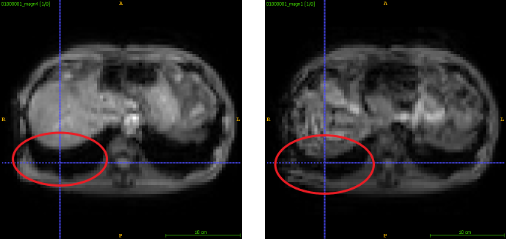
Magnetic resonance elastography (MRE) is a quantitative imaging technique that has shown to be useful in staging liver fibrosis1 by assessing the stiffness of the tissue. A liver MRE sequence consists of four breath-hold acquisitions, three to image the wave propagation in each direction and one to serve as a reference. Clinical scenarios usually assume that breath-holds are consistent, with no correction needed. However, motion between these breath-holds exists (Figure 1) due to factors such as patient and physiological movement, with a previous study on clinical data observing as much as 7.83 ± 8.5 mm of motion within the liver between breath-holds2. This motion is a combination of rigid and nonlinear movement. Consequently, we demonstrate through controlled experiments on a phantom that there can be significant change in elasticity just due to motion which could impact clinical diagnosis.Methods
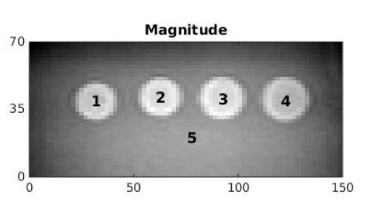
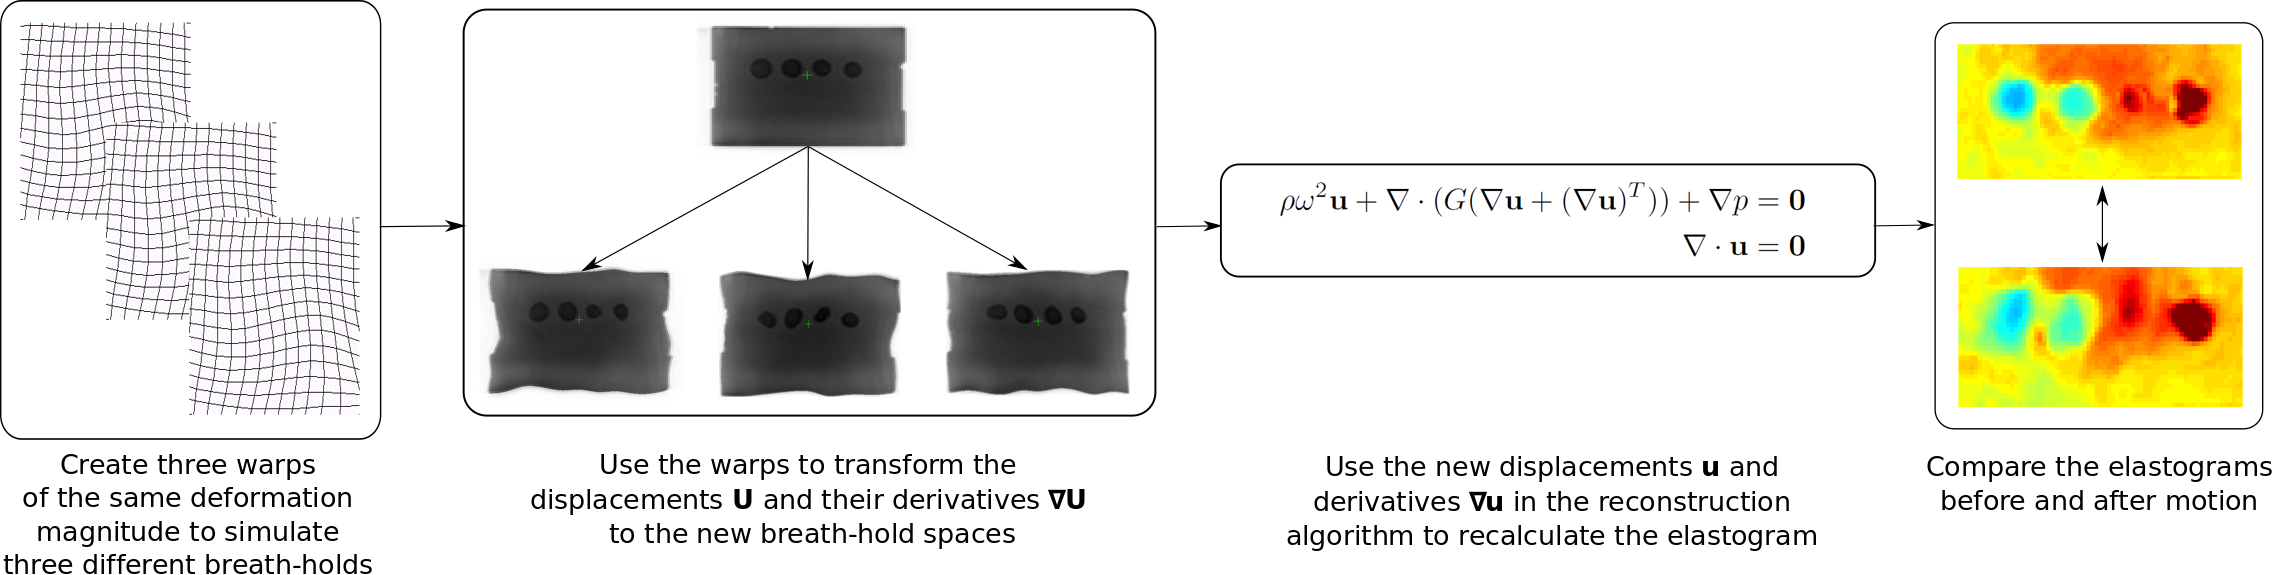
In this work, we used the CIRS 0493 elastography phantom (Figure 2), which consisted of five regions – four spherical inclusions, two softer and two stiffer than the fifth background region. The images were 160 x 160 x 12 voxels, cropped to 75 x 35 x 11 voxels for analysis, with a resolution of 2 x 2 x 2 mm3 and the spherical inclusions were 20 mm in diameter.The framework used to investigate the motion in MRE can be seen in Figure 3. To produce one simulation, three ($$$i= 1, 2, 3$$$) random warps, $$$\textbf{T}_{i}$$$, of the same level of motion were created. These were used to simulate the three different breath-holds needed for one reconstruction, where the reference has already been incorporated into the three wave data sets. These warps were a combination of random rigid translation to simulate bulk motion and nonlinear deformation created using free-form deformations and B-spline interpolation4. The wave displacements $$$\textbf{U}_{i}$$$ in the original space, $$$\textbf{X}$$$, were mapped to the three new spaces using $$$\textbf{u}_{i} = \textbf{U}_{i}\circ\textbf{T}_{i}$$$. To find the gradients $$$\triangledown_{\textbf{x}_{i}}\textbf{u}_{i}$$$, the derivatives were taken in the new spaces $$$\textbf{x}_{i}$$$. This was to best mimic the issue of motion in liver scans, where to reconstruct without knowledge that the breath-hold displacements are in different spaces, the gradient would be taken in those spaces. These new warped displacements and gradients were then used in the reconstruction algorithm5 to solve the wave equation (Figure 3) and recalculate the shear modulus, $$$G = G' + iG''$$$, where $$$G'$$$ is the storage modulus and $$$G''$$$ is the loss modulus.
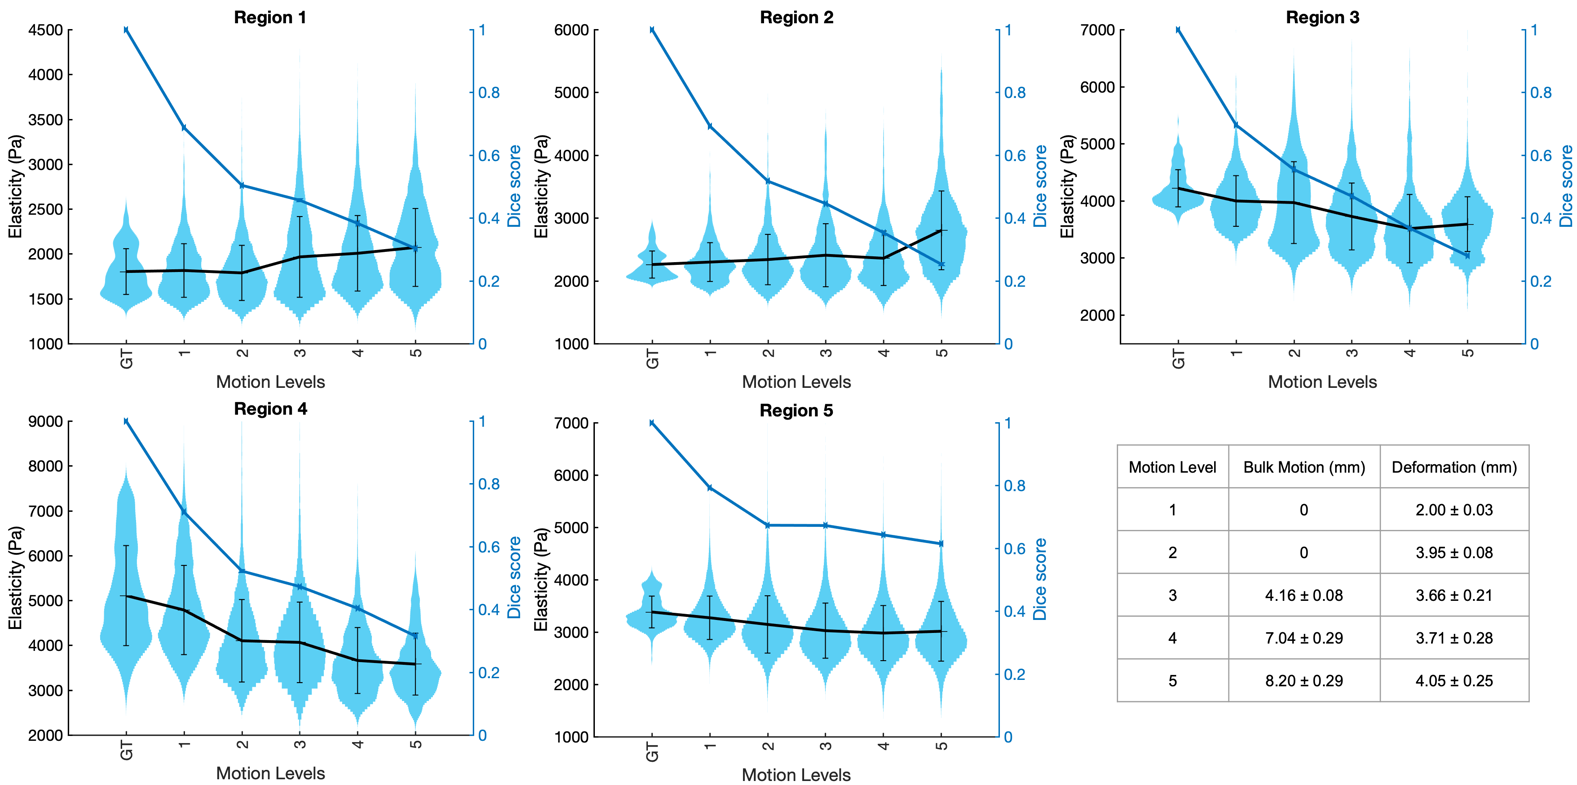
This procedure was done for five different motion levels to simulate the degree of motion found in the liver, with 20 repeated cases for each motion level. The elasticity distributions of all of the repeated cases together at each motion level were then compared to the ground truth without any motion applied.
Results and Discussion
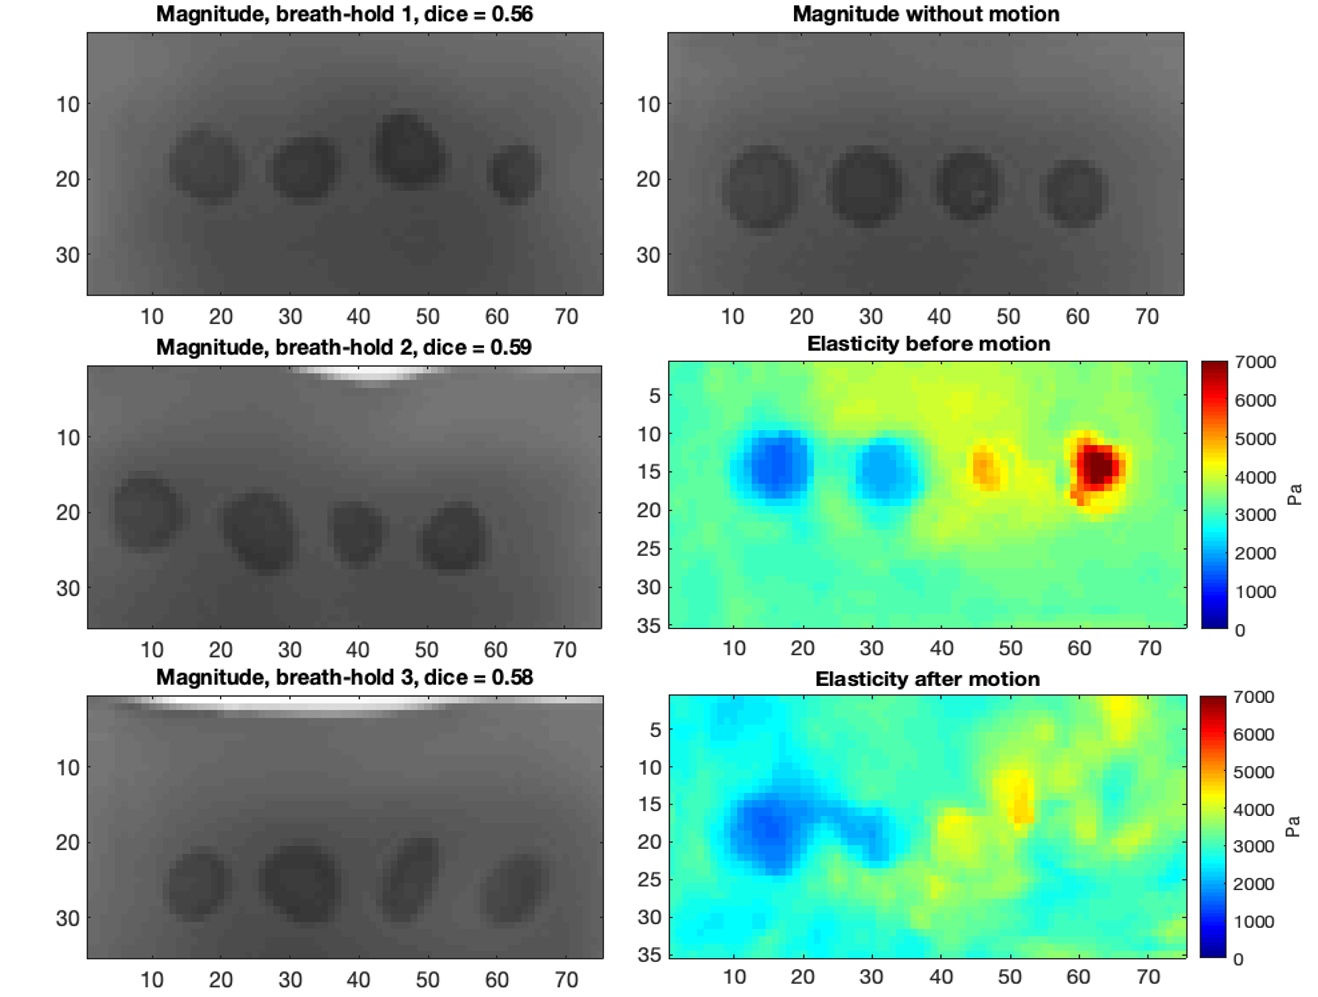
The violin plots in Figure 4 show the spread of elasticity observed within each region from all repeated cases with increasing simulated motion. The average Dice overlaps between the regions before and after motion are also shown against the different motion levels. This was calculated as the mean of the Dice scores for the three breath-holds that constitute a single reconstruction, then these were averaged over all the repeated cases. The results indicate that with increasing motion, and therefore decreasing Dice overlap between the inclusions before and after motion, regions softer than the background increased in elasticity and regions stiffer than the background decreased in elasticity. This is also demonstrated in the elasticity maps in Figure 5, in which one extreme case is shown at the highest motion level. Here, with an average Dice score of 0.57 over the three breath-holds, the ability to distinguish between all spherical inclusions and the background in the elasticity map has significantly decreased after motion. This effect is likely to be due to the background entering the region of the spherical inclusions as a result of the applied motion.Conclusion
In this work, through simulating different motion levels in a controlled phantom experiment, we have found that motion between different breath-hold acquisitions impacts the quantitative MRE measurements. This shows the importance of minimising the motion through careful patient preparation and consistent breath holds. This can be unfeasible, for instance, if a patient is unable to perform consistent breath holds due to illness. Therefore, technical solutions should be explored to take such motion into account in the MRE reconstruction, including the effects of nonlinear motion on the tissue, for improved MRE measurements and subsequent clinical diagnostics.Acknowledgements
This work was supported by the Medical Research Council [grant number MR/N018028/1], Perspectum, the Wellcome/EPSRC Centre for Medical Engineering [WT 203148/Z/16/Z] and the National Institute for Health Research (NIHR) Biomedical Research Centre at Guy’s and St. Thomas’ NHS Foundation Trust and King’s College London.References
1. Huwart L, Sempoux C, Vicaut E, Salameh N, Annet L, Danse E, Peeters F, ter Beek L C, Rahier J, Sinkus R, Horsmans Y, and Van Beers B E. Magnetic Resonance Elastography for the Noninvasive Staging of Liver Fibrosis. Gastroenterology. 2008;135(1):32–40.
2. Papiez B W, Franklin J M, Heinrich M P, Gleeson F V, Brady M and Schnabel J A. GIFTed Demons: deformable image registration with local structure-preserving regularization using supervoxels for liver applications. Journal of Medical Imaging. 2018;5(2):024001.
3. Cirs Inc., Norfolk, VA, USA
4. Rueckert R, Sonoda L I, Hayes C, Hill D L G, Leach M O, and Hawkes D J. Nonrigid registration using free-form deformations: application to breast MR images. IEEE Transactions on Medical Imaging. 1999;18(8):712–721.
5. Fovargue D, Kozerke S, Sinkus R and Nordsletten D. Robust MR elastography stiffness quantification using a localized divergence free finite element reconstruction. Medical Image Analysis. 2018,44:126–142.
Figures