1011
Preliminary MR elastography investigation on HIV+ cohort with cerebral small vessel disease1Department of ECE, University of Rochester, Rochester, NY, United States, 2Department of Radiology, Charité - Universitätsmedizin Berlin, Berlin, Germany, 3Department of Neurology, University of Rochester, Rochester, NY, United States
Synopsis
Neuroinflammation plays a crucial role in HIV-infected subjects at risk of cerebral small vessel disease. As MR-Elastography (MRE) has shown the potential to link inflammation with brain stiffness reduction, we investigated the brain viscoelastic properties of the HIV-infected and HIV-uninfected individuals. The preliminary results with MRE are promising, complementing other imaging modalities such as diffusion MRI (DTI, NODDI) to investigate brain microstructure integrity in HIV infection.
Introduction
Cerebral small vessel disease (CSVD) is a pathological condition defined by the presence of white matter hyperintensities, lacunes, enlarged perivascular spaces, microbleeds and brain atrophy. The pathological process involves small arteries, arterioles, capillary and venules1. The pathogenesis of CSVD is multifactorial and include chronic inflammation thus CSVD is common in elderly population but also in condition associate with neuroinflammation such as HIV infection2. MR Elastography (MRE) is a non-invasive approach that measures tissue stiffness and has recently demonstrated neuroinflammation to be associated with a reduction of brain stiffness in several disorders such as Multiple Sclerosis and animal models3,4. Here, we probe whether HIV infection is also associated with changes in brain viscoelastic properties via MRE. Specifically, the study reports preliminary findings of MRE along with Diffusion Tensor Imaging (DTI) and Neurite orientation dispersion and density imaging (NODDI) metrics.Materials & Methods
For this on-going study, after obtaining written informed consent according to the institutional protocol we scanned 7 HIV infected (HIV+) subjects (age=49±10.5years, range=31-61years, female=3) with no major cognitive impairment and 8 Healthy Control (HC) subjects (age=53.1±13.6years, range=22-66years, female=1). The imaging was carried out on a research dedicated Siemens MAGNETOM Prisma 3T whole-body scanner, equipped with a 64-channel head coil (receive-only) and body coil transmission. The protocol included T1-weighted images using a 3D MPRAGE sequence [inversion time (TI)=962ms, echo time/repetition time (TE/TR) =2.34ms/1840ms, 1mm isotropic resolution] for anatomical reference. Multifrequency MRE was performed using 20 and 25Hz frequencies with 8 wave dynamics and 3 motion-encoding gradients (MEG, amplitude= 34 mT/m, frequency=31.81Hz) directions (TE/TR=76ms/5100ms, 2mm isotropic resolution, GRAPPA factor 2). Multifrequency dual elasto visco (MDEV)5,6 inversion was used to calculate magnitude (|G*|, stiffness) and phase ($$$\phi$$$, tissue viscosity) of complex shear modulus. Additional dMRI scan was performed using 2D single-shot spin echo echo-planar imaging (SE-EPI) sequence (TR= 4300 ms; TE= 69.0 ms; ESP= 0.66 ms; 1.5 mm isotropic, 64 gradients per shell with b=1,000 and 2,000 s/mm2 with 7 b=0 s/mm2 reference images). Preprocessing included topup and eddy correction with FSL (v6.0.0/b1)7. Diffusion and advanced diffusion metrics were calculated with FSL dtifit and NODDI toolbox (v1.01)8 respectively. The Harvard-Oxford (subcortical grey matter GM) and JHU-ICBM (white matter WM and tracts) atlases were transformed to MRE native space using ANTs9 and used to calculate region averages in MRE native space for each participant and statistical comparison was done using corrected two sampled t-tests and p<0.05 was reported as significant.Results & Discussion
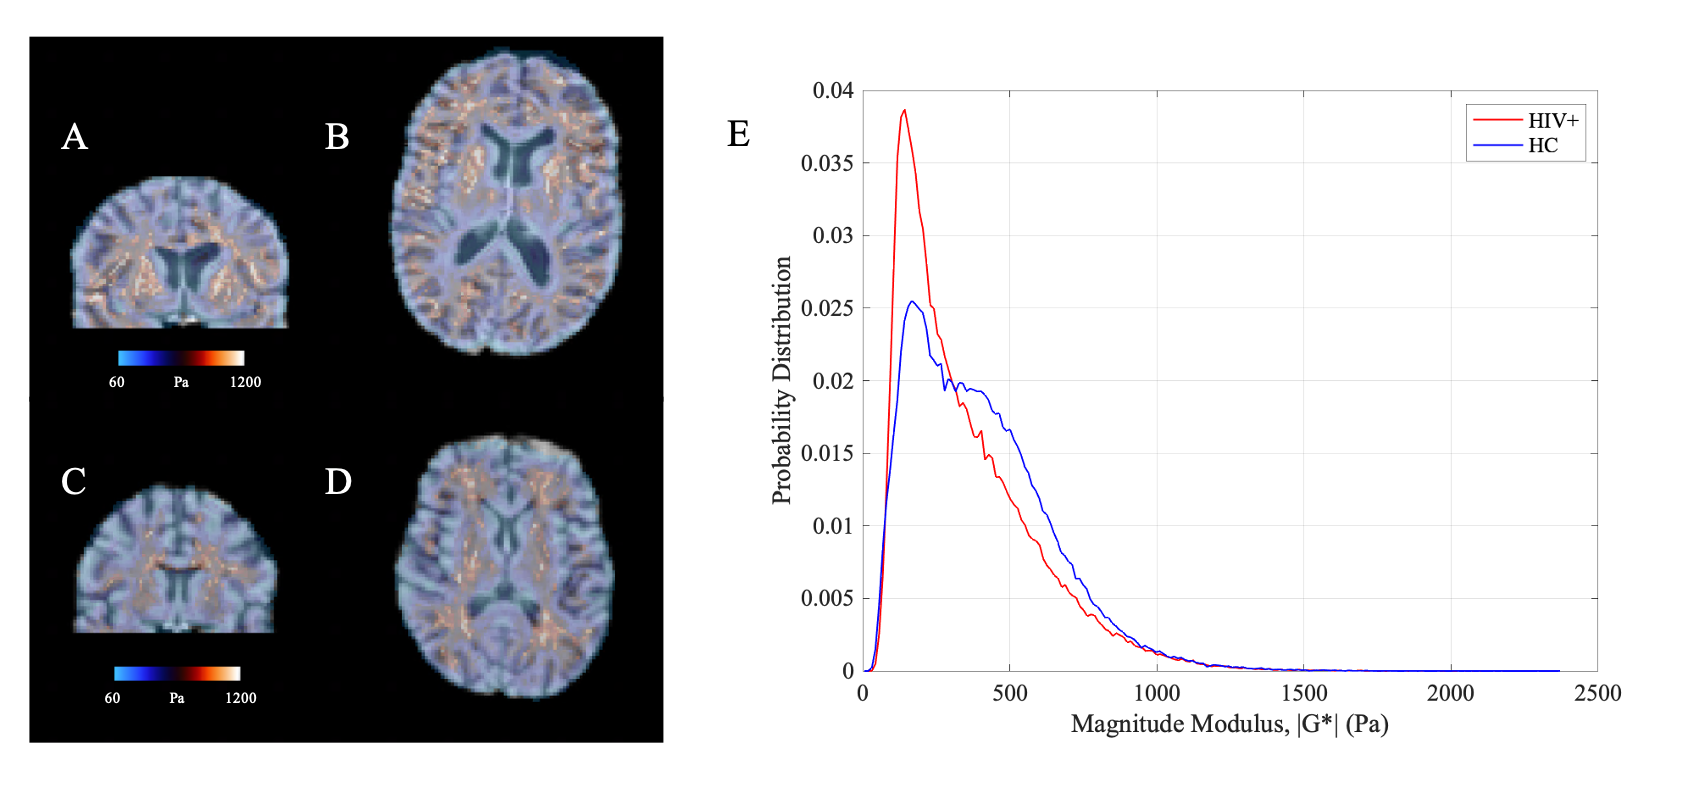
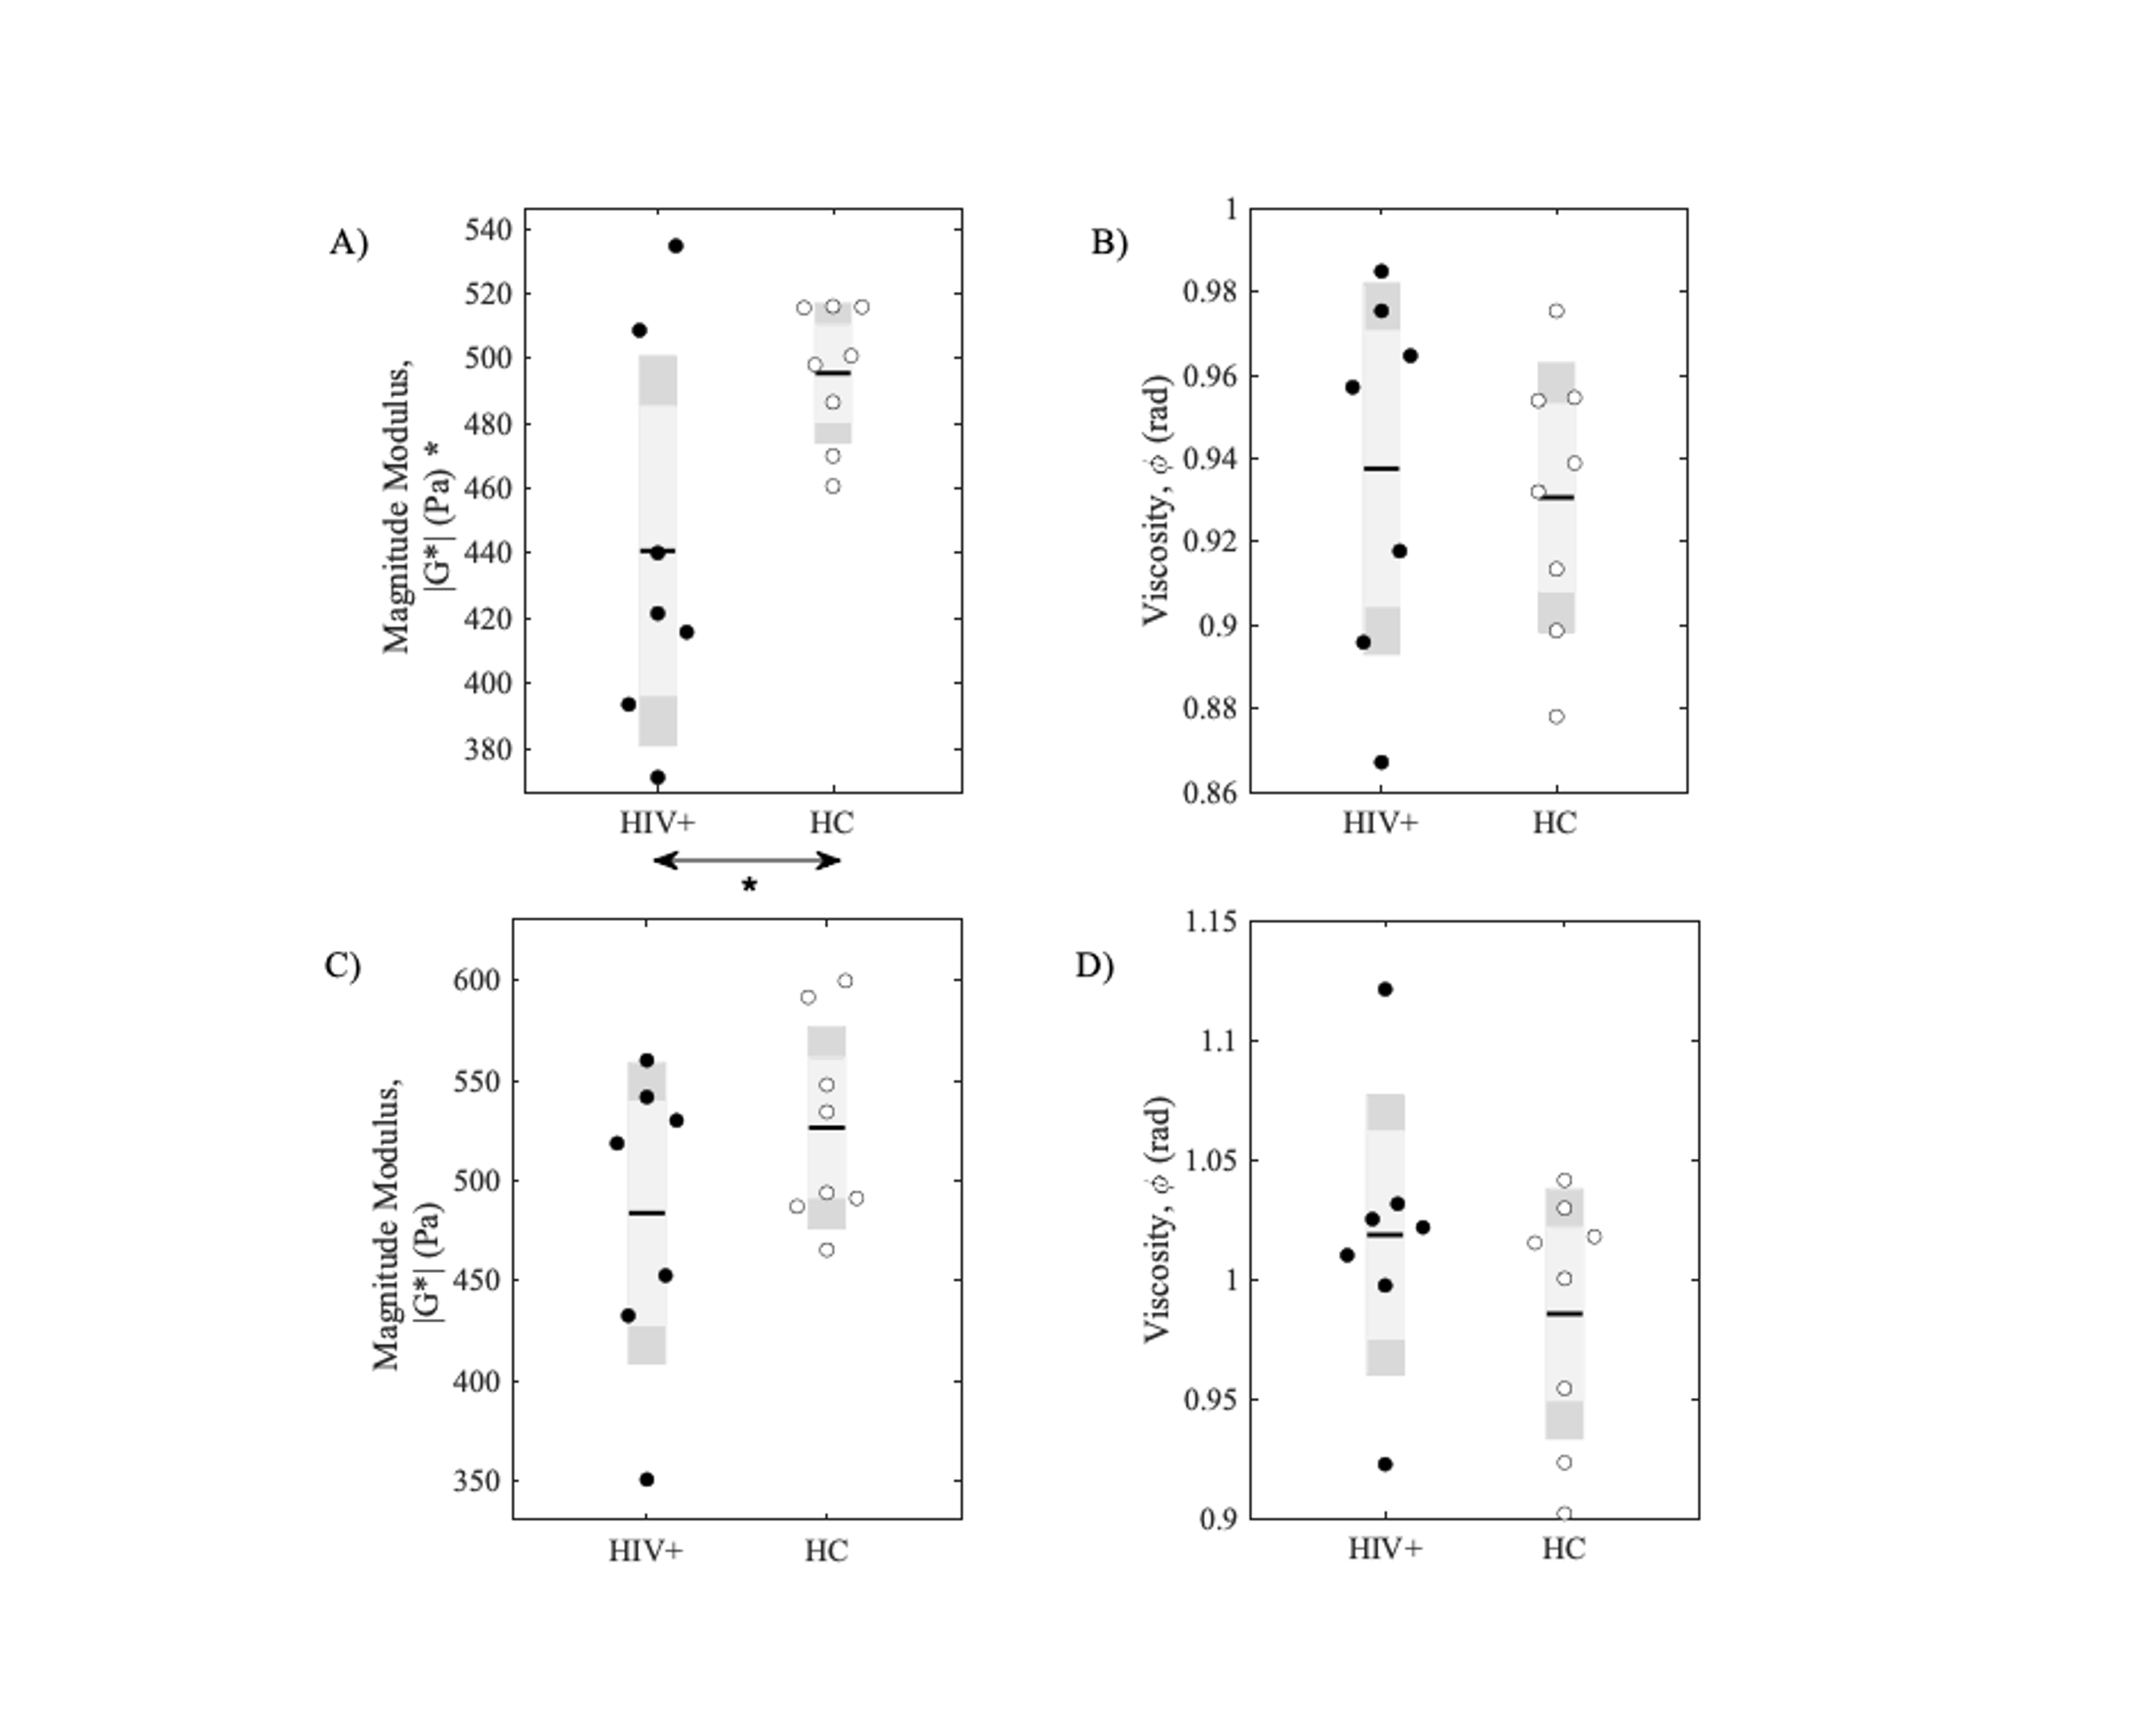
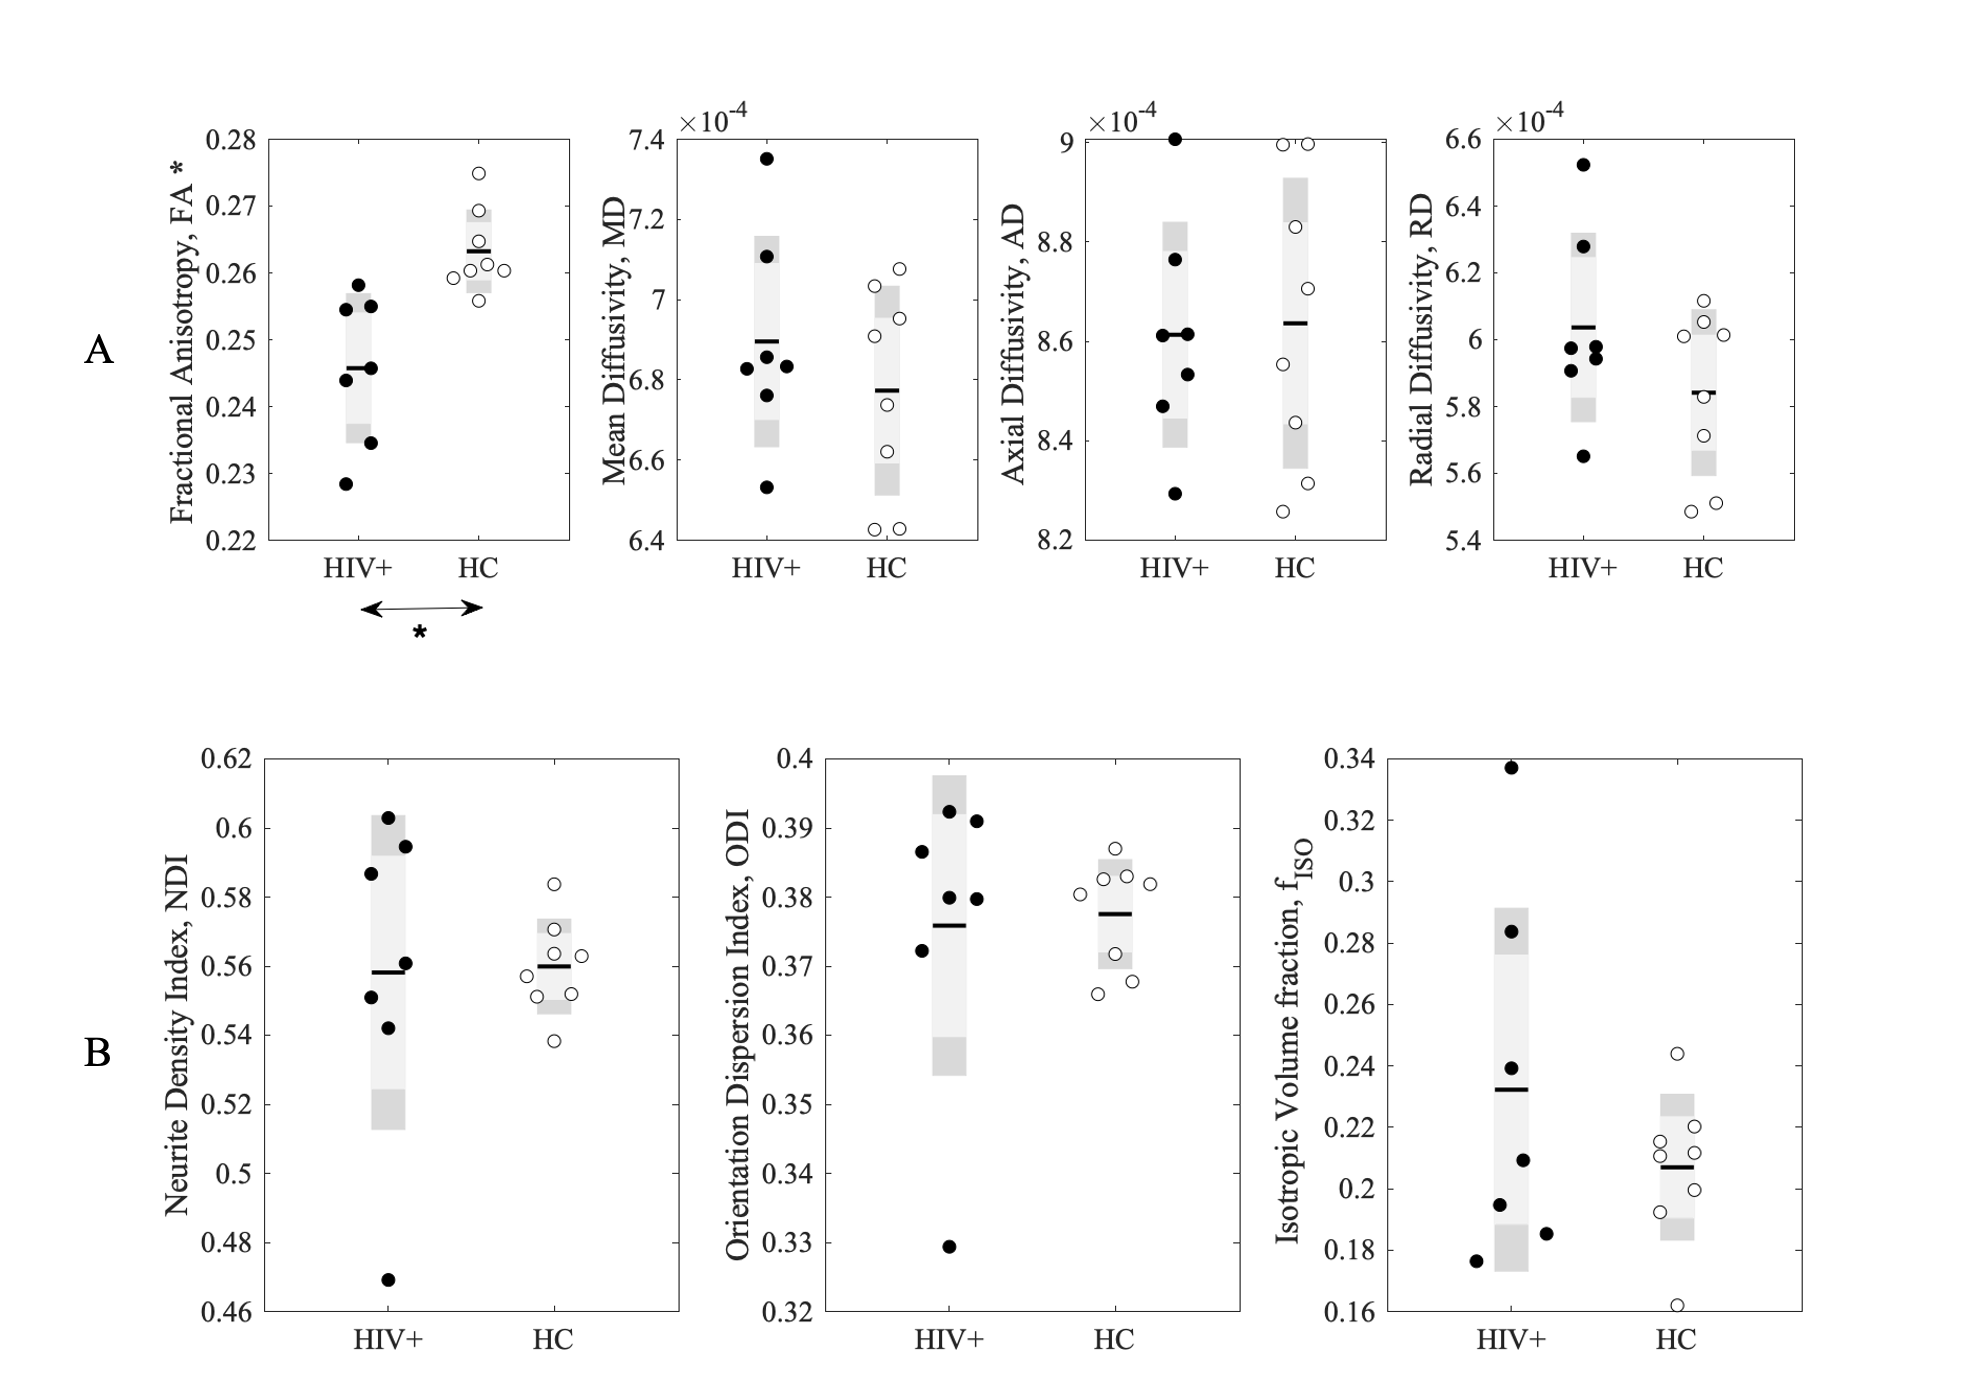
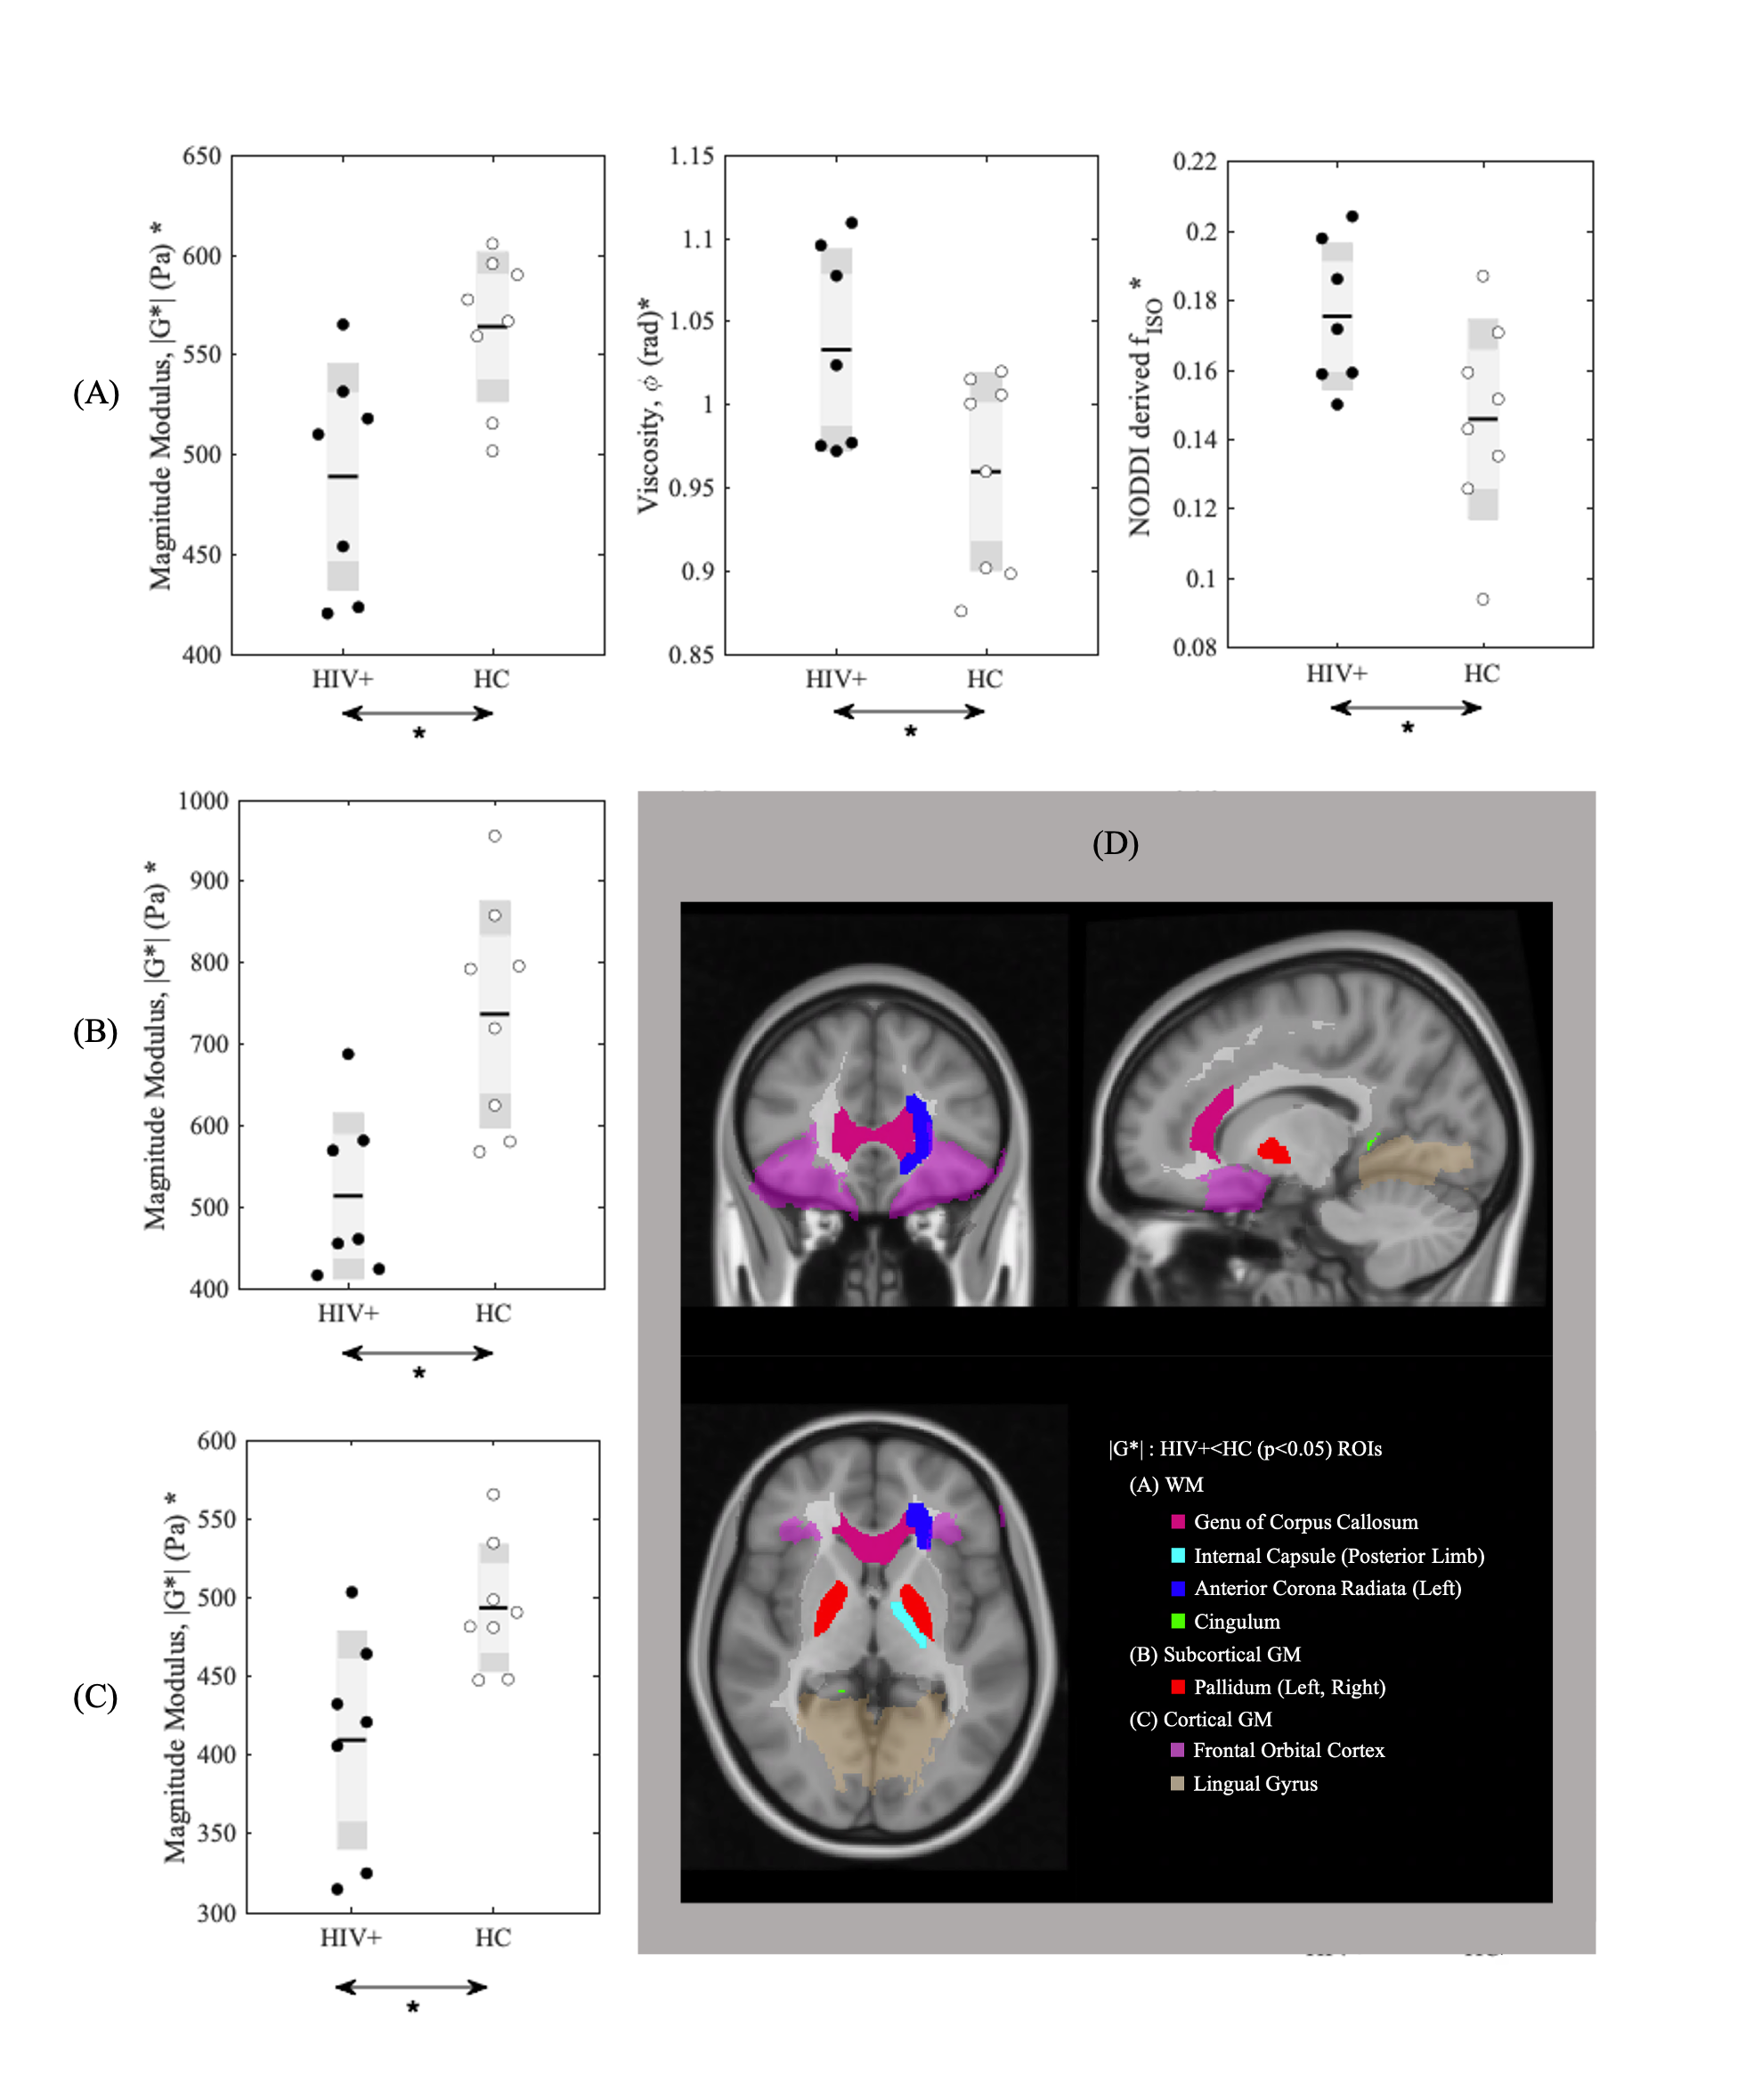
Figure 1 shows example of stiffness (|G*|) maps for a HC and HIV subject with respective probability histograms indicating the probability of reduced tissue stiffness is higher for the whole brain in HIV+ subject, thereby suggesting overall reduced integrity of the neuronal network in the HIV+ participant. When the GM and WM stiffness were investigated separately for |G*|, we found significant changes in the whole GM stiffness in HIV+ cohort (Figure 2A). Although same trend followed with WM, it wasn’t significant on global terms (Figure 2C). Tissue viscosity ($$$\phi$$$) was unchanged in both global cases. DTI and NODDI metrics were evaluated for the same group and no difference were observed for WM. Same trend followed for GM except for Fractional Anisotropy (FA) (Figure 3). Further probing with WM and GM regions of interests (ROIs), we identified several significant ROIs for stiffness change e.g., Genu of Corpus Callosum, Internal Capsule (posterior limb), Anterior Corona Radiata (Left), Cingulum, Pallidum (Left and Right), Frontal Orbital Cortex, Lingual Gyrus (Figure 4D). These changes in stiffness are possibly an indication of altered blood brain barrier3 following the existing known role of neuroinflammation in HIV. We also found prominent viscoelastic change with increasing fISO in WM ROIs (Figure-4A); and the increasing fISO previously showed to correlate with plasma levels of markers linked with neuroinflammation in HIV10. Figure-4B,C shows stiffness reduction in Subcortical and Cortical GM, which was undetected using diffusion measures. The preliminary results illustrated with MRE are promising, complementing other imaging modalities such as NODDI to investigate brain microstructure integrity in HIV infection.Conclusion
The study demonstrates MRE could be a useful imaging approach to quantify and monitor HIV-associated brain injury.Acknowledgements
This work was supported by the National Institutes of Health (Grant Numbers: R01 AG054328, and R21 NS113674). We would also like to thank Kyle D. Murray for the early works related to CSVD in HIV.References
1. Li Q, Yang Y, Reis C, Tao T, Li W, Li X, et al. Cerebral small vessel disease. Cell transplantation 2018; 27(12):1711-1722.
2. Ellis R, Letendre SL. Update and new directions in therapeutics for neurological complications of HIV infections. Neurotherapeutics 2016; 13(3):471-476.
3. Wang S, Millward JM, Hanke-Vela L, Malla B, Pilch K, Gil-Infante A, et al. MR elastography-based assessment of matrix remodeling at lesion sites associated with clinical severity in a model of multiple sclerosis. Frontiers in Neurology 2020; 10:1382.
4. Millward JM, Guo J, Berndt D, Braun J, Sack I, Infante‐Duarte C. Tissue structure and inflammatory processes shape viscoelastic properties of the mouse brain. NMR in Biomedicine 2015; 28(7):831-839.
5. Streitberger K-J, Reiss-Zimmermann M, Freimann FB, Bayerl S, Guo J, Arlt F, et al. High-resolution mechanical imaging of glioblastoma by multifrequency magnetic resonance elastography. PloS one 2014; 9(10):e110588.
6. Hirsch S, Guo J, Reiter R, Papazoglou S, Kroencke T, Braun J, et al. MR elastography of the liver and the spleen using a piezoelectric driver, single‐shot wave‐field acquisition, and multifrequency dual parameter reconstruction. Magnetic resonance in medicine 2014; 71(1):267-277.
7. Woolrich MW, Jbabdi S, Patenaude B, Chappell M, Makni S, Behrens T, et al. Bayesian analysis of neuroimaging data in FSL. Neuroimage 2009; 45(1):S173-S186.
8. Zhang H, Schneider T, Wheeler-Kingshott CA, Alexander DC. NODDI: practical in vivo neurite orientation dispersion and density imaging of the human brain. Neuroimage 2012; 61(4):1000-1016.
9. Avants BB, Tustison NJ, Song G, Cook PA, Klein A, Gee JC. A reproducible evaluation of ANTs similarity metric performance in brain image registration. Neuroimage 2011; 54(3):2033-2044.
10. Uddin MN, Faiyaz A, Zhuang Y, Tivarus M, Zhong J, Descoteaux M, et al. Relationship between Free Water and Neuroinflammation/Neurodegeneration Markers in HIV Before and After Combination Antiretroviral Therapy. ISMRM 2020:1538.
Figures