1010
Estimating Aortic Stiffness Using Aortic MR Elastography Using an Inversion without Considering the Geometry1Radiology, The Ohio State University Wexner Medical Center, Columbus, OH, United States
Synopsis
Aortic stiffness is a valuable imaging marker because of its association with a variety of cardiovascular conditions such as abdominal aortic aneurysm (AAA). Calculating AAA stiffness from aortic MRE data presents a unique challenge due to the relatively small size of an AAA compared to the liver. In the present study, we propose a new inversion strategy that consists of directional filters that are designed to extract the propagating waves along the axial direction of the AAA, and uses the wave information along the axial direction for stiffness calculation to reduce the impact of AAA geometry on stiffness estimation.
Introduction
Calculating aortic stiffness from aortic MRE data presents a unique challenge. Compared to the liver, aortic MRE is performed on an organ that has considerably smaller width (diameter), which may affect the stiffness calculation when using 2D or 3D inversion techniques because (1) the spatial wavelength can exceed the width of the aorta, and (2) the transition between the aorta and the background (i.e., edge effect) can generate biased stiffness [1].In the present study, we propose a new post-processing routine that aims to reduce the geometry-dependency when estimating aortic stiffness. The proposed method consists of a pair of directional filters designed to obtain the propagating waves along the axial direction of the aorta (or AAA), and then uses the wave information for stiffness calculation to reduce the impact of AAA diameter on stiffness estimation.
Methods
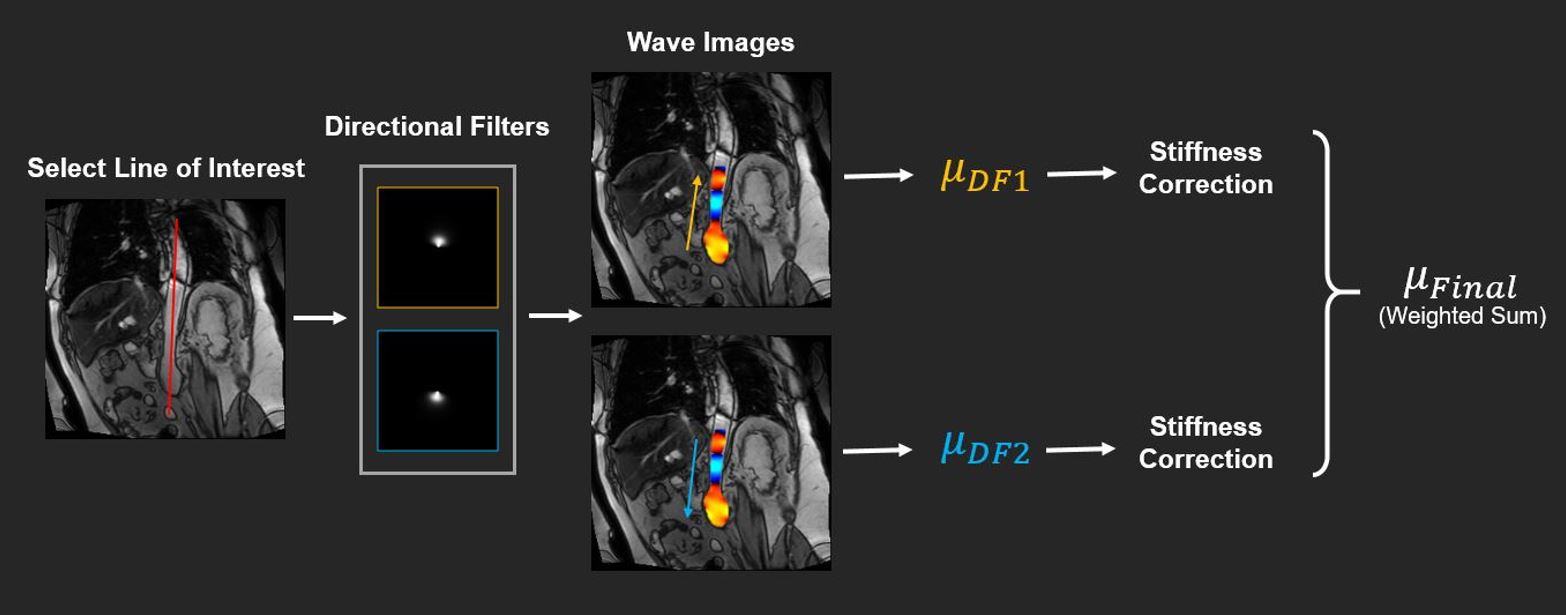
Figure 1 describes the components of the proposed inversion method. First, a line of interest (LOI) was determined along which the aortic stiffness was derived. From the LOI, the orientation of the aorta was obtained. A pair of directional filters were designed to extract the wave information along the axial direction of the aorta [2]. Specifically, waves propagating in the positive and negative directions along the axial of the aorta were extracted and used to estimate the stiffness. Next, an 1D local frequency estimation (LFE) algorithm was performed on the filtered 1D wave data to derive aortic stiffness from these two directions. Based on the observed stiffness and the length of the aorta, stiffness correction was then performed on the 1D stiffness maps to reduce stiffness bias [3]. Finally, the corrected stiffness from both directions was combined to report a weighted sum. The weighing was based on the first-harmonic amplitude from each direction [4].For the 1D LFE algorithm used in this study, a bank of 11 lognormal filter sets spaced two-thirds octave apart were used rather than the widely-employed 6 filter sets spaced an octave apart. This choice increased the robustness to noise of the algorithm without significant loss of spatial resolution [5, 6].
Additionally, underestimation in stiffness due to variation in AAA length was further investigated in simulated AAAs with 18 different lengths ranging from 3 cm to 11 cm (step size=0.5 cm). For each length, 11 stiffness values ranging from 5 kPa to 105 kPa (step size=10 kPa) were assigned to the AAAs.
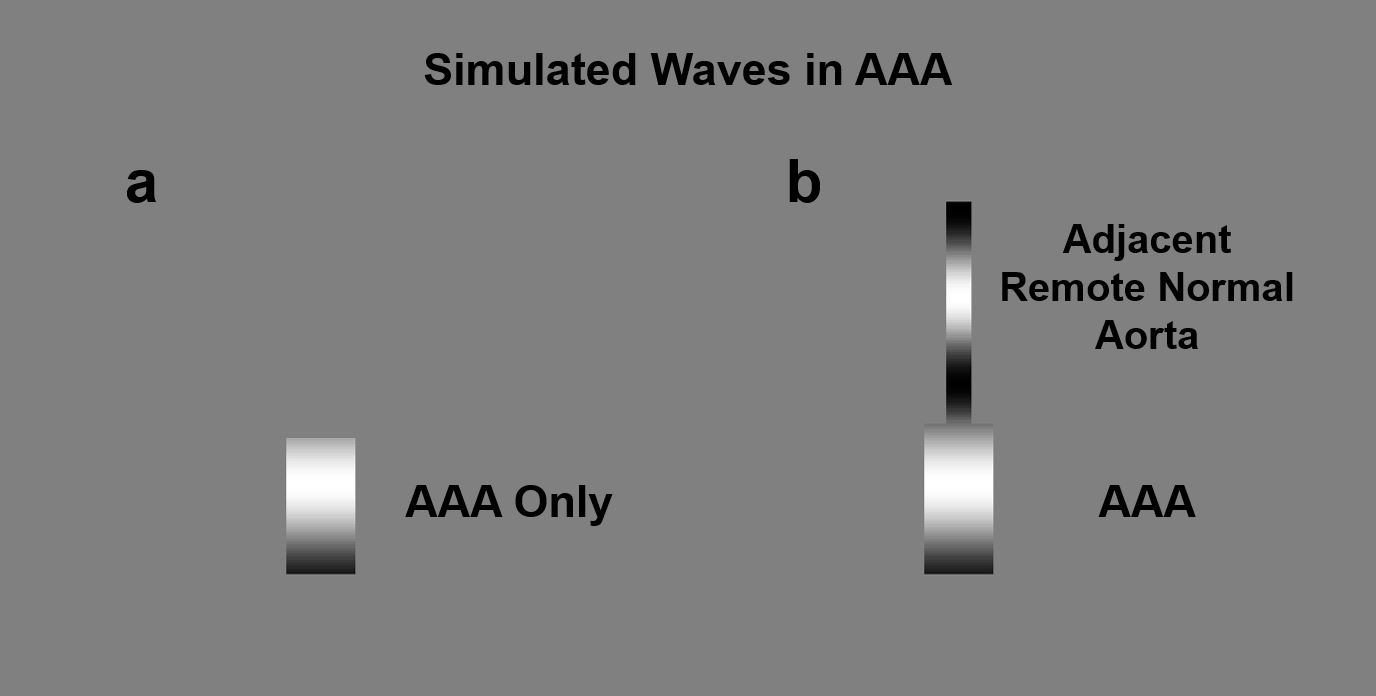
Moreover, two scenarios were studied (Figure 2). In the first scenario, AAAs does not have an adjacent remote normal aorta. This scenario emulates the aortic MRE data in which the remote normal aorta is not visible. In the second scenario, AAAs were attached a remote normal aorta with stiffness of 45 kPa. This scenario resembles the aortic MRE data where both the remote normal aorta and AAA are visible within one slice. Both scenarios are frequently observed in aortic MRE due to different slice planning.
The measured AAA stiffness prior to the correction was compared to the simulated stiffness (i.e., the ground truth). The following variables were defined:
Normalized Stiffness=Simulated Stiffness/Measured Stiffness
Normalized Wavelength=Measured Wavelength/AAA Length
Subsequently, a 4th-order polynomial fit was performed between the normalized stiffness and the normalized wavelength to obtain mappings for correcting the bias in stiffness estimation.
The proposed 1D LFE approach and the correction scheme were validated in (1) another set of simulated AAAs with different stiffness values and lengths, and in (2) two healthy subjects and four AAA patients. In vivo aortic MRE was performed on a 3T scanner (Tim Trio, Siemens Healthcare, Erlangen, Germany) using a rapid GRE MRE sequence [7].
Imaging parameters included: TE=21.25 ms, TR=25 ms. FOV= 400x400 mm2; reconstruction matrix size=256x256; slice thickness=6 mm; external mechanical excitation frequency=60 Hz; no. of MRE phase offsets=4. A 60-Hz flow-compensated motion-encoding gradient (MEG) was applied.
Results and Discussion
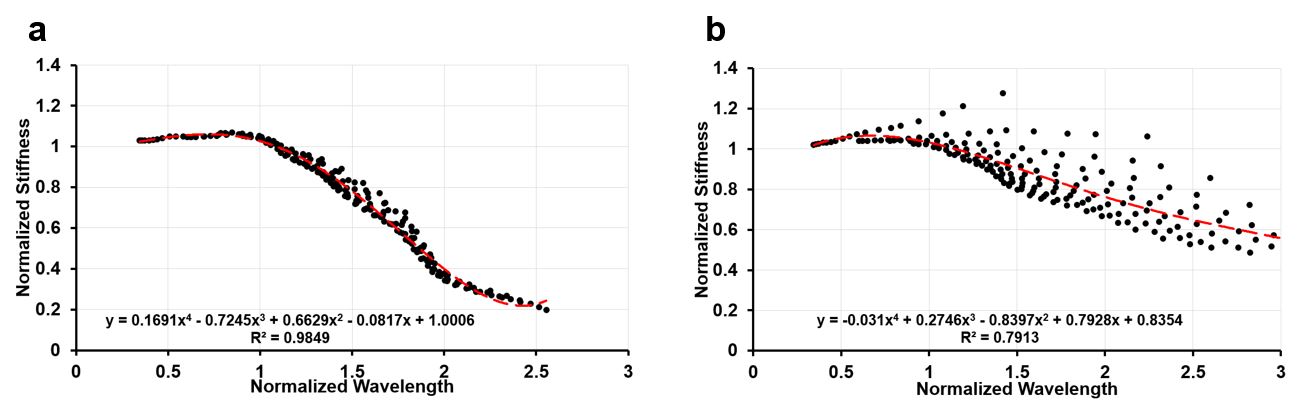
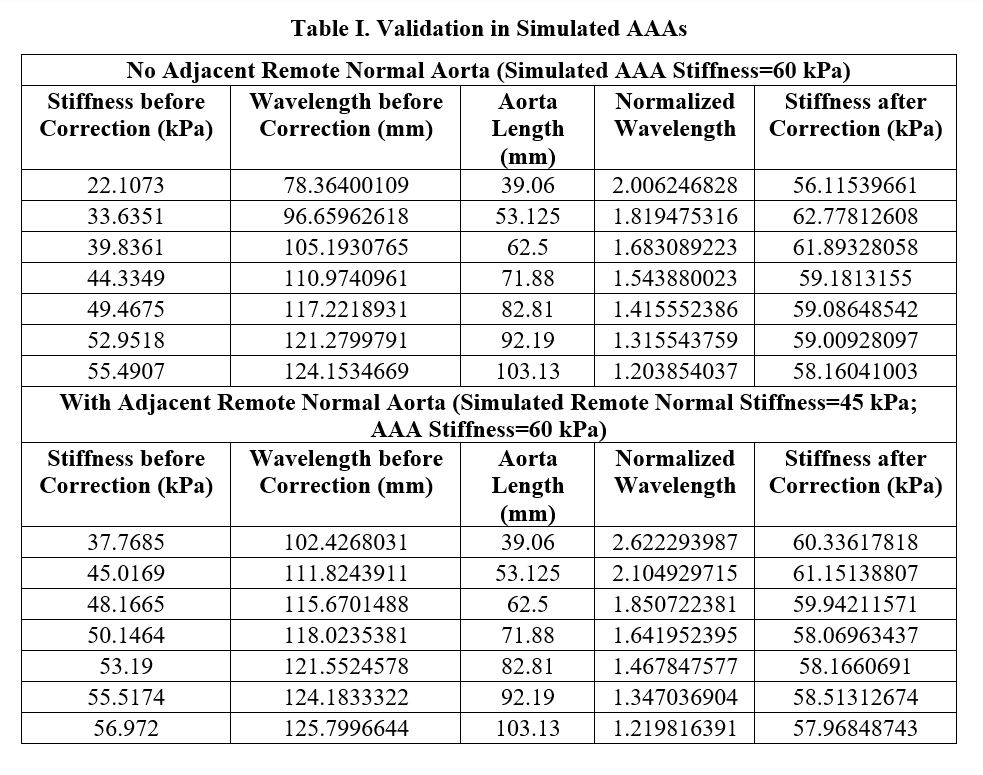
Figure 3 demonstrates the polynomial fits to correct for stiffness underestimation caused by AAA length alone (Figure 3a) as well as by a combination of AAA length and the neighboring remote normal aorta (Figure 3b). For a given AAA length and (apparent) measured stiffness, the true stiffness can be recovered using the polynomial fits as shown in the figure.Table I summarizes the validation of the proposed technique in another set of AAAs. The simulated stiffness for remote normal aorta and AAA was 45 kPa and 60 kPa, respectively. Underestimation was observed prior to correction, and was effectively reduced after correction.
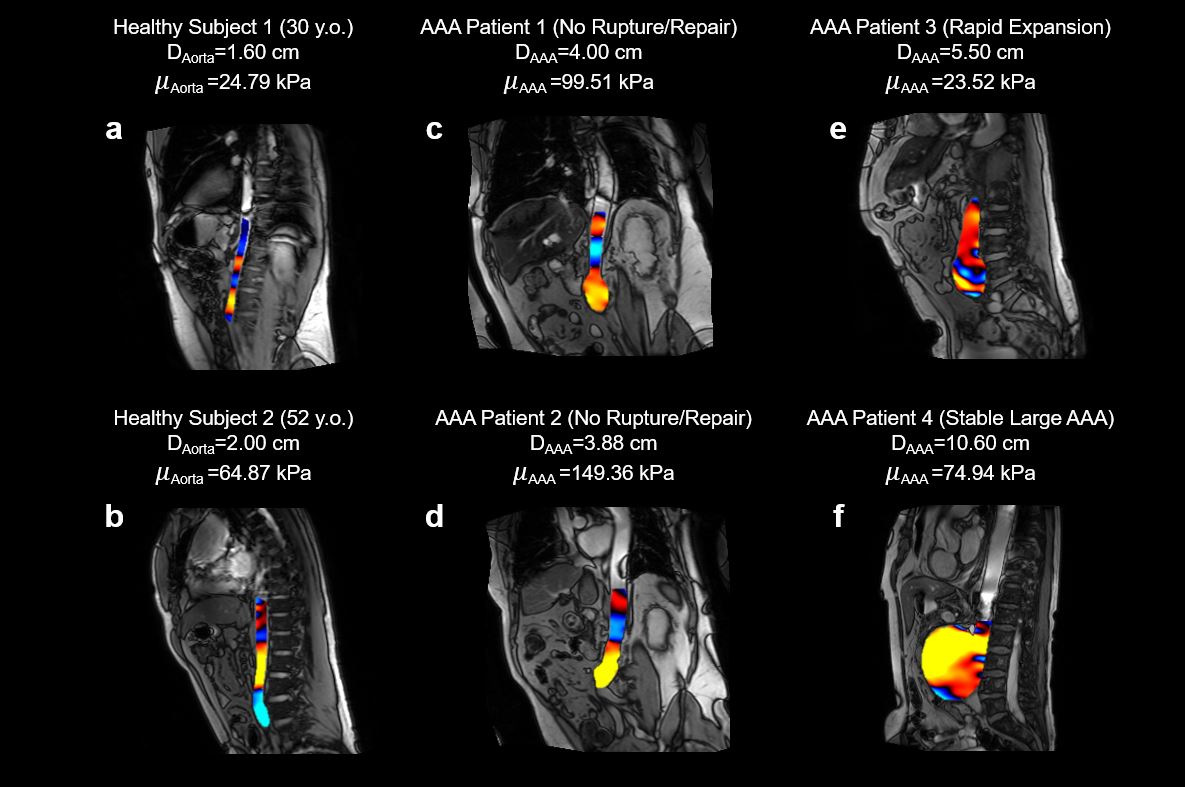
Applying the proposed inversion, Figure 4 demonstrates the MRE-derived aortic stiffness and the corresponding spatial wavelength in healthy subjects and AAA patients. Higher aortic stiffness and longer wavelength was observed in the elderly healthy subject when compared to the young healthy subject (Figure 4a and b). In patients with small or stable AAAs (Figure 4c, d and f), the spatial wavelength within the aneurysm was longer than that in the patient who has rapidly growing AAA (Figure 4e). Correspondingly, the AAA stiffness was higher in Patient 1, 2 and 3 than that in Patient 4.
Conclusion
In this study, a new inversion strategy was proposed to reduce the impact of geometry on aortic stiffness estimation. Preliminary investigation suggested feasibility of this post-processing approach for aortic MRE.Acknowledgements
No acknowledgement found.References
1. Murphy MC, Huston J, Jack CR, et al. Measuring the Characteristic Topography of Brain Stiffness with Magnetic Resonance Elastography. Barnes GR, ed. PLoS One. 2013;8(12):e81668. doi:10.1371/journal.pone.0081668
2. Manduca A, Lake DS, Kruse SA, Ehman RL. Spatio-temporal directional filtering for improved inversion of MR elastography images. Med Image Anal. 2003;7(4):465-473. doi:10.1016/S1361-8415(03)00038-0
3. Kolipaka A, McGee KP, Araoz PA, et al. MR elastography as a method for the assessment of myocardial stiffness: Comparison with an established pressure-volume model in a left ventricular model of the heart. Magn Reson Med. 2009;62(1):135-140.
4. Manduca A, Muthupillai R, Rossman PJ, Greenleaf JF, Ehman RL. Local wavelength estimation for magnetic resonance elastography. In: Proceedings of 3rd IEEE International Conference on Image Processing. Vol 3. IEEE; 1996:527-530. doi:10.1109/ICIP.1996.560548
5. Manduca A, Dutt V, Borup DT, Muthupillai R, Greenleaf JF, Ehman RL. Inverse approach to the calculation of elasticity maps for magnetic resonance elastography. In: Hanson KM, ed. SPIE, Medical Imaging. San Deigo, CA; 1998:426-436.
6. Dong H, Mazumder R, Illapani VSP, Mo X, White RD, Kolipaka A. In vivo quantification of aortic stiffness using MR elastography in hypertensive porcine model. Magn Reson Med. 2017;78(6):2315-2321.
7. Chamarthi SK, Raterman B, Mazumder R, et al. Rapid acquisition technique for MR elastography of the liver. Magn Reson Imaging. 2014;32(6):679-683.
Figures