1008
Assessment of Shear Strain in Intervertebral Discs In Vivo with Magnetic Resonance Elastography1Radiology, Mayo Clinic, Rochester, MN, United States, 2Siemens Healthcare GmbH, Erlangen, Germany, 3Siemens Medical Solutions USA, Inc., Salt Lake City, UT, United States
Synopsis
This study is to test the feasibility of visualizing waves propagating in the spine and measuring the strain in the intervertebral discs (IVDs) in vivo with Magnetic Resonance Elastography (MRE). Our results show that waves can be visualized, and that IVD shear strain can be quantitatively assessed. Degeneration of the IVD is thought to decrease disc shear stiffness. Preliminary results in a series of volunteers demonstrated increasing IVD shear strain with age, consistent with the known gradual degradation of IVD function with age.
Introduction
Degeneration of individual intervertebral discs (IVD) is associated with low-back pain, which is the most common cause of disability in the United States1. In disc degeneration, water content in the nucleus decreases, resulting in a decrease in the transverse shear stiffness across the disc space2,3. We have applied techniques used for MR elastography, allowing detection of microscopic shear motion, to quantitatively assess shear strain generated at the disk space resulting from applied dynamic shear strain. The goal is to develop a practical non-invasive method for quantitatively assessing the mechanical integrity of IVD’s and to detect early disk degeneration. Previous preliminary MRE work, in tissue specimens or in vivo, and using different MRE-based methods, had provided promising results2-10. The goal of this study was to take the next steps in developing and testing a practical rapid protocol for assessing the shear properties of multiple IVD’s in the lumber and lower thoracic spine and to test the hypothesis that the known gradual effects of age on IVD function will be observable.Methods
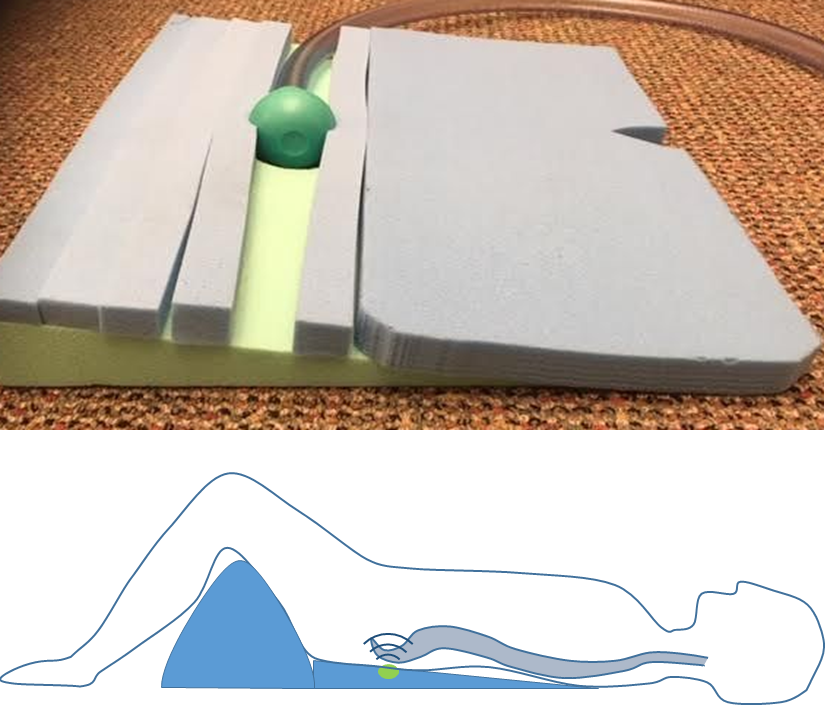
This study was approved by the Institutional Review Board, and informed consent was obtained from all volunteers. Five volunteers (2 males, 3 females, age 25-62) were recruited for the study. The imaging protocol includes: (1) 3-plane localizer; (2) T2 weighted fast spin-echo Dixon exam; and (3) spin-echo MRE. Figure 1 shows the customized spine driver used in this study and the setup for the volunteer test. A prototype spherical driver was placed under the sacrum of the volunteer, inducing cyclic motion that propagated upward along the spine.Spine MRE images were acquired on a clinical 3T scanner (MAGNETOM Prisma, Siemens Healthcare, Erlangen, Germany) with spine24 phase array coil. A prototype spin-echo MRE sequence was developed for this spine MRE study with the motion sensitizing gradient in the anterior-posterior direction. One sagittal image was acquired at the center of the spine (as shown in Figure 2) for each volunteer with a slice thickness of 10mm. FOV = 400x200mm2-400x275mm2 based on the volunteer’s size. TR/TE=500ms/45ms. Motion frequency was 60Hz. Eight phase offsets were acquired. One motion encoding gradient cycle was used with gradient amplitude of 76mT/m. Fractional motion encoding was used with the fraction of 90%. The GRAPPA factor was 3. Total scan time for the MRE was about 5 minutes.
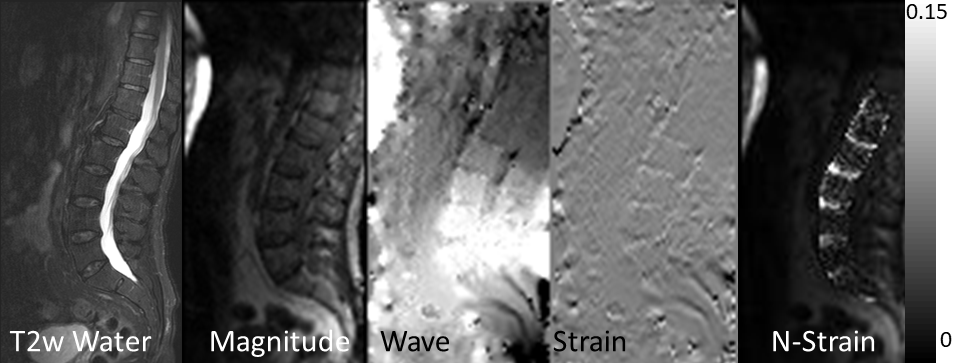
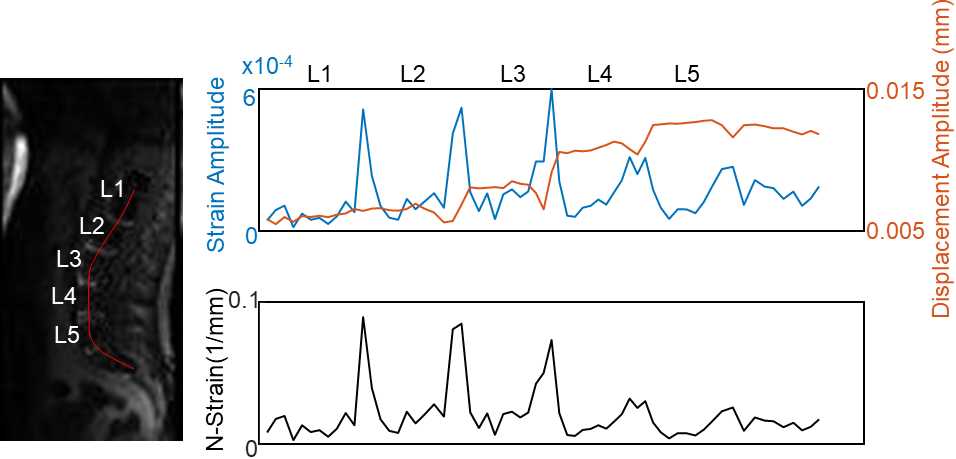
In the magnitude image, an ROI was drawn around the lumbar spine sections. Displacement and strain were calculated for each phase offsets. The strain was estimated as the 1st derivative of displacement along the head-foot direction. Normalized strain (N-strain) was obtained by dividing the strain amplitude with the displacement amplitude. The resultant N-strain was plotted both as maps inside the spine ROI, and as 1D profile along the center of the spine.
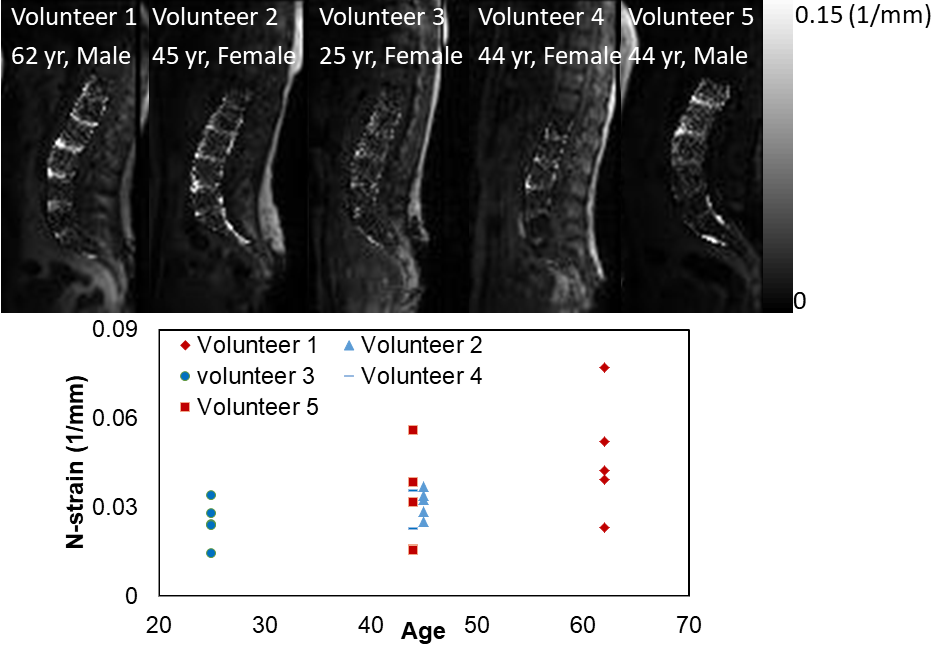
In addition, individual ROIs were drawn for each lumbar IVD, and the N-strain was plotted against the volunteer’s age.
Results
Figure 2 shows the T2-weighted image, a magnitude and phase difference image (phase offset 1) of MRE, a strain image (phase offset 1), and an N-strain map from one of the volunteers. The IVDs are clearly visible in the N-strain map with increased N-strain.Figure 3 shows the displacement amplitude, strain amplitude and N-strain along the center of the spine as 1D profiles. It shows clearly that the displacement amplitude decreased in the IVDs compared with the vertebrae. From the N-strain maps of all the five volunteers it appears that the N-strain values are higher in some of the IVDs in the older volunteers (Figure 4).
Conclusions
This preliminary study demonstrates that adequate cycle shear motion can be generated in the spine with a localized driver. Localized shear strain at the IVD’s can be visualized and showed values that increased with age. With this practical protocol in place, the next step is to test whether the technique can be used to quantitatively assess IVD integrity in subjects with known focal IVD degeneration.Acknowledgements
This work was supported by grant from National Institutes of Health R01 EB001981.References
1. Andersson, G. B. Lancet. 1999;354(9178):581-5. Epub 1999/09/02.
2. Streitberger, K. J., et al. Magn Reson Med. 2015;74(5):1380-7. Epub 2014/11/02.
3. Cortes, D. H., et al. Magn Reson Med. 2014;72(1):211-9. Epub 2013/08/02.
4. Beauchemin, P. F., et al. NMR Biomed. 2018;31(10):e3918. Epub 2018/05/05.
5. Ben-Abraham, E. I., et al. Magn Reson Imaging. 2017;39:132-7. Epub 2016/01/09.
6. Iatridis, J. C., et al. J Orthop Res. 1999;17(5):732-7. Epub 1999/11/24.
7. Iatridis, J. C., et al. J Orthop Res. 1997;15(2):318-22. Epub 1997/03/01.
8. Walter, B. A., et al. Radiology. 2017;285(1):167-75. Epub 2017/05/05.
9. Muthupillai, R., et al. Science. 1995;269(5232):1854-7. Epub 1995/09/29.
10.Ben-Abraham, E. I., et al. International Society for Magnetic Resonance in Medicine (ISMRM) 23th Annual Meeting and Exhibition; May 30 - Jun 5; Toronto.
Figures