1007
Anisotropic stiffness of the supraspinatus muscle estimated via MR elastography and transversely isotropic nonlinear inversion.1Mechanical Engineering, Université de Sherbroke, Sherbrooke, QC, Canada, 2Centre de recherche du Centre hospitalier de l’Université de Montréal, Montréal, QC, Canada, 3Université de Montréal, Montréal, QC, Canada, 4Department of Radiology, Centre hospitalier de l’Université de Montréal, Montréal, QC, Canada, 5Thayer School of Engineering, Dartmouth College, Hanover, NH, United States, 6Department of Mechanical Engineering & Materials Science, Washington University in St. Louis, St. Louis, MO, United States, 7Dartmouth-Hitchcock Medical Center, Lebanon, NH, United States, 8Department of Biomedical Engineering, University of Delaware, Newark, DE, United States
Synopsis
Surgical planning for rotator cuff repair would benefit significantly from quantitative measures of the muscle stiffness to avoid re-tearing of the muscle after surgery. MR Elastography (MRE) can provide quantitative measures of soft tissue stiffness in-vivo, but repeatable, stable results require accurate tissue models capable of treating the specific geometry and highly anisotropic structure of muscle tissue. Here, MRE based on a nearly incompressible, transversely isotropic continuum model is developed and applied to the case of the supraspinatus muscle. Overall, results show good agreement between reconstructed anisotropic stiffness values and independently published results based on wavelength analysis.
INTRODUCTION:
Rotator cuff tears lead to atrophy and stiffening, which can in turn lead to post-surgical re-tearing if these factors are not correctly accounted for in the surgical plan [1,2]. MR Elastography (MRE) provides quantitative imaging of soft tissue stiffness, and therefore the means to better inform surgical planning. The challenge of applying MRE to muscle is the highly anisotropic nature of the tissue [3], given that isotropic material models have been shown to introduce variance in MRE results when applied to anisotropic tissues such as white matter tracts in the brain [4]. Here, a newly developed nearly incompressible transverse isotropy material model has been implemented within a Non-Linear Inversion (NLI) MRE post-processing method [5,6]. Combined with Diffusion Tensor Imaging (DTI) data to estimate the distribution of the muscle fiber orientations [7], this method permits the estimation of elastic stiffness within the supraspinatus muscle of the rotator cuff with physiologically realistic models, thus avoiding the model-data mismatch artefacts that can affect measurement repeatability [8].METHODS:
The shoulder was scanned on a 3T Siemens Skyra system. MRE data were collected using a Resoundant actuator at 100Hz and encoding gradient amplitude at 21mT/m in a spin echo EPI sequence with the following imaging parameters [9]: FOV = 162 × 318 mm2; matrix = 54 × 106; 30 slices, 3 mm thick slices; TR/TE = 3300/40 ms; BW=2245 Hz, GRAPPA R = 3; final resolution = 3 × 3 × 3 mm3. DTI data with resolution and FOV matched to the MRE scans were also acquired with the following imaging parameters: b=0s/mm² (2 averages); 12 diffusion-encoding gradients at b=500 s/mm² (2 averages); b=800 s/mm² (4 averages); TR/TE = 5800/57ms. The supraspinatus was segmented from T1 vibe DIXON (TR/TE = 5.76/2.46ms, voxel = 1 x 1 x 1mm3 and FOV = 320 X 320 X 320) and rigidly coregistered with MrTrix3 [10]. MRE data was evaluated to determine the Octahedral Shear Strain Signal to Noise Ratio (OSS-SNR) [11], and then treated by the NLI-MRE subzone post-processing method formulated with a finite element based nearly incompressible transverse isotropic material model, where the axis of symmetry was rotated to align with the primary fiber axes based on DTI data. The constitutive equation for this material is given by: $$\left\{\array{\sigma_{11}\\\sigma_{22}\\\sigma_{33}\\\sigma_{12}\\\sigma_{23}\\\sigma_{13}}\right\}=\left[\array{c_{11}&c_{12}&c_{13}&0&0&0\\c_{21}&c_{22}&c_{23}&0&0&0\\c_{31}&c_{32}&c_{33}&0&0&0\\0&0&0&c_{44}&0&0\\0&0&0&0&c_{55}&0\\0&0&0&0&0&c_{66}}\right]\left\{\array{\epsilon_{11}\\\epsilon_{22}\\\epsilon_{33}\\2\epsilon_{12}\\2\epsilon_{23}\\2\epsilon_{13}}\right\},$$ with the components of the 6x6 elasticity matrix,$$$\left[C\right]$$$, given by $$\array{c_{11}=\kappa+\frac{4}{3}\mu\left(1+\frac{4}{3}\zeta\right),&c_{22}=c_{33}=\kappa+\frac{4}{3}\mu\left(1+\frac{1}{3}\zeta\right),&c_{44}=c_{66}=\mu\left(1+\phi\right)\\c_{12}=c_{13}=c_{21}=c_{31}=\kappa-\frac{2}{3}\mu\left(1+\frac{4}{3}\zeta\right),&c_{32}=c_{23}=\kappa-\frac{2}{3}\mu\left(1-\frac{2}{3}\zeta\right),&c_{55}=\mu}$$ where $$$\mu$$$ is the shear modulus in the plane normal to the fiber axis, $$$\phi=\frac{\mu_{ax}}{\mu_{tr}}-1$$$ is the shear anisotropy, $$$\zeta=\frac{E_{ax}}{E_{tr}}-1$$$ is the tensile anisotropy, and $$$\kappa$$$ is the isotropic bulk modulus. From above, it can be seen that the two axial shear moduli, $$$\mu_{ax}$$$, corresponding to shearing along the fiber direction, are given by $$$c_{44}$$$ and $$$c_{66}$$$ while the transverse shear modulus, $$$\mu_{tr}$$$, corresponding to shearing around the fiber axis, is given by $$$c_{55}$$$. NLI reconstructions were also performed using a finite element based isotropic material model for comparison.RESULTS:
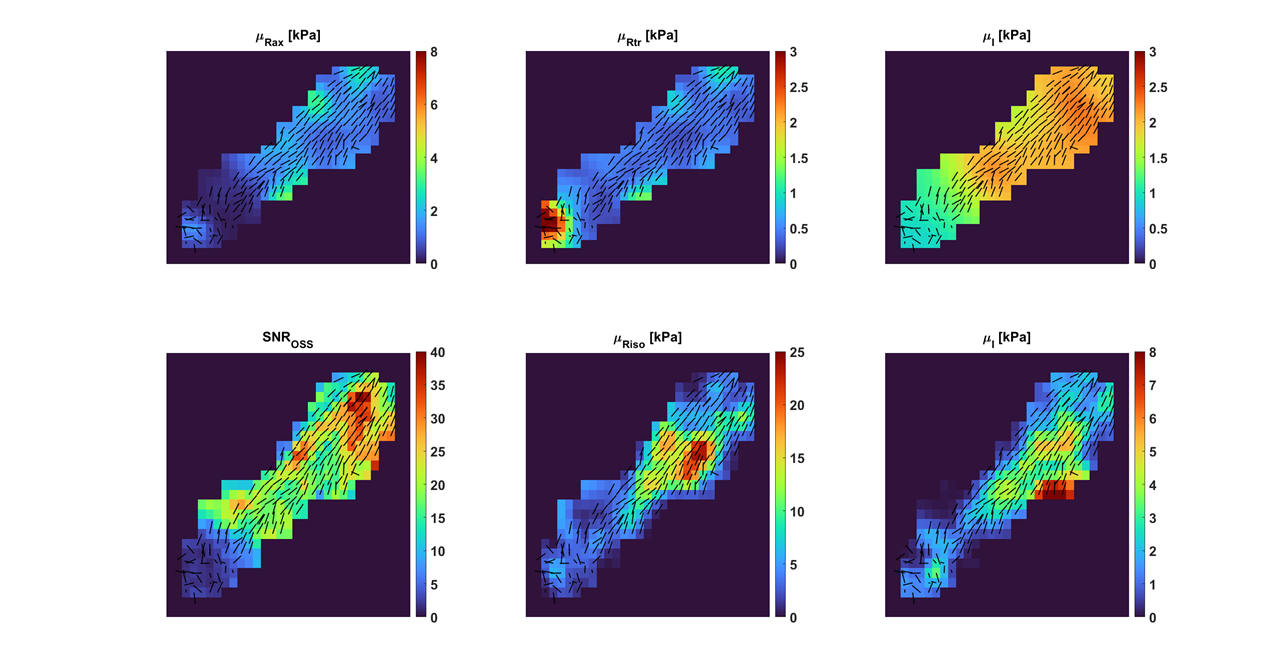
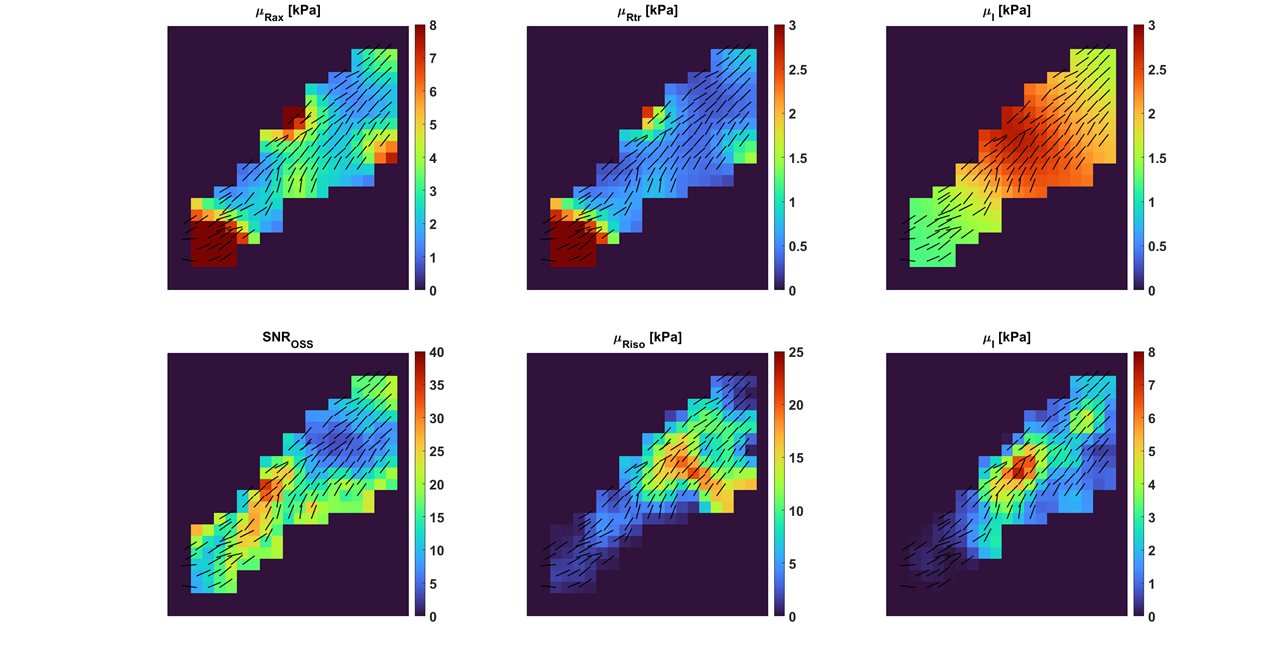
Results from two repeated imaging exams of the same healthy volunteer are shown in Figures 1 and 2. In each image, the main fiber orientations, as estimated by DTI, are shown as black lines of uniform length. The top row of each figure shows the results from the transversely isotropic NLI-MRE reconstruction, with the axial and transverse shear storage moduli, $$$\mu_{Rax}$$$and $$$\mu_{Rtr}$$$, as well as the corresponding isotropic loss modulus, $$$\mu_{I}$$$. The bottom row of each figure shows the OSS-SNR distribution within the supraspinatus and the isotropic shear storage and loss moduli, $$$\mu_{R}$$$ and $$$\mu_{I}$$$. Table 1 shows the average shear stiffness values, $$$\mu_{stiff}=2\frac{|\mu_R+i\mu_I|^2}{\left(\mu_R+|\mu_R+i\mu_I|\right)}$$$, for both the transversely isotropic and fully isotropic NLI-MRE reconstructions for the image slices shown in Figures 1 and 2.$$\array{\mbox{Shear Stiffness [kPa]} & \mbox{Transverse Isotropic (axial)} & \mbox{Isotropic} \\\mbox{Test 1} & 2.87 ± 0.65 & 6.92 ± 5.28 \\\mbox{Test 2} & 4.80 ± 2.41 & 7.29 ± 5.38 }\\\mbox{Table 1: Average shear stiffness values within the image slices shown in Figures 1 & 2}\\\mbox{for the transversely isotropic and fully isotropic NLI-MRE reconstructions.}$$DISCUSSION:
Visual inspection of Figures 1 & 2 shows that, except for isolated hot spots on the tissue boundary and at the muscle attachment point, the reconstructed transversely isotropic stiffness values are fairly uniform. Conversely, the stiffness values from the fully isotropic reconstructions show strong heterogeneity within the tissue, notably in regions where the OSS-SNR values change. Table 1 confirms that the property variation within the transverse isotropic reconstructions is smaller than the variation seen in the fully isotropic reconstructions. Previously reported stiffness values for the supraspinatus determined by shear wavelength measurement estimated the shear stiffness at 100Hz as 5.28 ± 0.75 kPa [2]. From the colorbars from Figures 1 and 2 and the average values indicated in Table 1, fully isotropic MRE reconstruction overestimates shear stiffness with higher variance, around (5.3-5.4 kPa)², while the transversely isotropic estimates are relatively close to expected measures.CONCLUSION:
Transversely isotropic NLI-MRE shows the potential to estimate the stiffness distribution within the highly anisotropic muscle tissue of the supraspinatus. In comparison with isotropic reconstructions, the anisotropic material model provides more uniform property distributions with less direct dependency on deformation signal and with reconstructed property values close to those reported in independent, wavelength-based estimates.Acknowledgements
NIH R01-EB027577; Québec Bio-Imaging Network Pilot Project #35450.References
[1] J. N. Gladstone, J. Y. Bishop, I. K. Y. Lo, and E. L. Flatow, “Fatty infiltration and atrophy of the rotator cuff do not improve after rotator cuff repair and correlate with poor functional outcome.,” Am. J. Sports Med., vol. 35, no. 5, pp. 719–728, May 2007.
[2] D. Ito et al., “Simultaneous acquisition of magnetic resonance elastography of the supraspinatus and the trapezius muscles.,” Magn. Reson. Imaging, vol. 57, pp. 95–102, Apr. 2019.
[3] M. A. Green, G. Geng, E. Qin, R. Sinkus, S. C. Gandevia, and L. E. Bilston, “Measuring anisotropic muscle stiffness properties using elastography.,” NMR Biomed., vol. 26, no. 11, pp. 1387–1394, Nov. 2013.
[4] A. T. Anderson et al., “Observation of direction-dependent mechanical properties in the human brain with multi-excitation MR elastography,” J. Mech. Behav. Biomed. Mater., vol. 59, pp. 538–546, 2016.
[5] M. D. J. McGarry et al., “A heterogenous, time harmonic, nearly incompressible transverse isotropic finite element brain simulation platform for MR elastography.,” Phys. Med. Biol., Jun. 2020.
[6] E. E. W. Van Houten, K. D. Paulsen, M. I. Miga, F. E. Kennedy, and J. B. Weaver, “An overlapping subzone technique for MR-based elastic property reconstruction,” Magn. Reson. Med., vol. 42, no. 4, pp. 779–786, 1999.
[7] J. R. Monte et al., “The repeatability of bilateral diffusion tensor imaging (DTI) in the upper leg muscles of healthy adults.,” Eur. Radiol., vol. 30, no. 3, pp. 1709–1718, Mar. 2020.
[8] A. Anderson et al., “Multi-Direction Excitation for Magnetic Resonance Elastography to Increase the Fidelity of Mechanical Properties,” in Proceedings of ISMRM 2014, 2014.
[9] C. L. Johnson and B. Sutton, “Echo-planar imaging magnetic resonance elastography pulse sequence,” 15/193,171, 2016.
[10] J.-D. Tournier et al., “MRtrix3: A fast, flexible and open software framework for medical image processing and visualisation.,” Neuroimage, vol. 202, p. 116137, Nov. 2019.
[11] M. D. J. McGarry, E. E. W. Van Houten, P. R. Perrĩez, A. J. Pattison, J. B. Weaver, and K. D. Paulsen, “An octahedral shear strain-based measure of SNR for 3D MR elastography,” Phys. Med. Biol., vol. 56, no. 13, 2011.
Figures