1006
Assessment of Obesity-Related Inflammation in Subcutaneous Adipose Tissue with MR Elastography (MRE)1Radiology, Mayo Clinic, Rochester, MN, United States, 2Sleep and Cardiometabolic Health, Pennington Biomedical Research Center, Baton Rouge, LA, United States, 3Gastroenterology, Mayo Clinic, Rochester, MN, United States, 4Anatomic Pathology, Mayo Clinic, Rochester, MN, United States
Synopsis
Multiparametric MRI and MRE was performed in 27 obese patients who had biopsies of liver and subcutaneous adipose tissues. We found significant correlations between the mechanical properties of liver and subcutaneous fat and their histological and biochemistry results. A model combining liver proton density fat fraction and subcutaneous fat stiffness had a slightly higher AUC for diagnosing nonalcoholic steatohepatitis than liver stiffness (AUC: 0.87 vs. 0.84, p=0.74). The results indicate that obesity-induced systemic inflammation affects both adipose and liver tissue mechanical properties and, therefore, models utilizing mechanical biomarkers from adipose tissue may improve the diagnosis of steatohepatitis in obese patients.
Introduction
The excessive accumulation of fat in obesity contributes to the development of systemic metabolic disorders, like type 2 diabetes, metabolic associated fatty liver disease (MAFLD, previously called nonalcoholic fatty liver disease or NAFLD), and nonalcoholic steatohepatitis (NASH) (1, 2). Adipose tissue plays an important role in the pathophysiology of obesity and the associated MAFLD progression. When the capacity of adipose tissue to store excessive energy is diminished, the hepatocytes will hold the spillover of lipids, leading to MAFLD. These metabolic alterations result in systemic inflammation, which promotes the development of NASH (3). It has been demonstrated that adipose tissue inflammation is established before the development of hepatic inflammation (1), and the tumor necrosis factor (TNF) is overexpressed in subcutaneous adipose tissue in obese patients (4). Since many studies have demonstrated that liver MRI/MRE can distinguish and diagnose NASH (5, 6), the objective of this study is to investigate the relationship between adipose and liver tissue mechanical properties. This pilot study also explored the potential for using a comprehensive abdominal MRE assessment of both liver and subcutaneous fat to diagnose NASH in obese patients.Methods
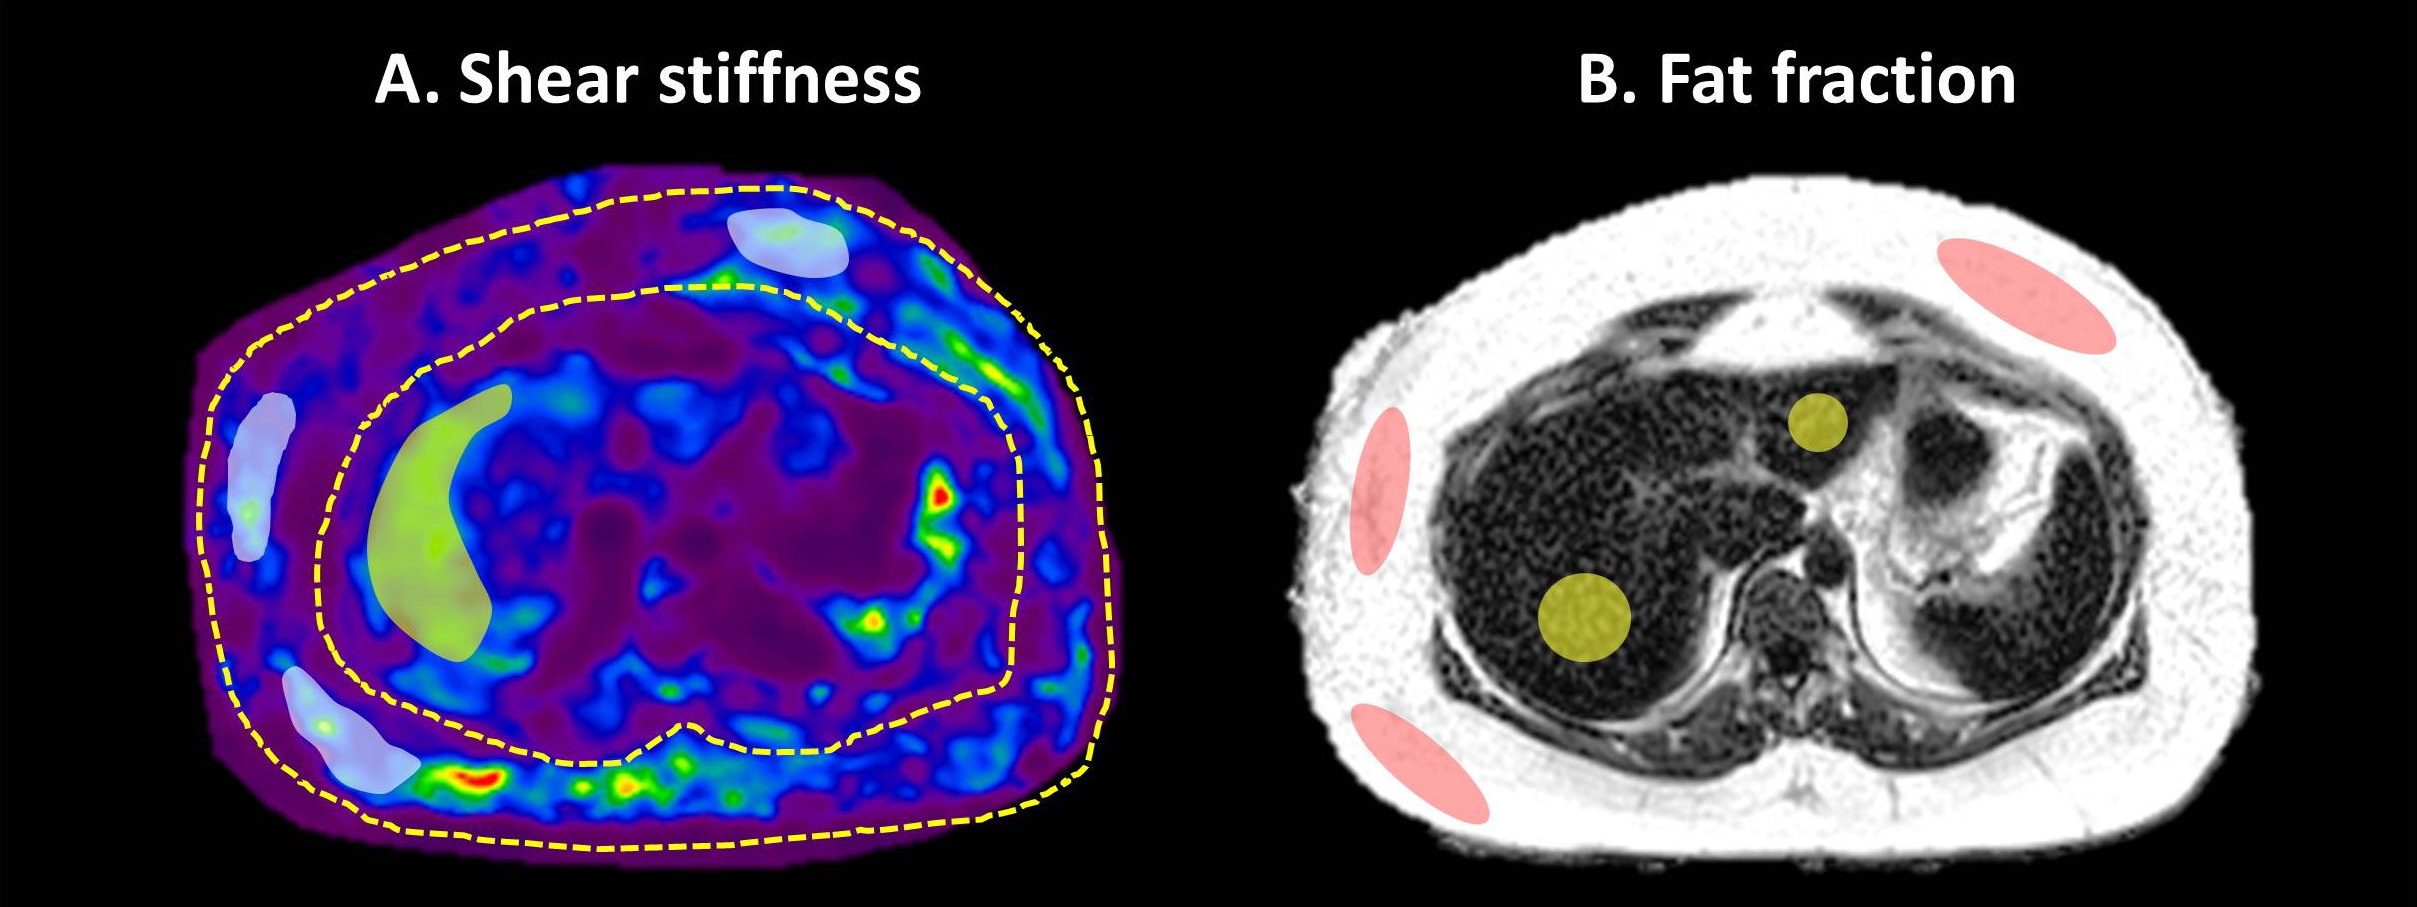
All activities related to human subjects were reviewed and approved by our institutional review board. 27 obese patients (BMI: 45 ± 7kg/m2; morbidly obese: 23/27; female: 23/27; age: 47 ± 10y) were enrolled in this study. All of them had liver and subcutaneous fat biopsies within three months of the MRI/MRE exams (5). Multiparametric 3D MRE (30Hz and 60Hz) and 6-point Dixon MRI were performed on 1.5T whole‐body scanners (GE Healthcare, Milwaukee, WI). The shear stiffness (SS) and loss modulus (LM) of subcutaneous fat and liver were calculated from manually drawn ROIs in the MRE image for both frequencies (Figure 1). In subcutaneous adipose tissue, the ROIs were selected in the regions with sufficient magnitude and wave signal. We excluded the areas with preload concerns, like the back and area beneath the MRE passive pneumatic actuator. mRNA and protein expression of components of the renin-angiotensin pathway were analyzed. Further, mRNA expression of key inflammatory and oxidative stress markers were also determined, including angiotensin II type 2 receptor (AT2R), angiotensinogen (AGT), and tumor necrosis factor (TNF). Spearman’s correlations were used to analyze the relationships between the MRI/MRE measurements of liver and subcutaneous fat and the histological/biochemistry results. Fisher’s exact test was used to compare the difference between contingency variables. A nominal logistic fit model was used to predict NASH diagnosis. All statistical analyses were performed using JMP Pro version 14.1.0. A significance level of 0.05 was used.Results
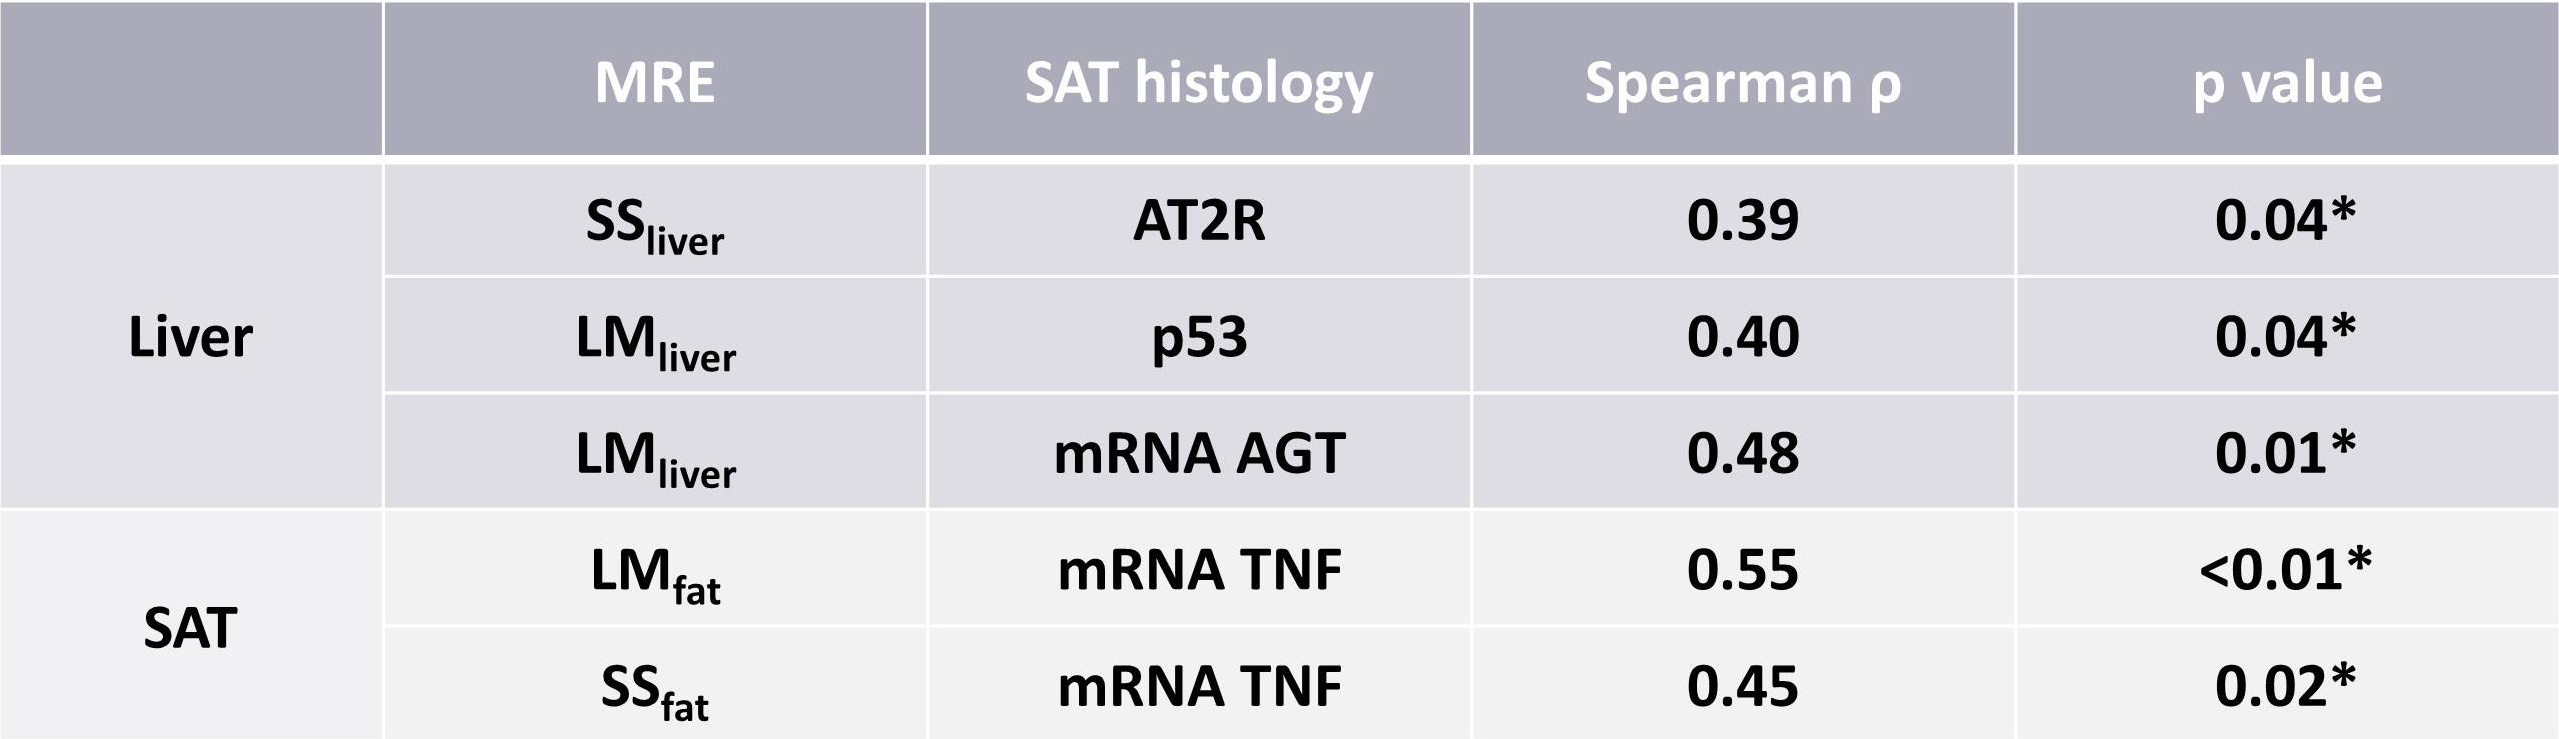
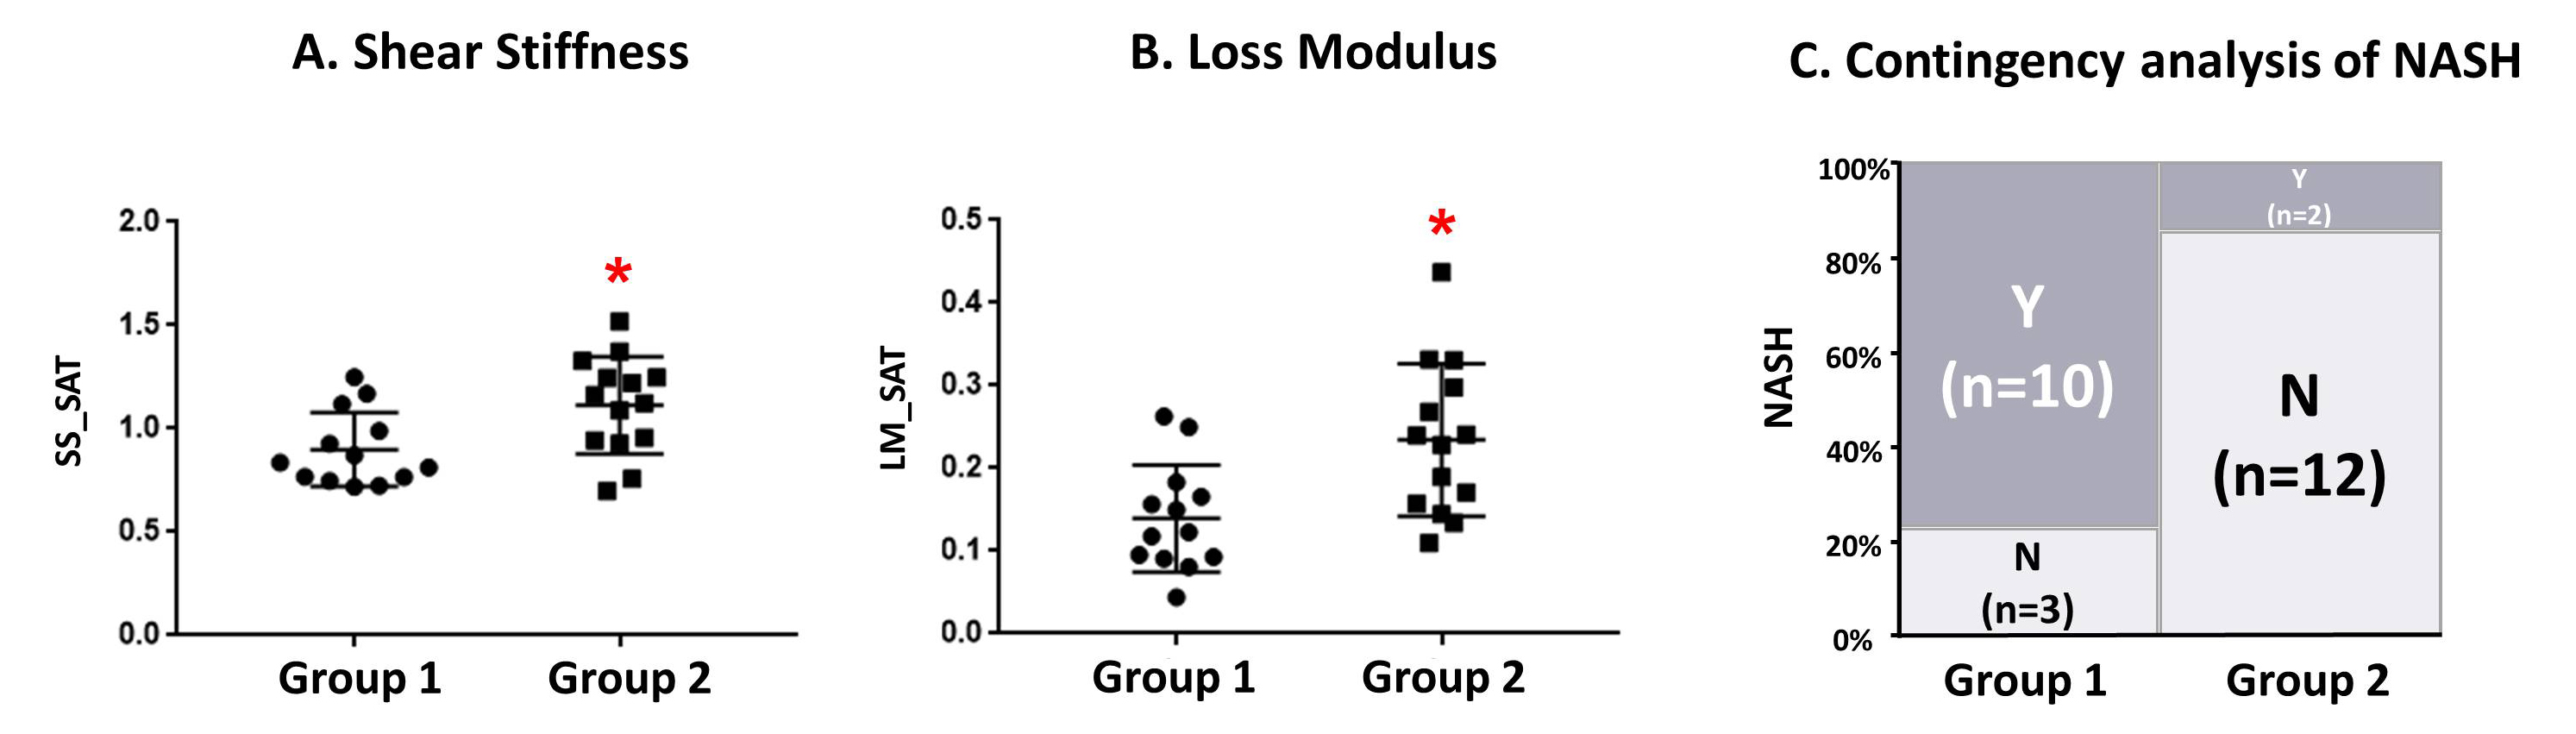
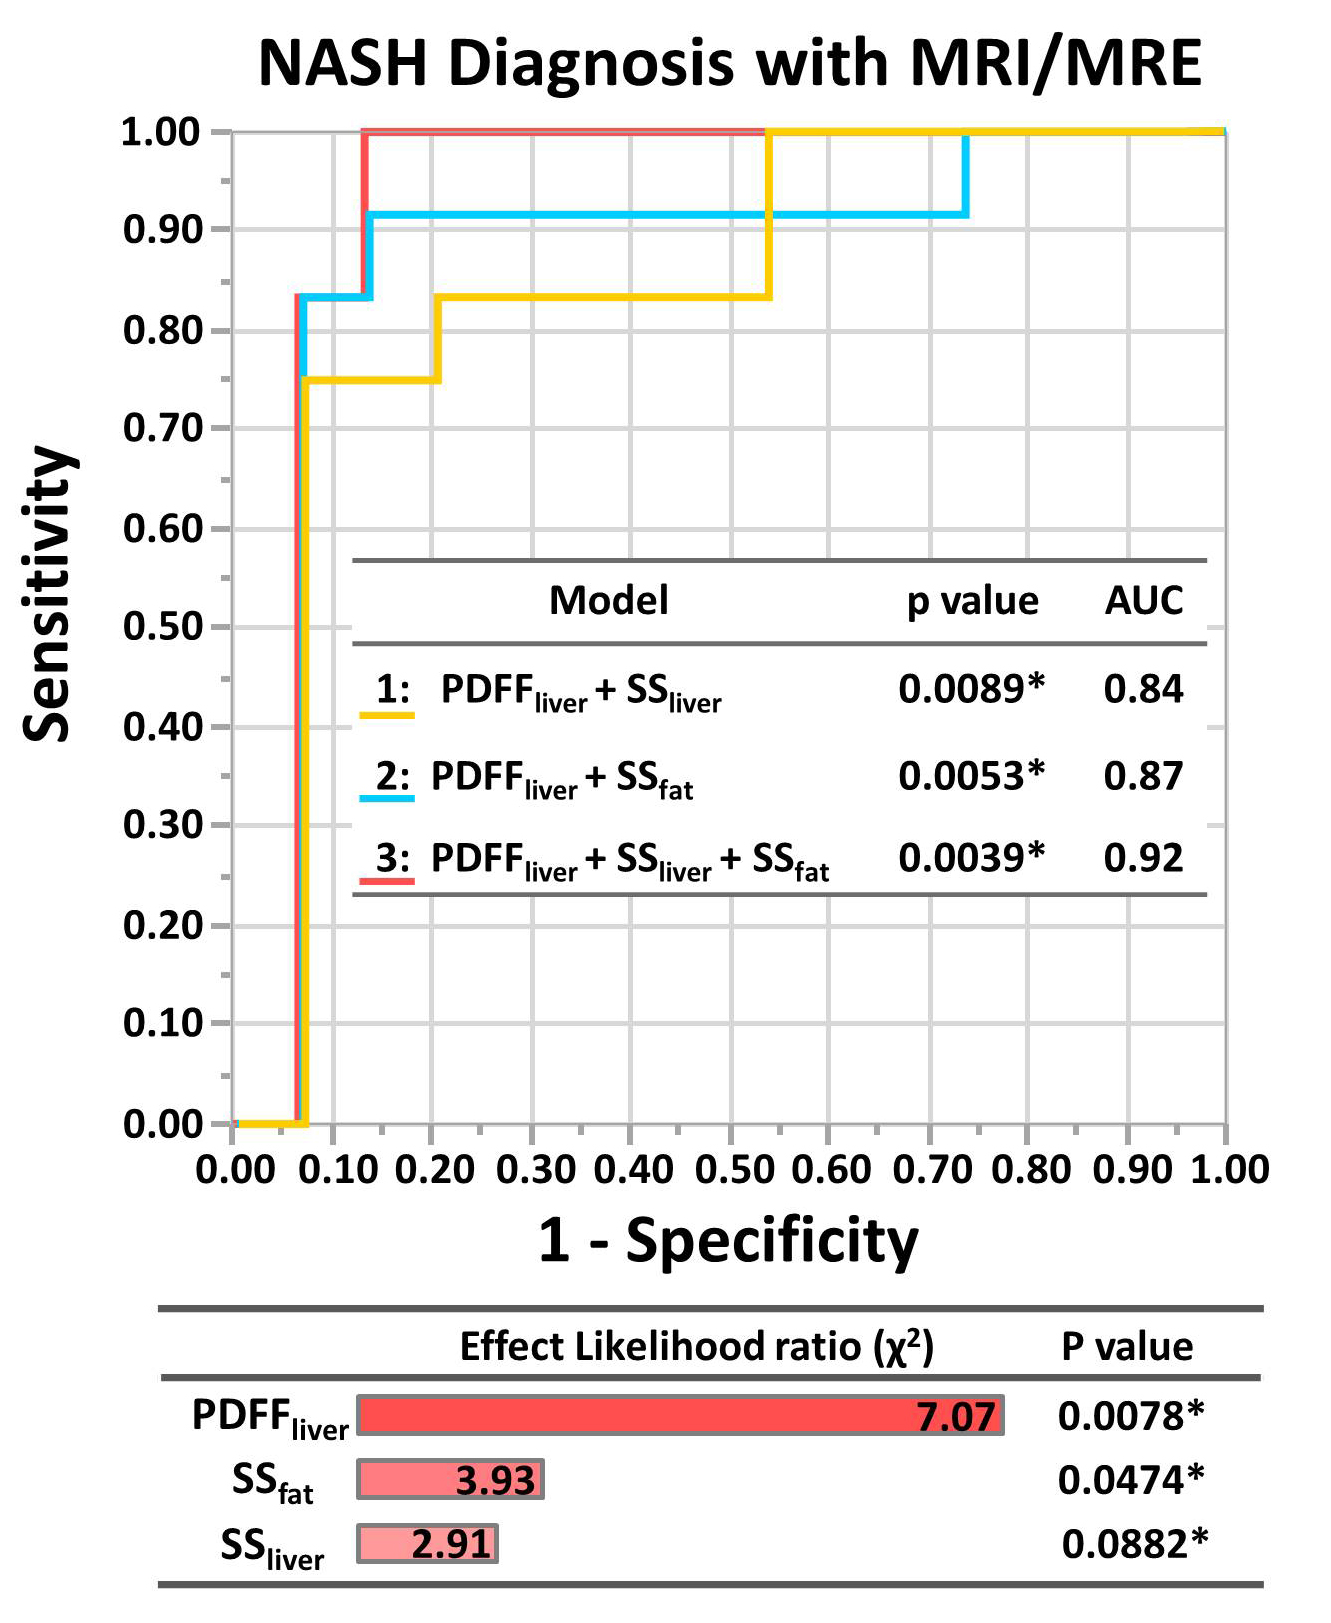
The mechanical properties of both liver and subcutaneous fat (SS and LM) had significant correlations with the biochemistry characteristics of subcutaneous fat (Table 1). Subcutaneous fat with higher mRNA expression of TNF showed significantly higher shear stiffness and loss modulus (SS, p=0.03; LM, p<0.01) (Figure 2A.B.). The Mosaic plot in Figure 2C shows fewer NASH patients in the high TNF group (p<0.01). The nominal logistic fit models all predicted the diagnosis of NASH well, and there is no significant difference between models (Model 1 vs. Model 2: p=0.74; Model 2 vs. Model 3: p=0.39; Model 1 vs. Model 3: p=0.12) (Figure 3).Discussion
The significant correlations between the measured mechanical properties of subcutaneous fat and the mRNA expression of TNF in subcutaneous fat indicate that MRE-based biomarkers from adipose tissue reflect metabolic dysfunction in obese patients. Bullo et al. found that TNF is overexpressed in subcutaneous fat in obese patients when compared with healthy volunteers and they believe that the TNF system may be a homeostatic mechanism that prevents further fat deposition (7). In this study, we found that in patients who had higher mRNA expression of TNF, fewer were diagnosed with NASH. This supports their hypothesis that the high expression of TNF limited the fat deposition. Thus, simple steatosis progression to NASH might be halted or alleviated with high TNF. The prediction model composed of liver stiffness and fat fraction has been used for diagnosing NASH (5) and evaluating treatment efficacy after bariatric surgery in obese patients (6). When replacing liver stiffness with subcutaneous fat stiffness in the prediction model, we did not observe a significant difference in the accuracy between the two models. If all three parameters are combined, the diagnostic accuracy is superior to both two-parameter models. This finding reinforces the clinical consensus that adipose tissue plays an important role in the disease progression of NASH in obese patients (3). Using a combination of liver fat fraction, liver stiffness, and subcutaneous fat stiffness, this prediction model could comprehensively characterize the systemic metabolic disorders of NASH.Conclusion
The MRE measurements of subcutaneous adipose tissue may reflect the pathophysiologic influence of fat in obesity and metabolic associated fatty liver disease. A comprehensive assessment of liver fat fraction, liver stiffness, and subcutaneous fat stiffness can improve NASH diagnosis and distinguish metabolic dysfunctions systematically.Acknowledgements
This study is funded by NIH grants EB017197 (M.Y.), EB001981(R.L.E.), DK115594 (A.M.A.), DK059615 (V.S.), and DoD grant W81XWH-19-1-0583-01 (M.Y.).References
1. van der Heijden RA, Sheedfar F, Morrison MC, Hommelberg PP, Kor D, Kloosterhuis NJ, Gruben N, Youssef SA, de Bruin A, Hofker MH, Kleemann R, Koonen DP, Heeringa P. High-fat diet induced obesity primes inflammation in adipose tissue prior to liver in C57BL/6j mice. Aging 2015;7(4):256-268. doi: 10.18632/aging.100738
2. Fischer IP, Irmler M, Meyer CW, Sachs SJ, Neff F, Hrabě de Angelis M, Beckers J, Tschöp MH, Hofmann SM, Ussar S. A history of obesity leaves an inflammatory fingerprint in liver and adipose tissue. International journal of obesity (2005) 2018;42(3):507-517. doi: 10.1038/ijo.2017.224
3. Polyzos SA, Kountouras J, Mantzoros CS. Obesity and nonalcoholic fatty liver disease: From pathophysiology to therapeutics. Metabolism 2019;92:82-97. doi: 10.1016/j.metabol.2018.11.014
4. Stolarczyk E. Adipose tissue inflammation in obesity: a metabolic or immune response? Current opinion in pharmacology 2017;37:35-40. doi: 10.1016/j.coph.2017.08.006
5. Allen AM, Shah VH, Therneau TM, Venkatesh SK, Mounajjed T, Larson JJ, Mara KC, Schulte PJ, Kellogg TA, Kendrick ML, McKenzie TJ, Greiner SM, Li J, Glaser KJ, Wells ML, Chen J, Ehman RL, Yin M. The Role of Three-Dimensional Magnetic Resonance Elastography in the Diagnosis of Nonalcoholic Steatohepatitis in Obese Patients Undergoing Bariatric Surgery. Hepatology 2018. doi: 10.1002/hep.30483
6. Allen AM, Shah VH, Therneau TM, Venkatesh SK, Mounajjed T, Larson JJ, Mara KC, Kellogg TA, Kendrick ML, McKenzie TJ, Greiner SM, Li J, Glaser KJ, Wells ML, Gunneson TJ, Ehman RL, Yin M. Multiparametric Magnetic Resonance Elastography Improves the Detection of NASH Regression Following Bariatric Surgery. Hepatology communications 2020;4(2):185-192. doi: 10.1002/hep4.1446
7. Bulló M, García-Lorda P, Peinado-Onsurbe J, Hernández M, Del Castillo D, Argilés JM, Salas-Salvadó J. TNFalpha expression of subcutaneous adipose tissue in obese and morbid obese females: relationship to adipocyte LPL activity and leptin synthesis. International journal of obesity and related metabolic disorders : journal of the International Association for the Study of Obesity 2002;26(5):652-658. doi: 10.1038/sj.ijo.0801977
Figures