1005
Viscoelastic Differences in Human Gray and White Matter at Different Spatial Resolutions
Shruti Mishra1,2, Bin Deng2,3,4, W. Scott Hoge1,2,3, Giacomo Annio5, Ralph Sinkus5, and Samuel Patz1,2
1Department of Radiology, Brigham & Women's Hospital, Boston, MA, United States, 2Harvard Medical School, Boston, MA, United States, 3Athinoula A. Marginos Center for Biomedical Imaging, Charlestown, MA, United States, 4Radiology, Massachusetts General Hospital, Boston, MA, United States, 5Laboratory for Vascular Translational Science (LVTS), Institut National de la Santé et de la Recherche Médicale (INSERM), Paris, France
1Department of Radiology, Brigham & Women's Hospital, Boston, MA, United States, 2Harvard Medical School, Boston, MA, United States, 3Athinoula A. Marginos Center for Biomedical Imaging, Charlestown, MA, United States, 4Radiology, Massachusetts General Hospital, Boston, MA, United States, 5Laboratory for Vascular Translational Science (LVTS), Institut National de la Santé et de la Recherche Médicale (INSERM), Paris, France
Synopsis
Magnetic resonance elastography (MRE) was utilized to demonstrate differences in shear wavelength between human cortical gray matter and subcortical white matter and evaluate the effect of spatial resolution on wavelength estimation. Much greater brain architectural detail was discerned in the viscoelastic maps when going from 2.5 mm to 1.5 mm isotropic spatial resolution. We also demonstrate in individual healthy subjects, through two adjacent multi-voxel regions of interest, that cortical gray matter is stiffer than adjacent subcortical white matter, and that this difference is accentuated at higher resolutions. Furthermore, we show that the mean estimated wavelength increases with decreasing spatial resolution.
INTRODUCTION
Prior brain MRE studies have quantified viscoelastic parameters in both healthy adult human brains1,2 as well as in aging3, multiple sclerosis4, brain tumors5–7, and dementia8. Many of these studies have utilized global or lobar summary metrics of viscoelasticity, perhaps due to constraints related to lower spatial resolution. Previous reports quantifying viscoelastic parameters in healthy brains have suggested that deep gray nuclei may be stiffer than surrounding white matter, although with variability across sites. In this work, we evaluate differences in estimated wavelength between cortical and subcortical white matter regions at three different spatial resolutions.METHODS
Procedure: We utilized a custom-made rotating eccentric mass MRE transducer9 coupled to the head of a volunteer to induce 50Hz mechanical waves. Similar to prior work on functional MRE10, we modified a multi-slice Ristretto MRE sequence on a Siemens 3T PRISMA scanner11. Sequence details include: FLASH readout, FA = 25 degrees, TE = 9.84 ms, TR = 125 ms, MEG amplitude of 37 mT/m, 9 slices, 8 wave phases, GRAPPA acceleration factor = 2 with 24 pre-scan references lines, 4 Hadamard MEG encoding directions. Nine slices were obtained centered around the visual cortex. Acquisition matrices of 128x128, 96x96 and 80x80 were used to acquire data at isotropic spatial resolutions of 1.5mm, 2mm and 2.5mm respectively with corresponding FOVs of 192x192, 192x192 and 200x200mm. Acquisition times were 5 min 28 sec, 6 min 30 sec, and 8 min 44 seconds for resolutions 2.5mm, 2mm, and 1.5mm, respectively. Displacement modulated MR phase data are pixel-wise Fourier transformed and the according amplitudes and phases at the mechanical driving frequency used to compose the complex valued displacement vector U. Each component of U is 3D Gaussian filtered (sigma=1px, support=3x3x3 pixels) prior to the calculation of q=curl U. Finally, the 3D Helmholtz wave-equation of q is solved for an isotropic wavelength via minimum χ2. Final maps of the wavelength (λ) are spike-filtered and smoothed using a Blackman-Harris filter. A 3D T1 MPRAGE image was also acquired for anatomical reference.Data Analysis: Cortical segmentation of the MPRAGE image was completed using the FreeSurfer12 pipeline. The left and right hemispheric lateral occipital cortex regions of interest (ROIs) were selected from the Freesurfer segmentation, as these were expected to contain the visual cortex. Adjacent white matter ROIs were drawn manually and are shown in Figure 2. Mean and standard deviation of the reconstructed wavelength (λ) in mm was computed in each of the four ROIs and two-tailed t-tests were completed to determine statistical significance in λ between the cortex and adjacent white matter.
RESULTS
Figure 1 demonstrates the estimated wavelength (λ) overlaid on the high-resolution MPRAGE at the same slice location, computed from three spatial resolutions, at 2.5 mm, 2.0 mm and 1.5 mm for two healthy adult subjects. ROI analyses (Figure 3) demonstrated that for subject 1, the mean wavelength of the left hemisphere lateral occipital cortex was shorter when compared to the adjacent white matter at 2.5 mm (t = -11.6, p< 0.0001), 2.0 mm (t=-21.9, p< 0.0001), and 1.5 mm (-t=22.9, p<0.0001). The mean wavelength of the right hemisphere lateral occipital cortex was shorter when compared to the adjacent white matter at 2.5 mm (t=-7.1, p<0.0001), 2.0 mm (t=-5.2, p< 0.001), and 1.5 mm (t=-5.8, p<0.0001). Similarly, for subject 2, statistically significant (p<0.05) relationships were seen between the right lateral occipital cortex and white matter at 2.5 mm, 2.0 mm, and 1.5 mm, and between the left lateral occipital cortex and white matter at 2.0 mm and 1.5 mm. The mean wavelength (mm) was longer for all regions of interest at a 2.5 mm resolution compared to 1.5 mm resolution.DISCUSSION & CONCLUSION
High resolution MRE of the brain results in a lower mean estimated wavelength (and therefore stiffness) for a given brain region and greater discriminability between adjacent cortical and subcortical regions. Since lower spatial resolution effectively smooths the delineation of boundaries between adjacent structures, this necessarily results in both reduced discrimination between different stiffness structures as well as longer estimated wavelengths of these structures. This behavior has previously been predicted in “in silico” studies13. We demonstrate that high spatial resolution MRE with 1.5 mm allows for visualization of structural viscoelastic differences in the visual cortex region (estimated by the lateral occipital cortical ROIs), when compared to the surrounding white matter. Discerning spatial differences in viscoelastic properties of the brain will be essential for utilization of MRE in functional experiments, when evaluating for primary neural activation in the visual cortex for example. The application of high-resolution scans to functional MRE is discussed in a separate submitted abstract by Deng et al.Previous groups have reported that deep gray matter structures are stiffer than surrounding white matter, which may seem in contradiction to the results reported here. Differences are likely due the use of global measurements of white matter in those situations, compared to local white matter in the present study, as well as differences in contribution of gray matter between subcortical or deep gray matter nuclei and cortical gray matter. We plan to apply this analysis to other areas of the brain that have varying contributions of gray and white matter in the future.
Acknowledgements
This project is supported by NIH grants R01EB028664 and K01EB027726, the Department of Radiology at Brigham and Women’s Hospital, and the European Union’s Horizon 2020 grant 668039.References
- Johnson CL, Schwarb H, D.J. McGarry M, et al. Viscoelasticity of subcortical gray matter structures. Human Brain Mapping. 2016;37(12):4221-4233. doi:10.1002/hbm.23314
- Murphy MC, Huston J, Ehman RL. MR elastography of the brain and its application in neurological diseases. NeuroImage. 2019;187(August 2017):176-183. doi:10.1016/j.neuroimage.2017.10.008
- Sack I, Streitberger K-J, Krefting D, Paul F, Braun J. The Influence of Physiological Aging and Atrophy on Brain Viscoelastic Properties in Humans. PLOS ONE. 2011;6(9):e23451. https://doi.org/10.1371/journal.pone.0023451
- Streitberger KJ, Sack I, Krefting D, et al. Brain viscoelasticity alteration in chronic-progressive multiple sclerosis. PLoS ONE. 2012;7(1). doi:10.1371/journal.pone.0029888
- Pepin KM, McGee KP, Arani A, et al. MR elastography analysis of glioma stiffness and IDH1-mutation status. American Journal of Neuroradiology. 2018;39(1):31-36. doi:10.3174/ajnr.A5415
- Murphy MC, Huston J, Glaser KJ, et al. Preoperative assessment of meningioma stiffness using magnetic resonance elastography. Journal of Neurosurgery. 2013;118(3):643-648. doi:10.3171/2012.9.JNS12519
- Bunevicius A, Schregel K, Sinkus R, Golby A, Patz S. REVIEW: MR elastography of brain tumors. NeuroImage Clinical. 2020;25(November 2019):102109. doi:10.1016/j.nicl.2019.102109
- Murphy MC, Jones DT, Jack CR, et al. Regional brain stiffness changes across the Alzheimer’s disease spectrum. NeuroImage: Clinical. 2016;10:283-290. doi:10.1016/j.nicl.2015.12.007
- Runge JH, Hoelzl SH, Sudakova J, et al. A novel magnetic resonance elastography transducer concept based on a rotational eccentric mass: preliminary experiences with the gravitational transducer. Physics in medicine and biology. 2019;64(4):45007. doi:10.1088/1361-6560/aaf9f
- Patz S, Fovargue D, Schregel K, et al. Imaging localized neuronal activity at fast time scales through biomechanics. Science Advances. 2019;5(4). doi:10.1126/sciadv.aav3816
- Guenthner C, Sethi S, Troelstra M, Dokumaci AS, Sinkus R, Kozerke S. Ristretto MRE: A generalized multi-shot GRE-MRE sequence. NMR in Biomedicine. 2019;32(5):1-13. doi:10.1002/nbm.4049
- Fischl B, Salat DH, Busa E, et al. Whole Brain Segmentation: Neurotechnique Automated Labeling of Neuroanatomical Structures in the Human Brain. Neuron. 2002;33(3):341-355. doi:10.1016/S0896-6273(02)00569-X
- Yue JL, Tardieu M, Julea F, et al. Acquisition and reconstruction conditions in silico for accurate and precise magnetic resonance elastography. Phys Med Biol 2017;62:8655–70.
Figures
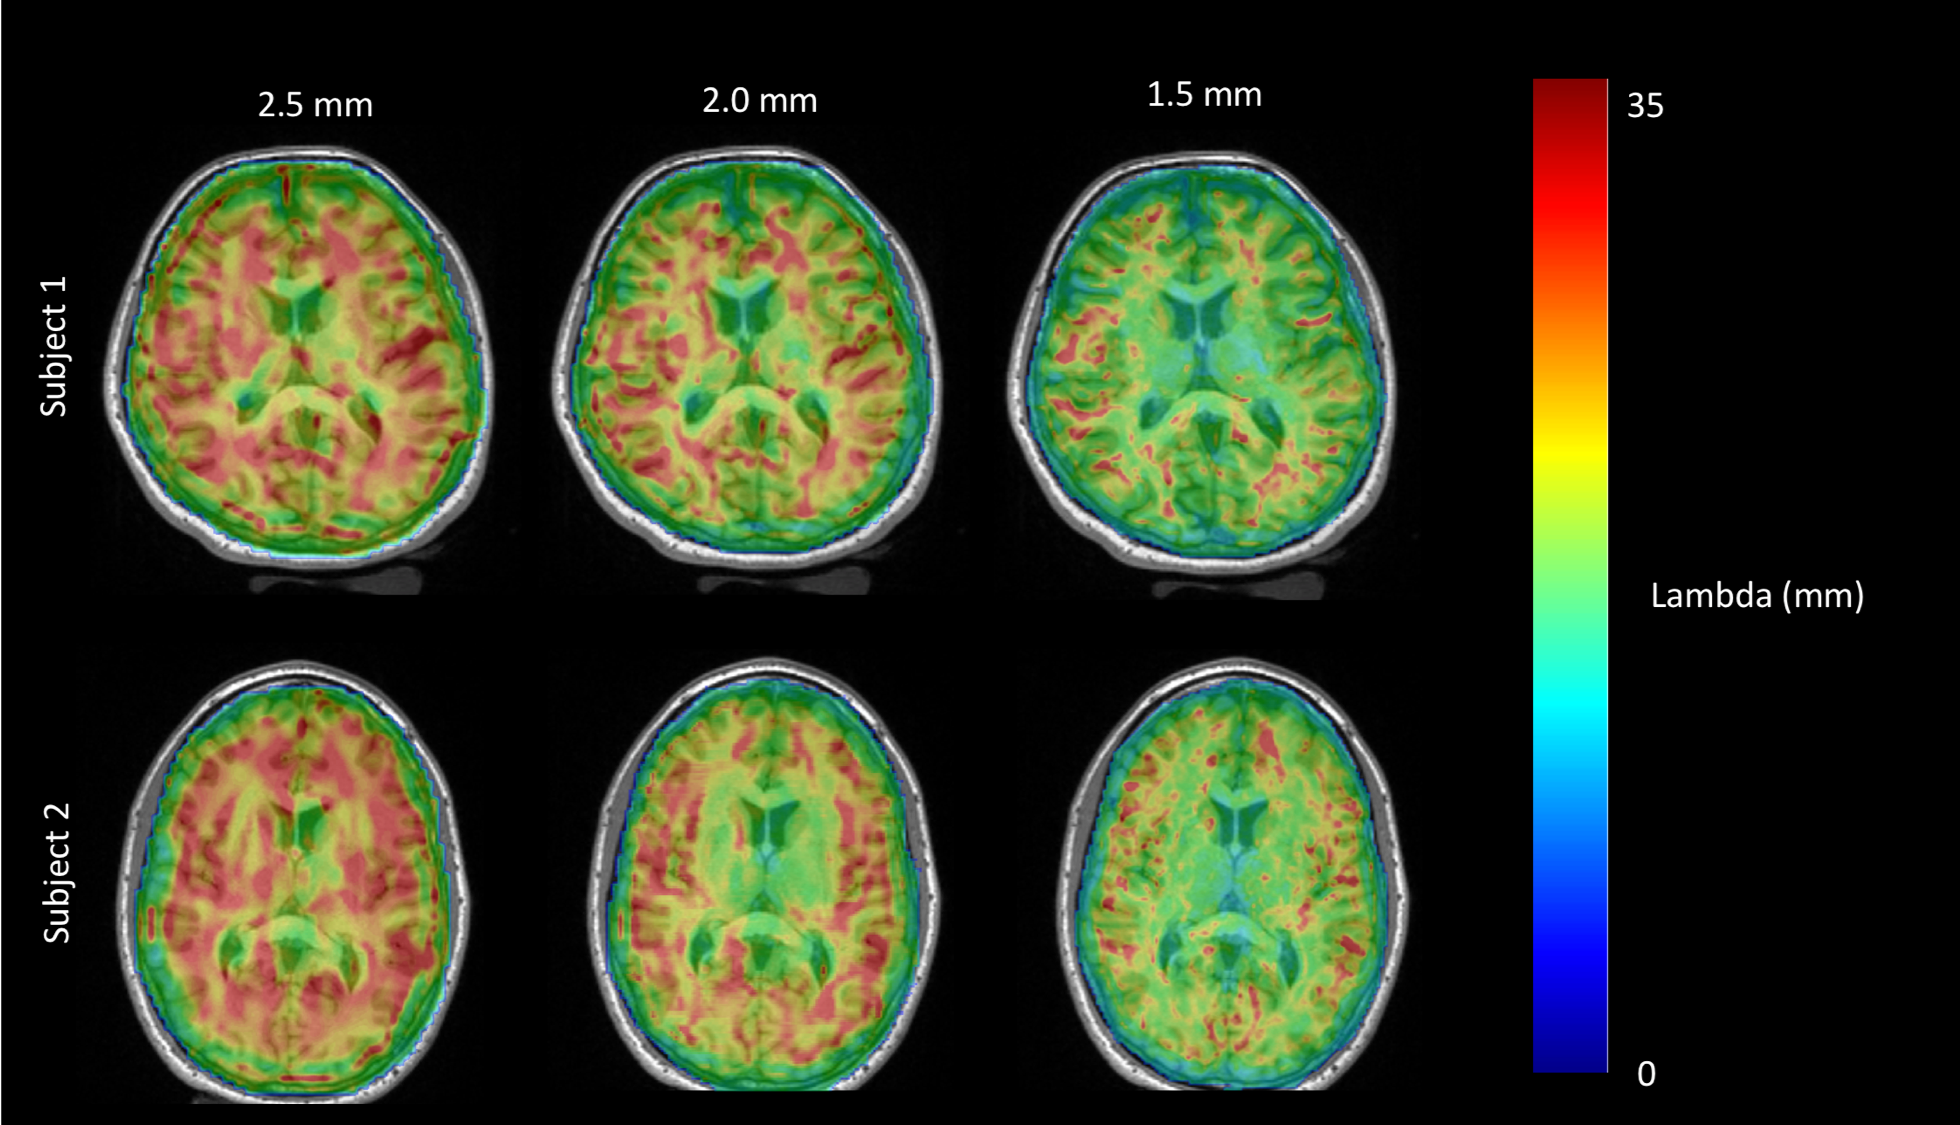
Figure 1: Estimated wavelength ($$$\lambda$$$) overlaid on high-resolution T1 MPRAGE for MRE sequences obtained at 2.5 mm (left), 2.0 mm (middle), and 1.5 mm (right) isotropic resolutions on two healthy adult subjects.
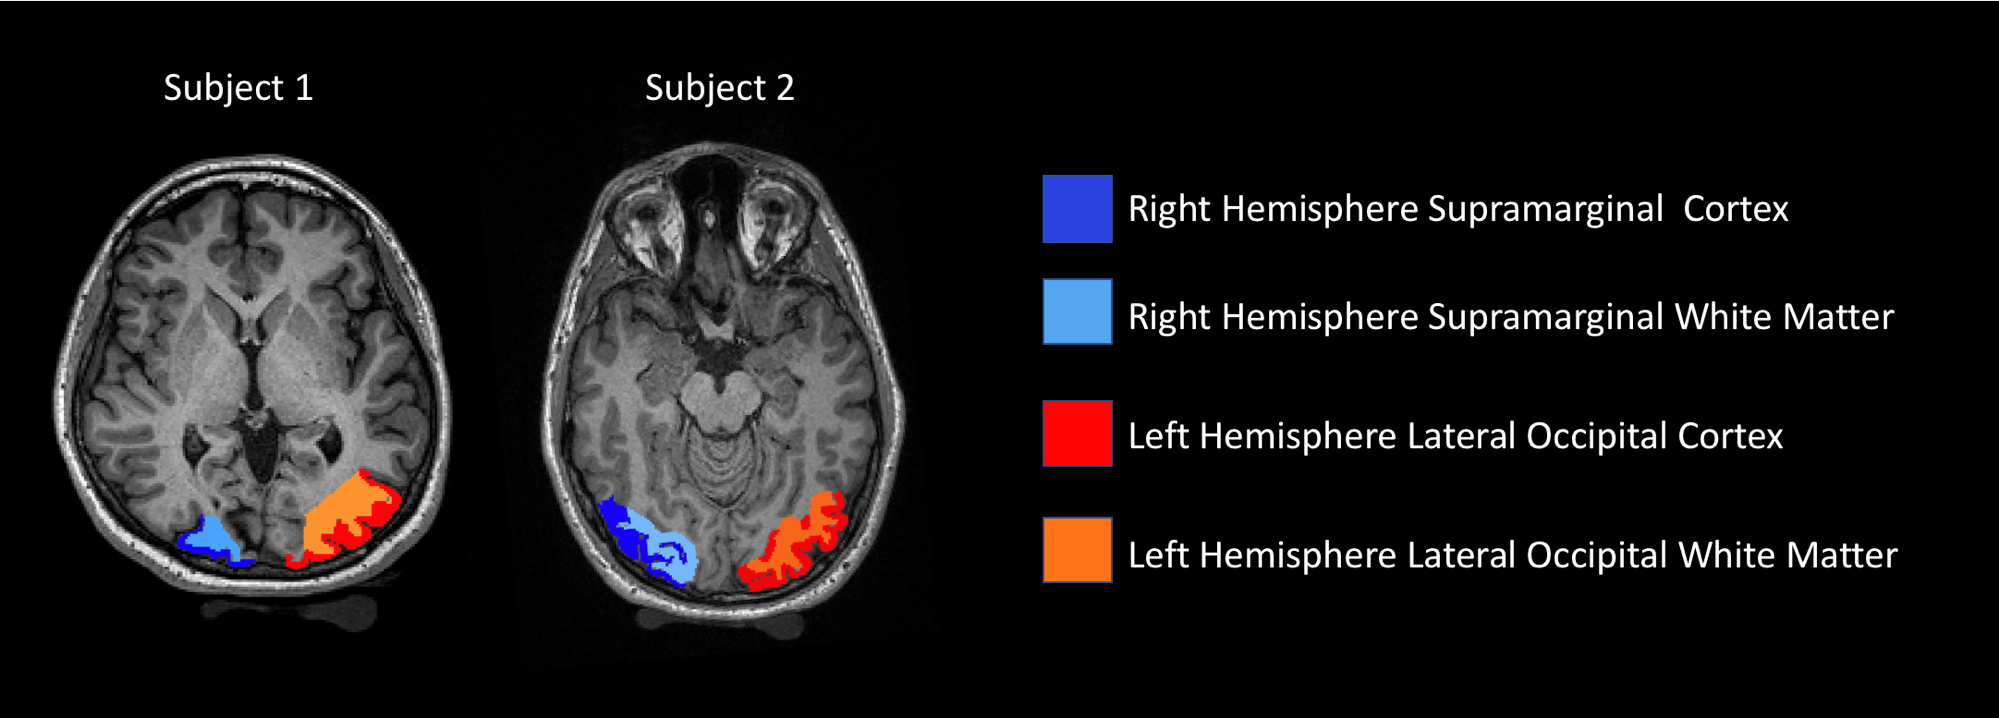
Figure 2: Pictorial depiction of the bilateral lateral occipital cortical regions of interest (generated from FreeSurfer pipeline) with adjacent subcortical white matter regions of interest, generated manually using FreeSurfer software. Individual slice represents the intersection between the FreeSurfer ROI and the field-of-view included in the MRE sequences.
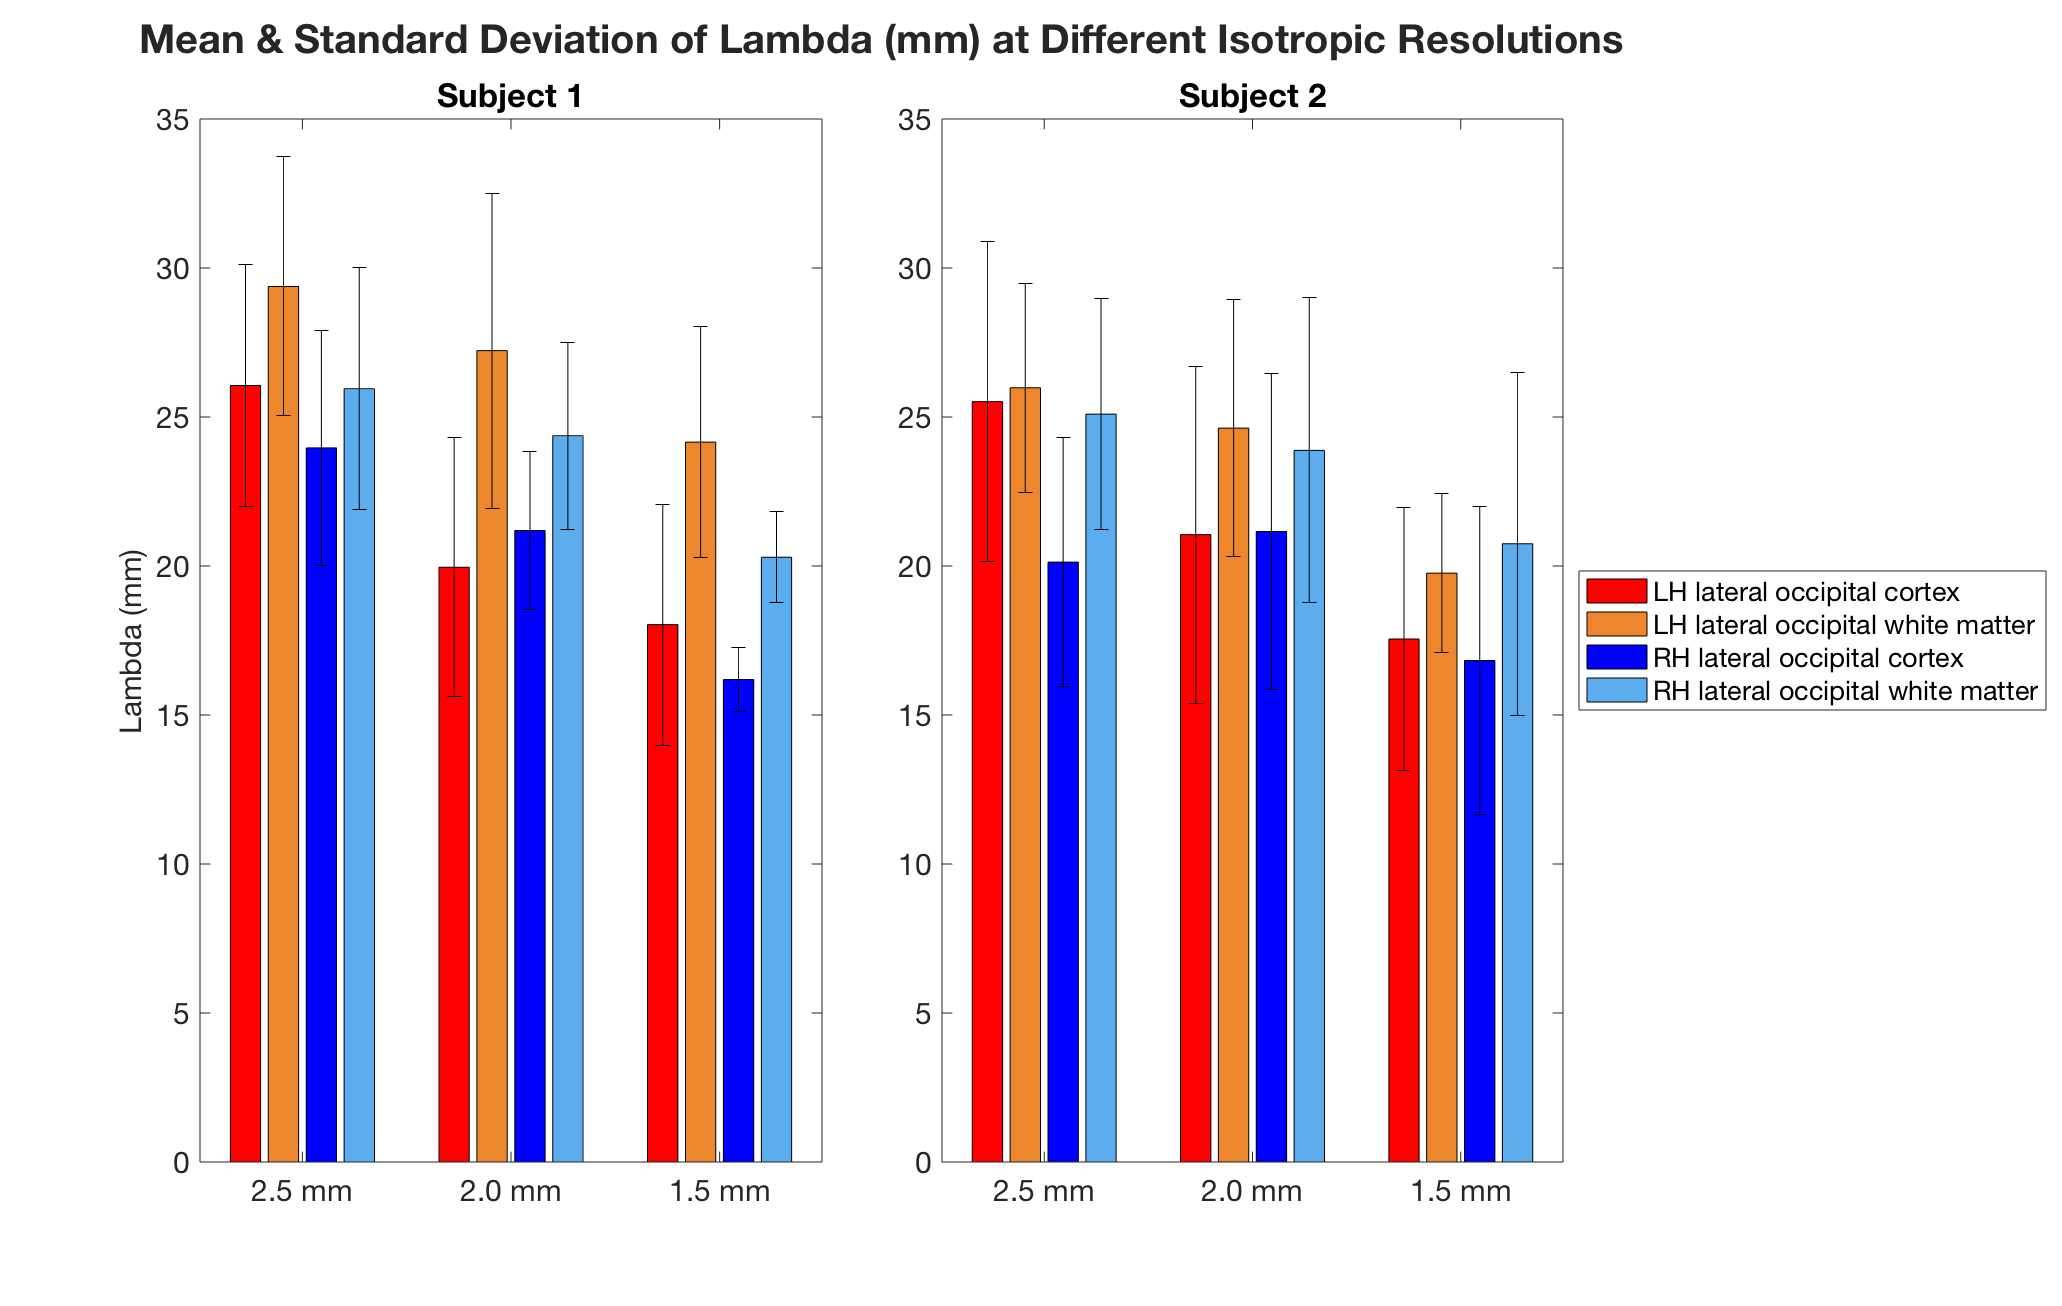
Figure 3: Mean and standard deviation of the estimated wavelength (mm) in each of the left and right hemisphere lateral occipital cortex ROIs and adjacent white matter, depicted in Figure 2, from MRE scans done at 2.5, 2.0, and 1.5 mm resolutions, respectively, for each of the two subjects.