1004
MR elastography of abdominal aortic aneurysm specimens1Department of Radiology, Charité - Universitätsmedizin Berlin, Berlin, Germany, 2Department of Veterinary Pathology, Free University of Berlin, Berlin, Germany, 3Department of Diagnostic and Interventional Radiology, Technical University of Munich, Berlin, Germany, 4Institute for Medical Informatics, Charité - Universitätsmedizin Berlin, Berlin, Germany
Synopsis
Abdominal aortic aneurysms (AAA) are among the worldwide leading causes of death. Standard MRI and ultrasonography cannot predict the risk of life-threatening AAA rupture. The ECM composition and therefore the stiffness of the aortic wall changes during AAA development and progression. Therefore, we investigated AAA stiffness in murine tissue samples using MR elastography with an in-plane resolution of 40 microns. Compared to healthy aorta, we found an increase of vessel wall stiffness in AAA of approximately 20% and an excellent correlation of histology-quantified ECM accumulation with thrombus stiffness.
INTRODUCTION
An abdominal aortic aneurysm (AAA) is defined as a permanent pathological dilatation of the abdominal aorta and is one of the leading causes of death in developed countries1,2. Currently AAAs are diagnosed by computed tomography, MRI or ultrasound, yet none of those imaging modalities deliver reliable information about the morphology of the aneurysm and the risk of rupture1,3. Aortic stiffness represents the microstructure and the extracellular matrix (ECM) content of AAA and could therefore serve as a potential rupture risk assessment marker4. A noninvasive method for the determination of viscoelastic parameters in soft tissues is time-harmonic elastography by ultrasound or MRI, which has already revealed disease-related changes in stiffness in the human abdominal aorta5-8. The aim of this study is to apply magnetic resonance elastography (MRE) to murine AAAs. The obtained spatially resolved maps of vascular stiffness are further compared to ECM accumulation in histology to investigate a potential use of stiffness as a quantitative biomarker of rupture risk.METHODS
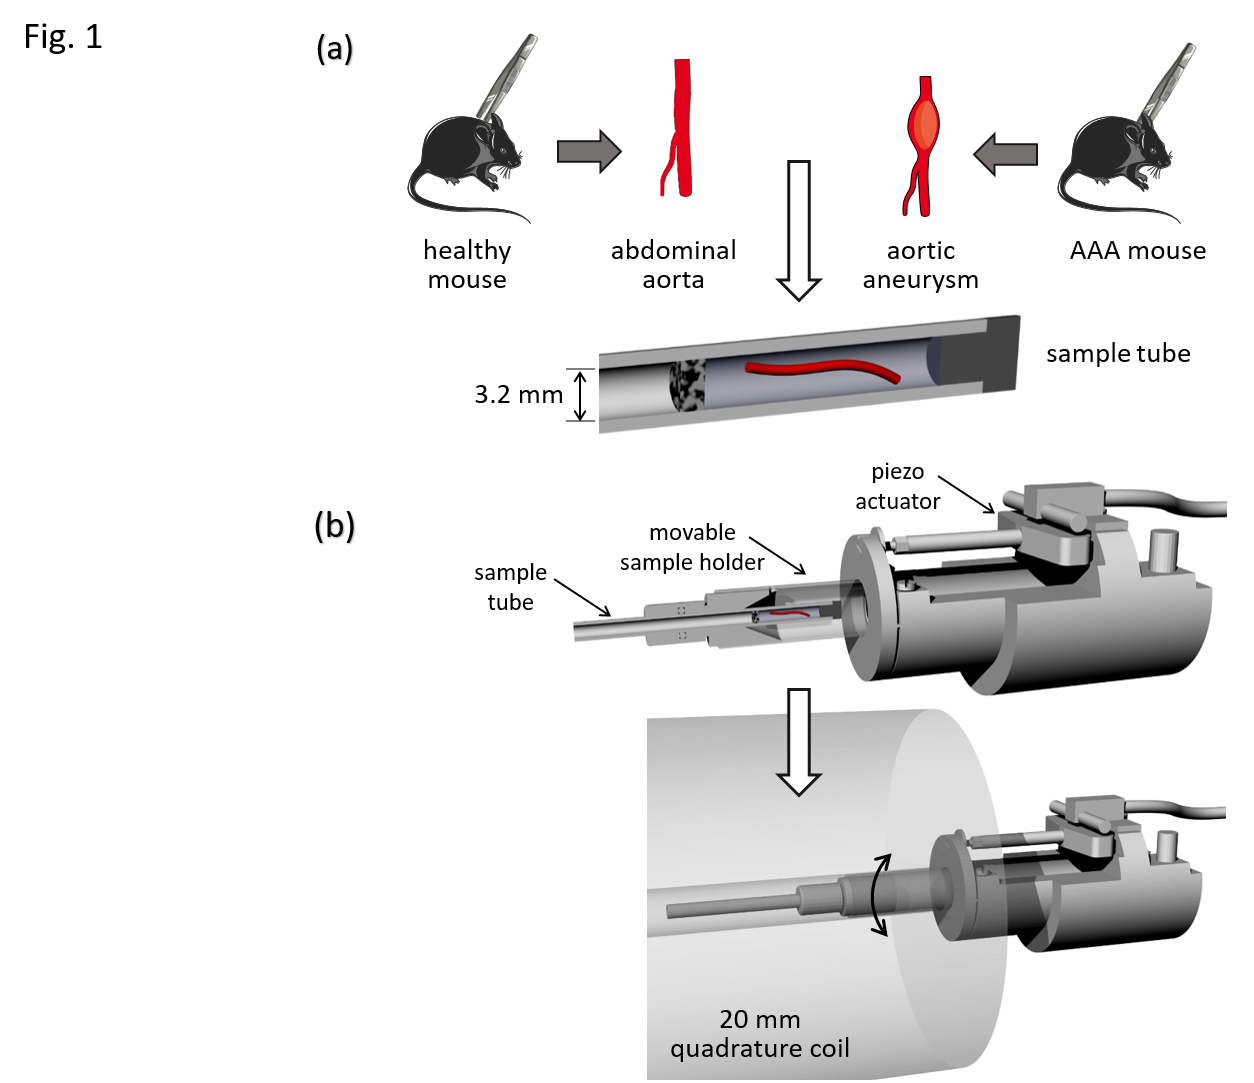
The animal experiments were approved and performed according to the animal protection committee of the LaGeSo, Berlin, Germany. AAAs were induced in 6 8-weeks-old male B6.129P2-Apoetm1Unc/J mice by application of Angiotensin II using surgically implanted minipumps (Alzet model 2004, Durect Corp) with an infusion rate of 1,000 ng/kg/min9. Four weeks later, the animals were euthanized and the abdominal aorta was dissected. For control, 6 C57BL/6J healthy male mice were euthanized and dissected at 12 weeks of age10.The abdominal portion of the aorta was separated from the surrounding tissue. Ligatures tying off both ends of the dissected artery were completed, one in the renal region and one approximately 1 cm further cranial. The samples were inserted in a glass tube with 3.2 mm inner diameter (Wilmad NMR tube, St. Louis, MO, USA) parallel to the vessel wall, and embedded in ultrasound gel (Fig.1a).
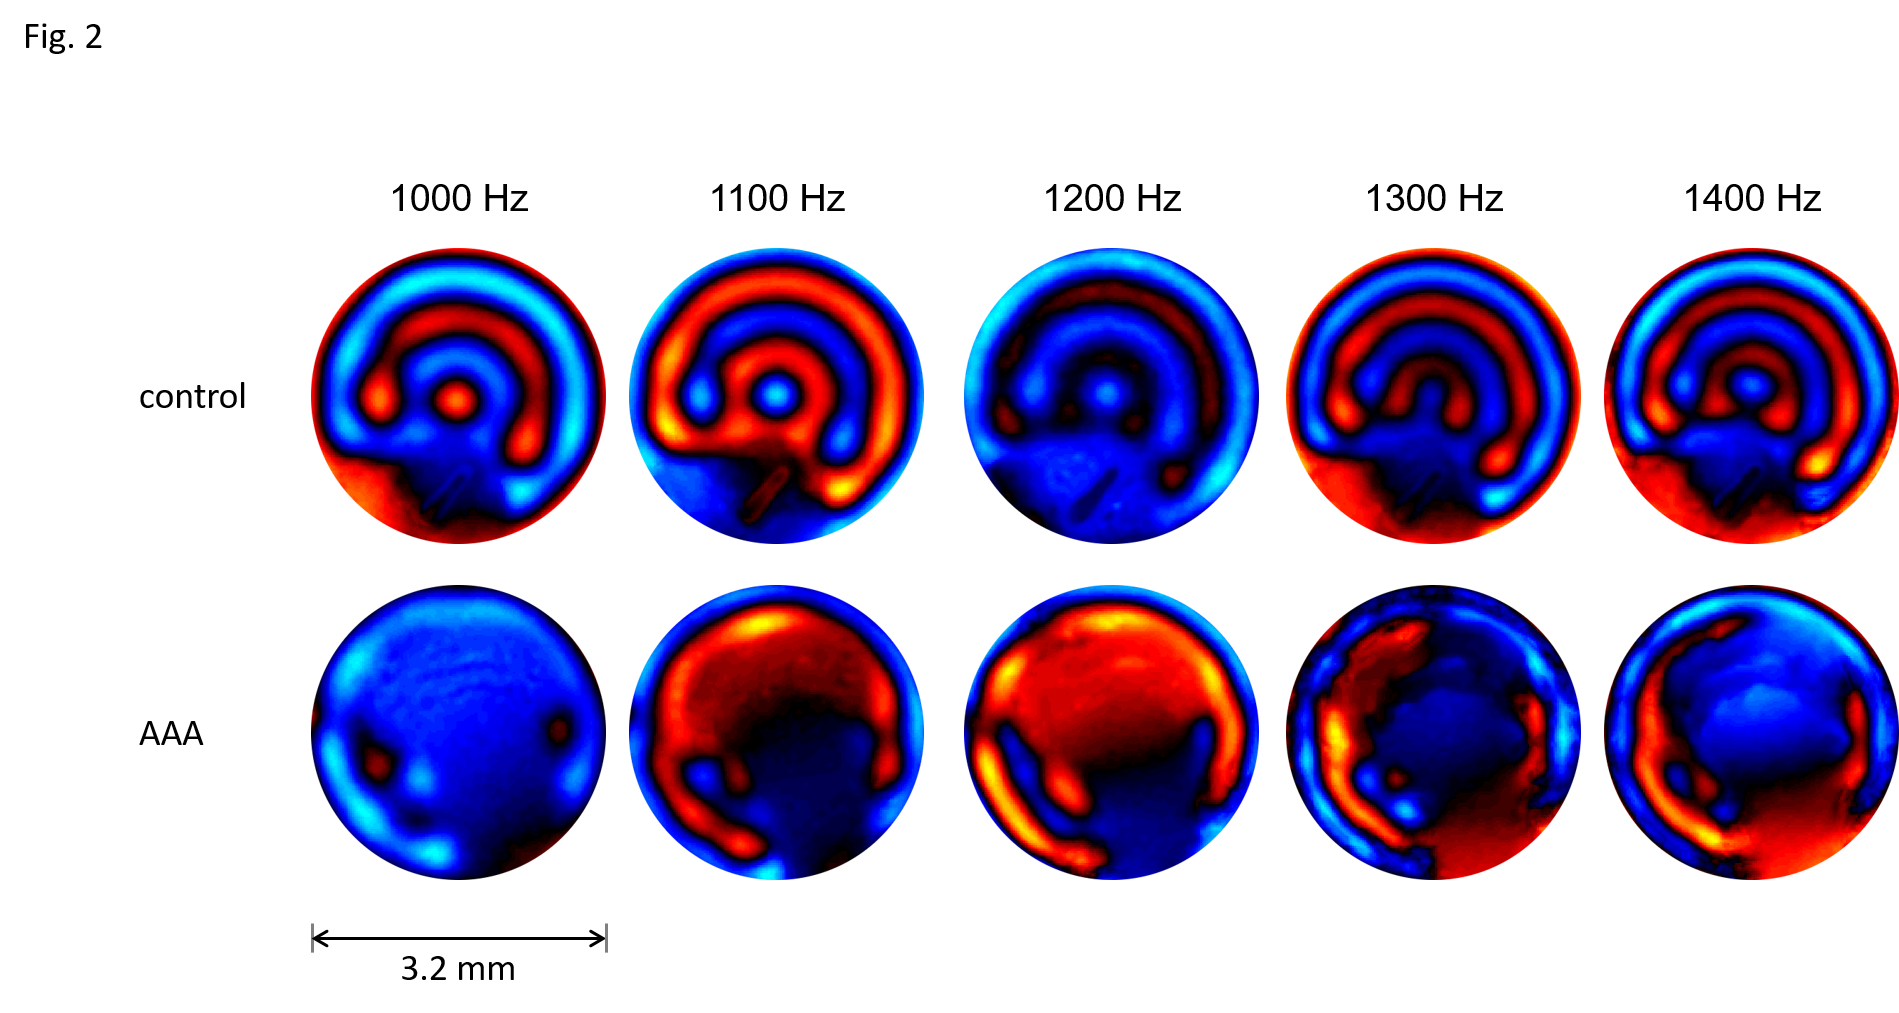
MRE of tissue samples was conducted on a 7T small animal MRI scanner (Bruker Biospec, Ettlingen, Germany) using a 20‐mm‐diameter 1H‐RF quadrature volume coil (RAPID Biomedical, Würzburg, Germany). Mechanical oscillations with 1000, 1100, 1200, 1300 and 1400 Hz frequency were induced into the sample as shown in Fig.1b by a custom made driver setup11. Wave images were acquired in a transversal view using a multi-shot spin-echo MRE sequence equipped with sinusoidal motion encoding gradients (MEG) parallel to the slice select axis of the scanner. The frequency of the MEG was identical to the vibration frequency. Further acquisition parameters were: 1400ms repetition time (TR), 30ms echo time (TE), 100x100 matrix size, 4.0x4.0 mm2 field of view (FoV), 40 µmx40 µm in-plane resolution and 0.6 mm slice thickness. Total acquisition time for all 5 vibration frequencies, each of which sampled with 4 wave dynamics, was approximately 1h. Shear wave speed (SWS) maps as a surrogate of stiffness were generated from the complex-valued wave images using multifrequency wave-number inversion (k-MDEV)11.
RESULTS
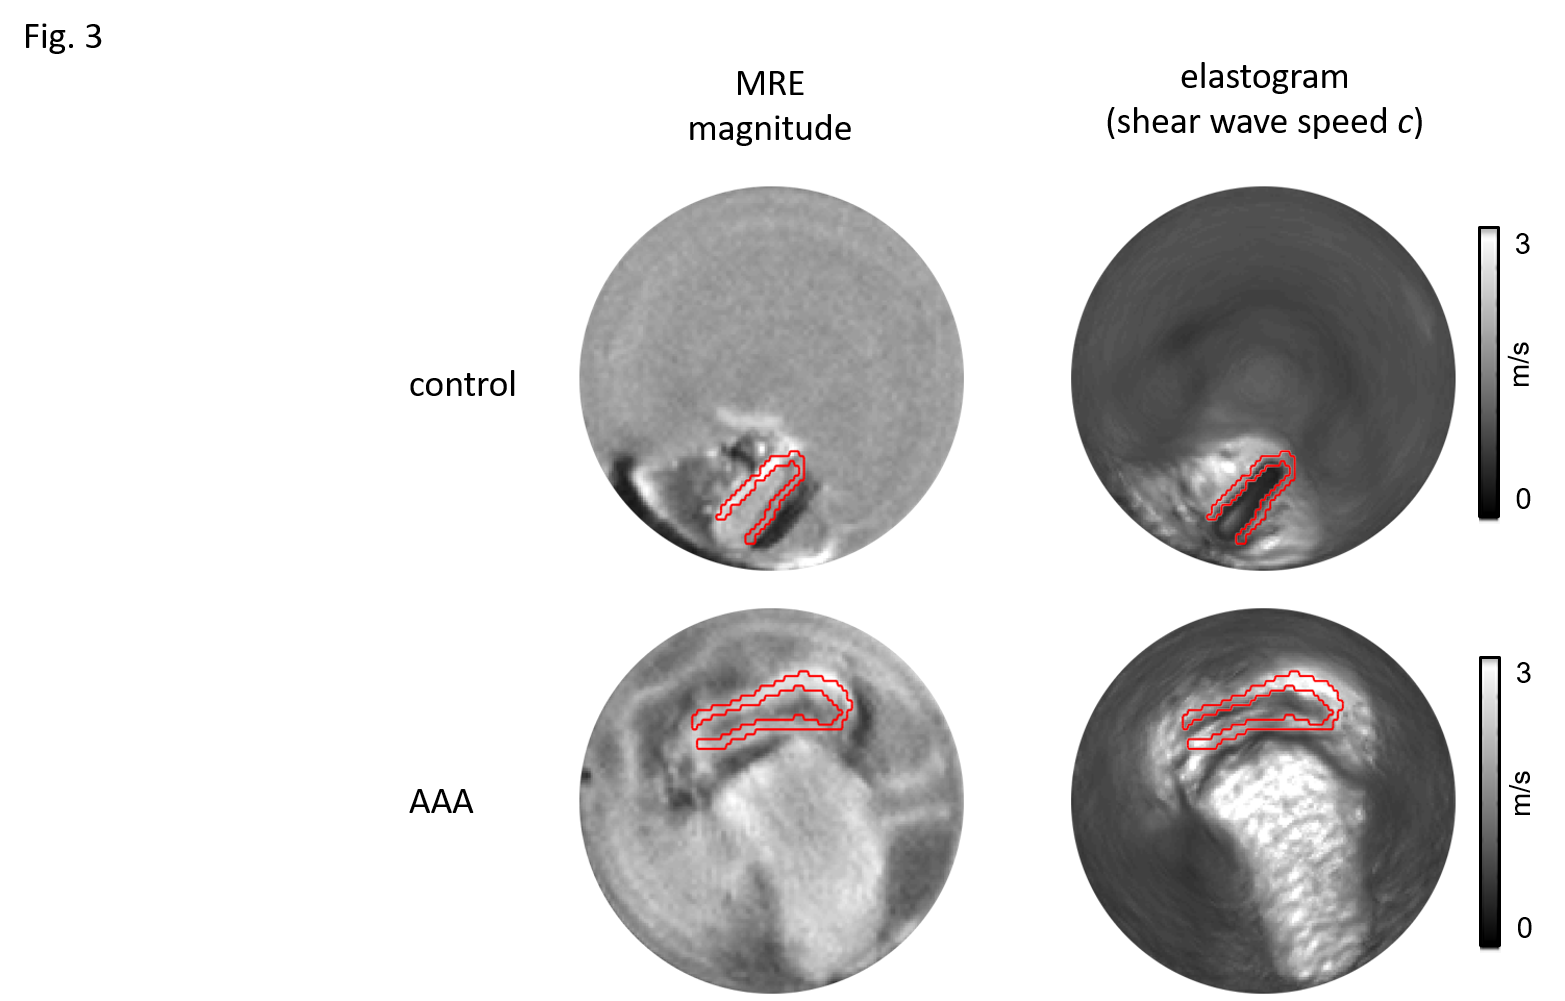
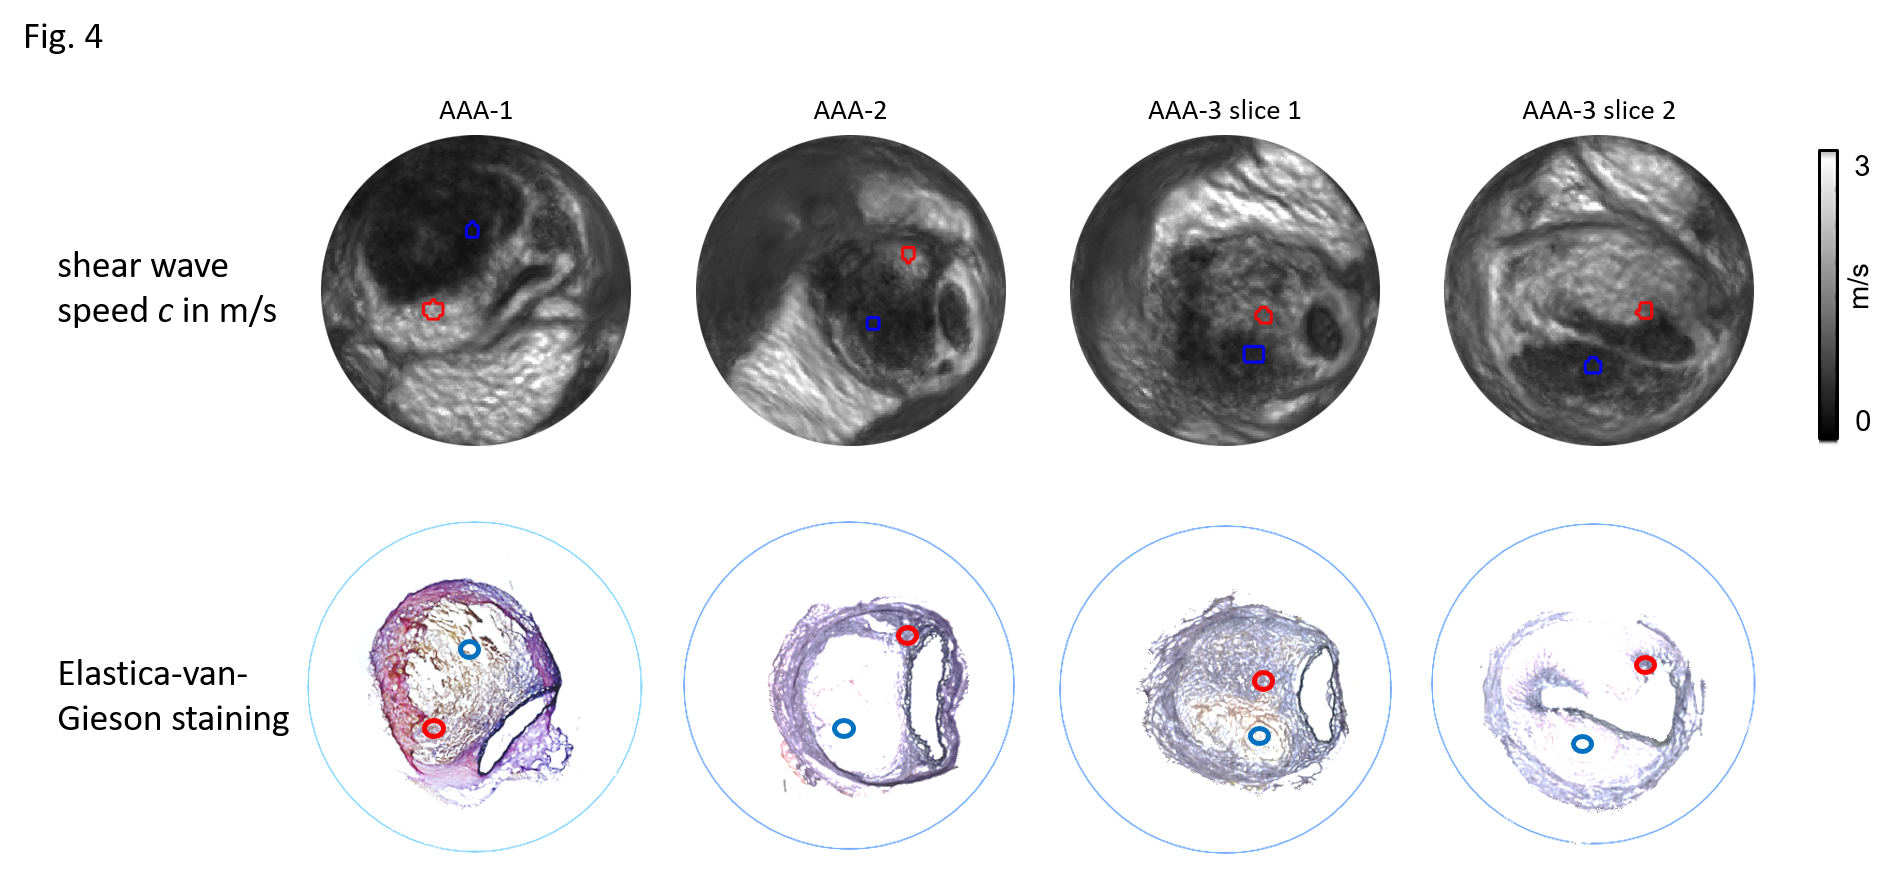
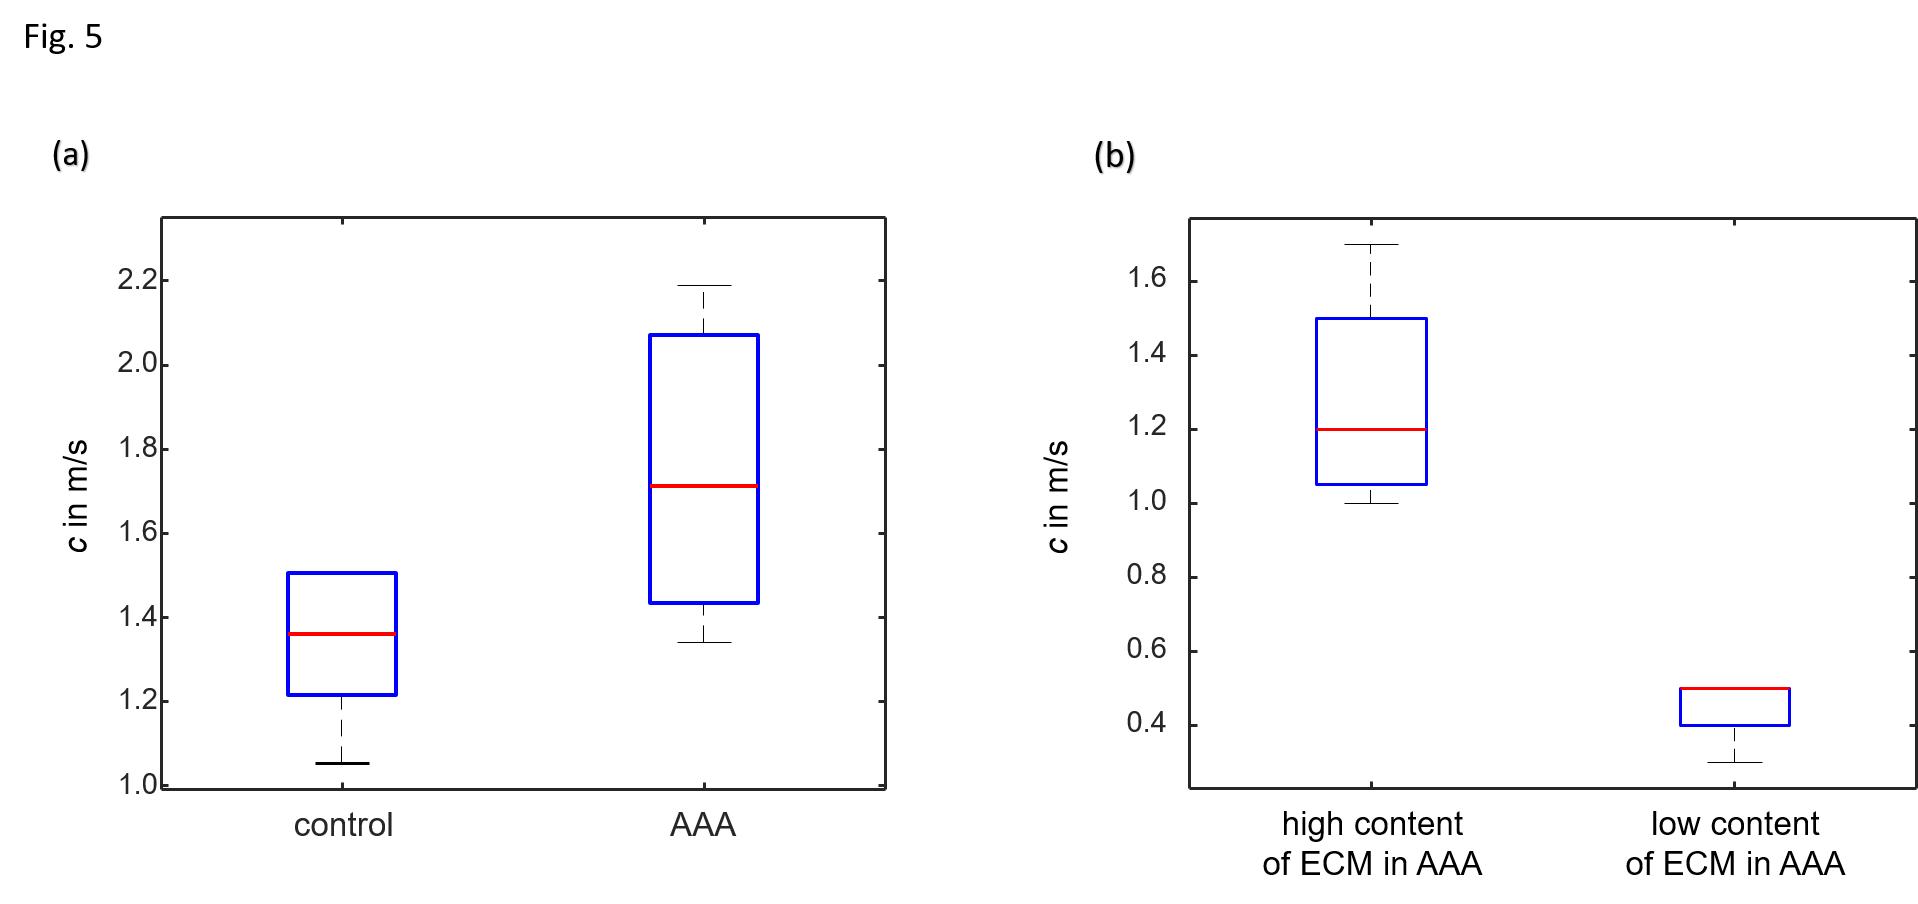
3 out of the 6 animals that underwent surgery developed an AAA, the other animals were excluded from the study. Representative wave images (real part) of a control aorta and an AAA, both embedded in ultrasound gel are shown in Fig.2. Fig.3 shows the corresponding MRE magnitude image (T2-weighted) and the calculated SWS (elastogram) as surrogate of tissue stiffness. Regions of interest (ROIs) are demarcated in red and show segmentations of the vessel walls, respectively. Slip interfaces between the vessel wall and the liquid-filled lumen led to reduced stiffness values in the elastogram which appear as a dark ring-shaped structure near the vessel wall. Based on Elastica-van-Gieson stainings in AAA, Fig.4 shows increased SWS in areas of ECM accumulation compared to ECM-poor regions. Mean SWS in aortic walls of controls and AAA was 1.45±0.40 m/s and 1.75±0.41 m/s, respectively (Fig.5a). Regional analysis of SWS in three AAA specimen (Fig.5b) revealed mean SWS of 1.28±0.28 m/s and 0.45±0.09 m/s for ECM-rich and ECM-poor regions, respectively.DISCUSSION
To the best of our knowledge, this is the first MRE study of murine AAAs. We demonstrated that the AAA vessel wall and thrombus can be quantified with high image resolution of 40 µm in-plane pixel size as achieved with multifrequency MRE. Using this technique, we found that the vessel wall stiffness increases in AAA compared to healthy controls and that regional alterations of the amount of ECM in the thrombus correlate to stiffness in MRE. This is in agreement with MRE studies recently published for a porcine model of AAA12. The amount and structure of elastin in AAA is affected by increased degradation and altered synthesis13. The consequences are twofold: in the vessel wall, the decreased amount of elastin leads to reduced stability and progressive dilatation; in the thrombus, an increase in elastin expression and a higher total amount of ECM serve as a compensatory repair mechanism and reduce the risk of rupture1,14,15. Our encouraging results need to be validated in further studies to correlate AAA stiffness with the risk of vascular rupture.CONCLUSION
Using MRE with 40 µm resolution, we were able to map stiffness in AAA murine model. This proof-of-concept is an important step towards MRE as an image marker for pathological remodeling of the ECM and related stiffness changes in patients with AAA.Acknowledgements
Funding from the German Research Foundation (GRK 2260 BIOQIC, Projektnummer 372486779, SFB1340 Matrix in Vision) is gratefully acknowledged.References
1 Sakalihasan, N., Limet, R. & Defawe, O. D. Abdominal aortic aneurysm. The Lancet 365, 1577-1589, doi:10.1016/s0140-6736(05)66459-8 (2005).
2 Virani, S. S. et al. Heart Disease and Stroke Statistics-2020 Update: A Report From the American Heart Association. Circulation 141, e139-e596, doi:10.1161/CIR.0000000000000757 (2020).
3 Lederle, F. A. et al. Immediate repair compared with surveillance of small abdominal aortic aneurysms. N Engl J Med 346, 1437-1444, doi:10.1056/NEJMoa012573 (2002).
4 Vorp, D. A. & Vande Geest, J. P. Biomechanical determinants of abdominal aortic aneurysm rupture. Arterioscler Thromb Vasc Biol 25, 1558-1566, doi:10.1161/01.ATV.0000174129.77391.55 (2005).
5 Schaafs, L. A. et al. Ultrasound Time-Harmonic Elastography of the Aorta: Effect of Age and Hypertension on Aortic Stiffness. Invest Radiol 54, 675-680, doi:10.1097/RLI.0000000000000590 (2019).
6 Schaafs, L. A. et al. Steady-State Multifrequency Magnetic Resonance Elastography of the Thoracic and Abdominal Human Aorta-Validation and Reference Values. Invest Radiol 55, 451-456, doi:10.1097/RLI.0000000000000654 (2020).
7 Khan, S., Fakhouri, F., Majeed, W. & Kolipaka, A. Cardiovascular magnetic resonance elastography: A review. NMR Biomed 31, e3853, doi:10.1002/nbm.3853 (2018).
8 Kolipaka, A. et al. Quantification and comparison of 4D-flow MRI-derived wall shear stress and MRE-derived wall stiffness of the abdominal aorta. J Magn Reson Imaging 45, 771-778, doi:10.1002/jmri.25445 (2017).
9 Lu, H. et al. Subcutaneous Angiotensin II Infusion using Osmotic Pumps Induces Aortic Aneurysms in Mice. J Vis Exp, doi:10.3791/53191 (2015).
10 Robbins, N., Thompson, A., Mann, A. & Blomkalns, A. L. Isolation and excision of murine aorta; a versatile technique in the study of cardiovascular disease. J Vis Exp, e52172, doi:10.3791/52172 (2014).
11 Bertalan, G. et al. Fast tomoelastography of the mouse brain by multifrequency single-shot MR elastography. Magn Reson Med 81, 2676-2687, doi:10.1002/mrm.27586 (2019).
12 Dong, H. et al. In Vivo Aortic Magnetic Resonance Elastography in Abdominal Aortic Aneurysm: A Validation in an Animal Model. Invest Radiol 55, 463-472, doi:10.1097/RLI.0000000000000660 (2020).
13 Sakalihasan, D., Nusgens, Limet, Lapière. Activated forms of MMP2 and MMP9 in abdominal aortic aneurysms. J. Vasc. Surg 24 127-133 (1996).
14 Brangsch, J. et al. Concurrent Molecular Magnetic Resonance Imaging of Inflammatory Activity and Extracellular Matrix Degradation for the Prediction of Aneurysm Rupture. Circ Cardiovasc Imaging 12, e008707, doi:10.1161/CIRCIMAGING.118.008707 (2019).
15 Botnar, R. M. et al. In vivo assessment of aortic aneurysm wall integrity using elastin-specific molecular magnetic resonance imaging. Circ Cardiovasc Imaging 7, 679-689, doi:10.1161/CIRCIMAGING.113.001131 (2014).
Figures