1002
Micro MR elastography of the zebrafish brain1Department of Radiology, Charité - Universitätsmedizin Berlin, Berlin, Germany, 2Department of Hematology/Oncology, Charité - Universitätsmedizin Berlin, Berlin, Germany, 3Institute of Medical Informatic, Charité - Universitätsmedizin Berlin, Berlin, Germany
Synopsis
Zebrafish have emerged as a versatile, cost-efficient and easy-to-handle animal model in many areas of biomedical research. Using multifrequency MR elastography at 7-Tesla and 1000 to 1400 Hz excitation frequency, we analyzed the viscoelastic properties of the post-mortem zebrafish brain. Shear wave speed as a surrogate marker of stiffness was mapped with an in-plane resolution of 40 microns showing stiffer properties (1.2±0.3 m/s) of the brain than skeletal muscle (0.89±0.09 m/s). Furthermore, sub-regions showed distinct stiffness properties, which, however, lacked significance in this preliminary feasibility study.
Introduction
Over the past four decades, Zebrafish (Danio rerio) have emerged as a versatile animal model in developmental research, muscle regeneration2, toxicology3 and more recently, cancer research1. The zebrafish genome is remarkably similar to that of humans. 70% of its genes have homologs to the human genome and 82% of genes associated with human diseases have also been found in zebrafish4. In addition, the optical transparency of zebrafish embryos and some adult genetic mutants, high fecundity, rapid growth rate, and comparative ease of husbandry make the zebrafish an attractive animal model for biomedical research. Common methods to investigate zebrafish include optical microscopy and cell analysis1. Biophysical parameters such as stiffness of zebrafish tissue have been reported based on invasively administered beads5 and optical tweezer experiments6. However, due to the local nature of this approach and surface-limited optical microscopy, no maps of stiffness of the zebrafish brain have been reported so far. Magnetic resonance elastography (MRE) has been widely used to measure viscoelastic properties in human and animal soft tissue. Preliminary elastography data of zebrafish have been reported by ultrasound elastography (US)7, however without providing spatially resolved stiffness maps. In this study, we aim to apply high-resolution multifrequency MRE for stiffness mapping of the adult zebrafish brain. Our aim is to provide first reference stiffness data of the zebrafish brain including spatially resolved maps for sub-regional analysis.Methods
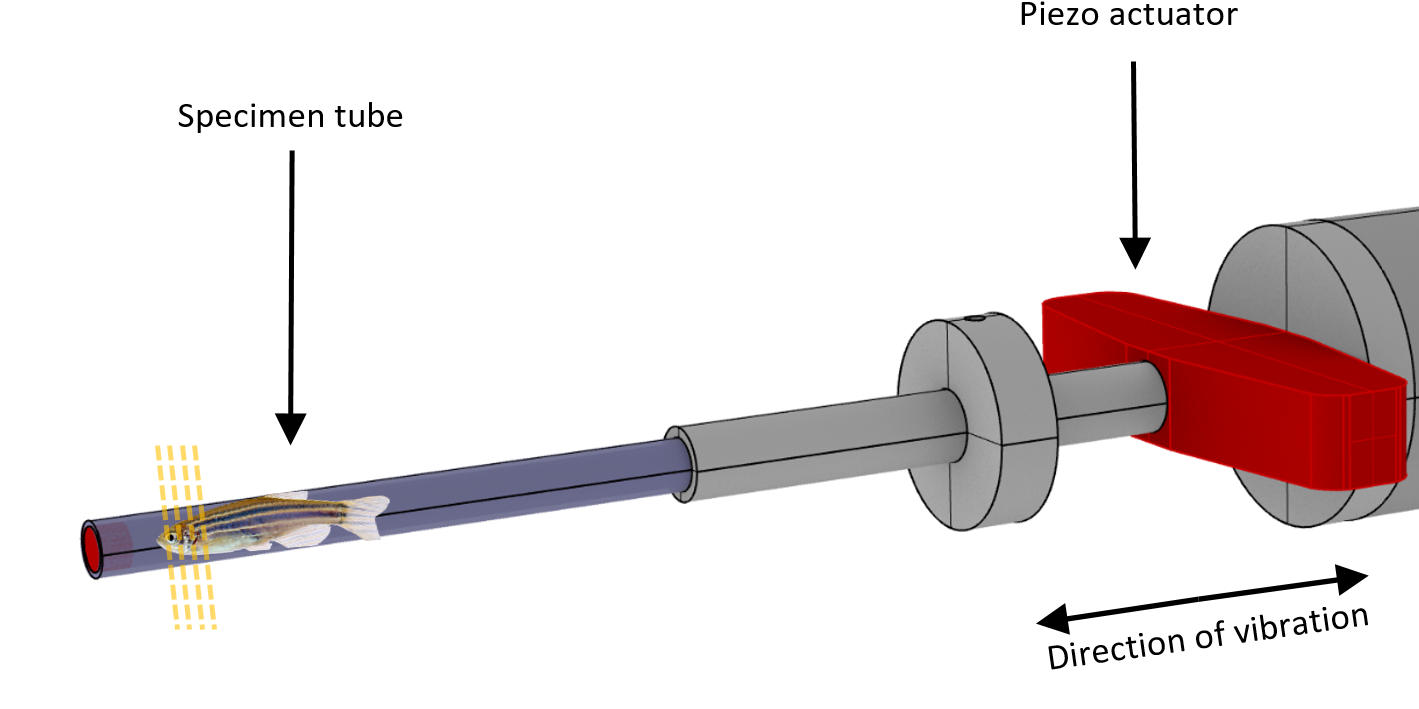
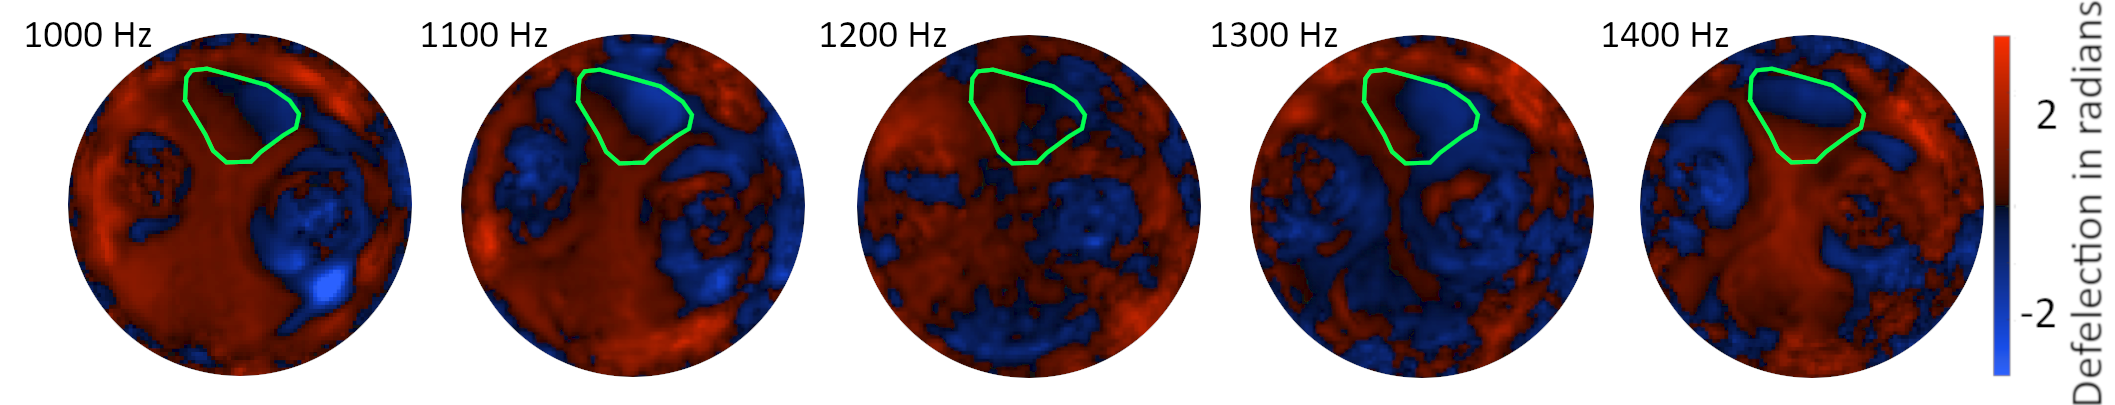
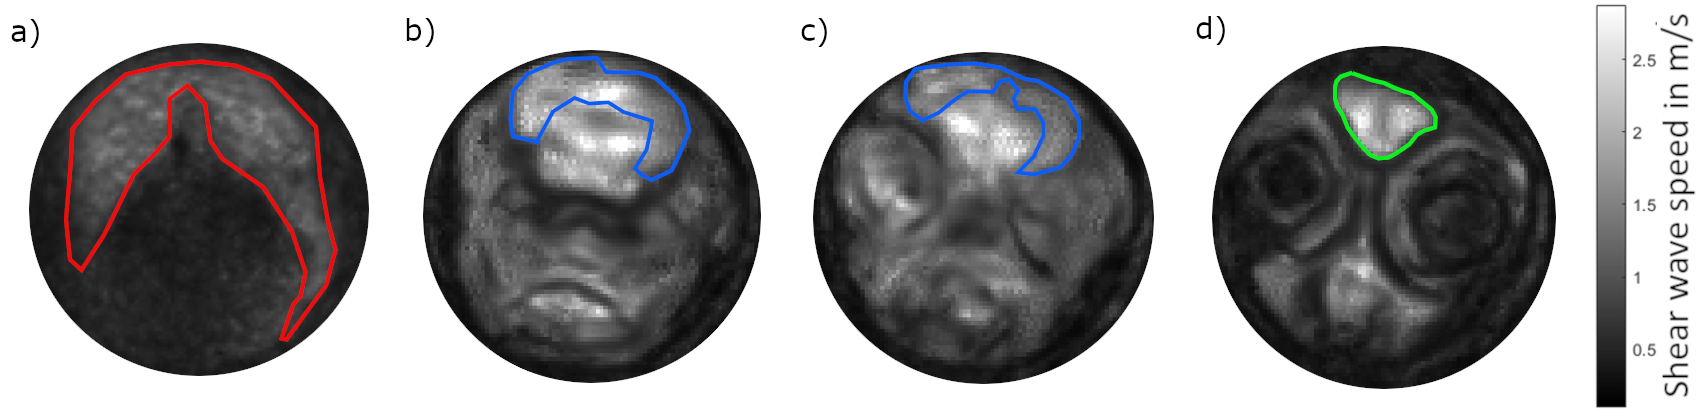
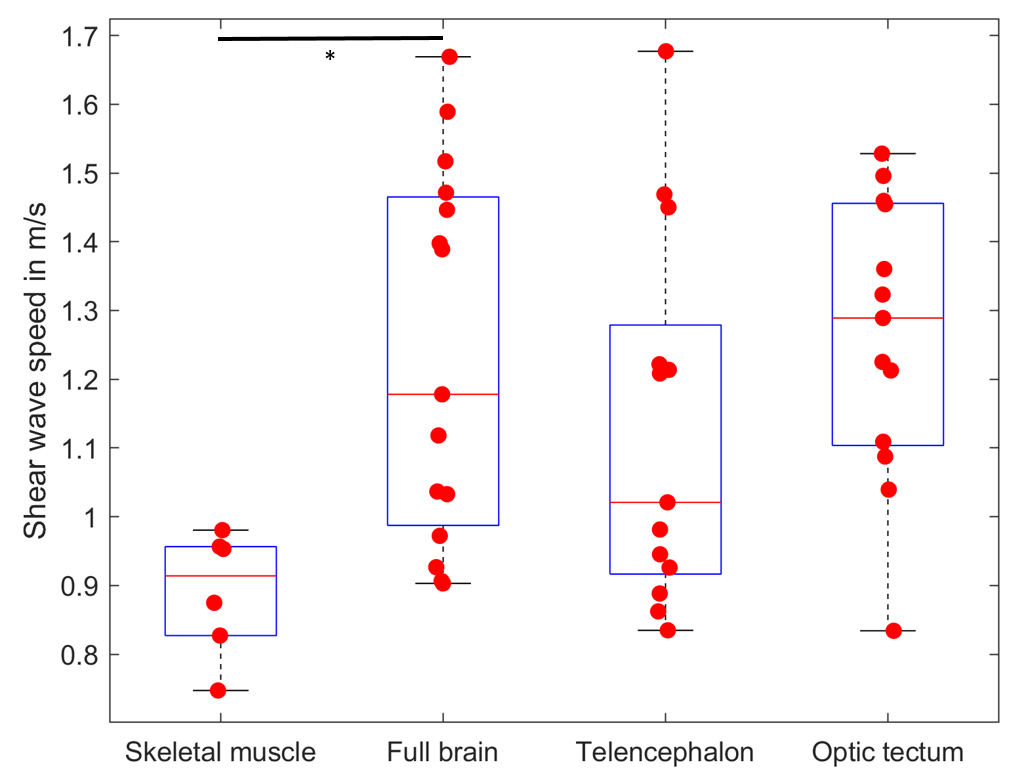
20 adult zebrafish of 2 to 24 months of age were killed by submersion in ice water for at least 3 minutes8, embedded in ultrasound gel and placed in a glass tube of 4 mm inner diameter. The glass tube was mounted on a nonmagnetic piezo ceramic actuator (CEDRAT Technologies, France) as illustrated in figure 1. The actuator was driven by a function generator (CGC Instruments, Germany) in synchrony to the clock of the MRI scanner. Imaging was performed in a 7T preclinical MRI scanner (Bruker Biospec, Germany) with a custom built, 5 mm bore volume resonator by RAPID Biomedical (Rimpar, Germany). The scanner was running on ParaVision 6.0.1 and we measured our samples with an in-house MRE sequence based on a spin-echo sequence. Using the piezo actuator, we induced harmonic vibration of 1.0, 1.1, 1.2, 1.3 and 1.4 kHz frequency which were encoded with 14, 15, 17, 18 and 19 cycles of a bipolar motion encoding gradient which was synchronized to the vibration. The samples were measured with a voxel size of 40 × 40 × 600 µm³, a field of view of 4 × 4 mm, an echo time (TE) of 38 ms and a relaxation time (TR) of 3000 ms. Four dynamics of the wave were captured evenly spaced over a vibration period. Total measure time was approx. 20 minutes for each frequency. The resulting complex wave images were inverted to shear wave speed (SWS) maps using multifrequency wave-number reconstruction (k-MDEV)9. The SWS maps were then analyzed for sub-regional differences by manually delineating the following anatomical regions of interest (ROI): whole brain, telencephalon, optic tectum and skeletal muscle. Statistical significance was assessed by the Wilcoxon rank sum test.Results
Figure 2 shows representative wave images for each frequency (taken from slice b) in Figure 3). Good wave propagation though the brain is visible. Figure 3 shows the resulting SWS map of a one year old zebrafish. The optic tectum, telencephalon, eyes and mouth are easily identifiable by their distinct stiffness properties. Figure 4 shows mean SWS values for each investigated fish and region. Mean SWS values of brain regions were 1.2 ± 0.3 m/s, 1.1 ± 0.3 m/s, 1.3 ± 0.2 m/s for the whole brain, telencephalon, and optic tectum, respectively. No significant difference was found between the different brain regions. In contrast, with a mean SWS of 0.89 ± 0.09 m/s, skeletal muscle was softer than brain tissue (p<0.05).Discussion & Conclusion
To the best of our knowledge, this study presents for the first time spatially resolved SWS maps of the adult zebrafish. In a recent study, SWS of the zebrafish was reported based on ultrasound elastography, however, without spatial resolution7. The reported values (5.07 ± 1.45 m/s) obtained at 500 Hz excitation frequency were higher than our values despite that values were averaged across muscle and brain. More experiments are needed to address viscoelastic dispersion, regional difference and a possible age effect. Nevertheless, this preliminary proof-of-concept study expands the range of possible MRE applications into zebrafish, which is an established animal model for a wide variety of diseases.Acknowledgements
This research was supported by GRK2260 (BIOQIC) of the German Research Foundation.References
1. Gauert, A. et al. Fast, in vivo model for drug-response prediction in patients with b-cell precursor acute lymphoblastic leukemia. Cancers (Basel). 12, 1–13 (2020).
2. Poss, K. D., Wilson, L. G. & Keating, M. T. Heart regeneration in zebrafish. Science (80-. ). 298, 2188–2190 (2002).
3. Lammer, E. et al. Is the fish embryo toxicity test (FET) with the zebrafish (Danio rerio) a potential alternative for the fish acute toxicity test? Comp. Biochem. Physiol. - C Toxicol. Pharmacol. 149, 196–209 (2009).
4. Howe, K. et al. The zebrafish reference genome sequence and its relationship to the human genome. Nature 496, 498–503 (2013).
5. Träber, N. et al. Polyacrylamide Bead Sensors for in vivo Quantification of Cell-Scale Stress in Zebrafish Development. Sci. Rep. 9, 1–14 (2019).
6. Hörner, F. et al. Holographic optical tweezers-based in vivo manipulations in zebrafish embryos. J. Biophotonics 10, 1492–1501 (2017).
7. Zhang, X., Zhang, A. X., Zhou, B. & Xu, X. A feasibility study fornoninvasive measurement of shear wave speed in live zebrafish. Ultrasonics 107, 106170 (2020).
8. Wallace, C. K. et al. Effectiveness of Rapid Cooling as a Method of Euthanasia for Young Zebrafish ( Danio rerio ). 57, (2018).
9. Tzschätzsch, H. et al. Tomoelastography by multifrequency wave number recovery from time-harmonic propagating shear waves. Med. Image Anal. 30, 1–10 (2016).
Figures