1000
Are multiple sclerosis lesions stiffer or softer than surrounding brain tissue?1Experimentelle Radiologie, Charité Universitätsmedizin Berlin, Berlin, Germany, 2Berlin Center for Advanced Neuroimaging (BCAN), Berlin, Germany, 3NeuroCure Clinical Research Center and Clinical and Experimental Multiple Sclerosis Research Center, Berlin, Germany, 4Institut für medizinische Informatik, Charité Universitätsmedizin Berlin, Berlin, Germany
Synopsis
Using multifrequency MR elastography with 2- and 1.5mm resolutions in a cohort of 19 patients with multiple sclerosis and a total 206 analyzed lesions we found no evidence for systematic differences in the viscoelastic properties between MS lesions and surrounding brain tissue. Although future technical improvements in MRE resolution and parameter reconstruction methods might reveal significant differences between lesion and brain properties, our results indicate that those differences are minor compared to other published changes in brain viscoelasticity of the human brain.
Introduction
Magnetic resonance elastography(MRE) is a noninvasive method for the mechanical characterization of brain tissue[1,2]. MRE has been used to study brain mechanical behavior under physiologic and pathologic conditions including Multiple sclerosis(MS, Encephalomyelitis disseminata)[3,4].It was shown that whole brain stiffness is reduced in MS patients, and concluded that inflammation and demyelination may have affected the integrity of tissue in the brain[5-8]. Furthermore, MRE in preclinical mouse models and ex-vivo specimens revealed the importance of myelination[9,10] and astrocytic-vascular junctions to brain stiffness[11].
However, little is known about the stiffness of MS lesions. Neuropathologists characterized MS lesions by manual palpation and reported that acute active lesions have soft properties while chronic inactive lesions have firm properties[12]. A preliminary MRE-study indicated that in-vivo MS lesions behave softer than surrounding white matter[13].
Our aim is to investigate the possibility to differentiate MS lesions from surrounding tissue by MRE. Therefore, we analyzed the image contrast of MS lesions, generated by MRE and diffusion imaging as a complementary biophysical parameter[14]. To check the stability of our results, we applied two different MRE protocols with 2-mm and 1.5-mm in-plane resolution.
Methods
Nineteen patients (42±12years) with relapsing-remitting MS under pharmaceutical treatment were investigated by multifrequency MRE using an EPI sequence at a 3.0-Tesla scanner (Siemens-Prisma). Eight phase offsets over one vibration period were recorded with vibrations at 20,25,30,40 and 50 Hz[15].One subgroup (G1, n=11) was examined with 200x200mm2 field-of-view, 2x2x2mm3 voxel size, echo time (TE)=78ms and repetition time (TR)=4680ms. The other (G2, n=8) was examined with 192x192mm2 field-of-view, 1.5x1.5x2mm3 voxel size, TE=66ms and TR=4100ms.
Magnitude |G*| and phase angle φ of the complex shear modulus were reconstructed with multifrequency dual elasto-visco inversion[16](https://bioqic.de/bioqic-server/[17]).
Mean diffusivity(MD) was measured with a conventional diffusion-weighted EPI sequence. Motion correction, registration of MD images and segmentation was done using SPM12[18]. Lesions were segmented by a neuroradiologist based on T2/T2*-weighted MRE images. In total, 206 lesions were analyzed (G1=133,G2=73).
For comparing |G*|, φ, MD and T2w-intensity of MS lesions with surrounding tissue, a further mask with one voxel distance to the lesion and one voxel thickness was automatically generated. CSF and other lesions were excluded from this mask. Mean values for the lesion and the surrounding tissue were calculated and the relative intensity difference(rID,contrast) was determined as:
$$rID=\frac{mean(lesion \: intensity)-mean(surrounding\:intensity)}{mean(lesion\:intensity)}$$
To validate if the rID were related to intrinsic lesion properties or normal brain heterogeneity, we flipped the lesion masks onto the opposite hemisphere and repeated the evaluation(spurious lesions). An independent-samples t-test was conducted to compare contrast of true and spurious lesions. Parameter correlation was analyzed by Pearson’s correlation coefficient. P<0.05 was considered significant.
Results
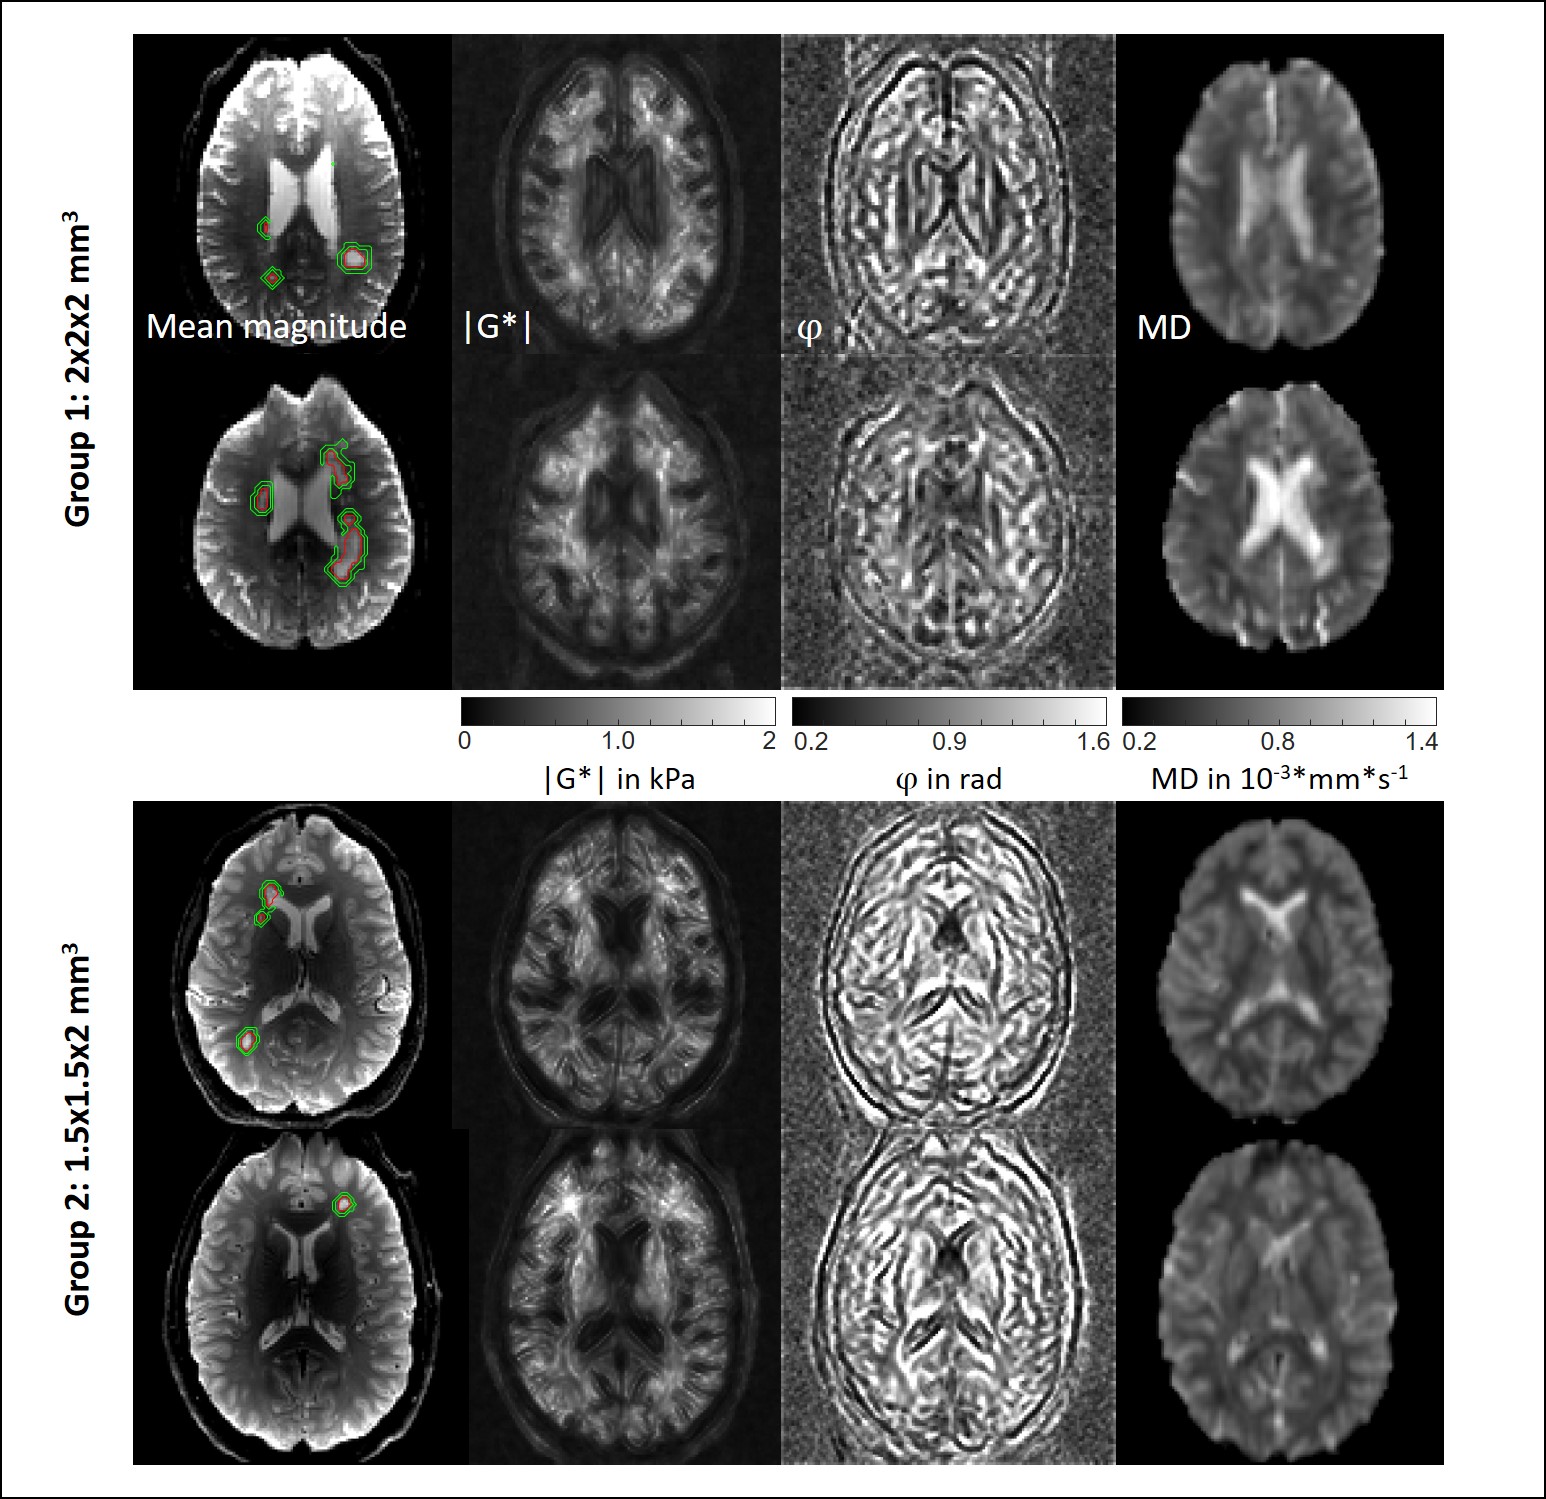
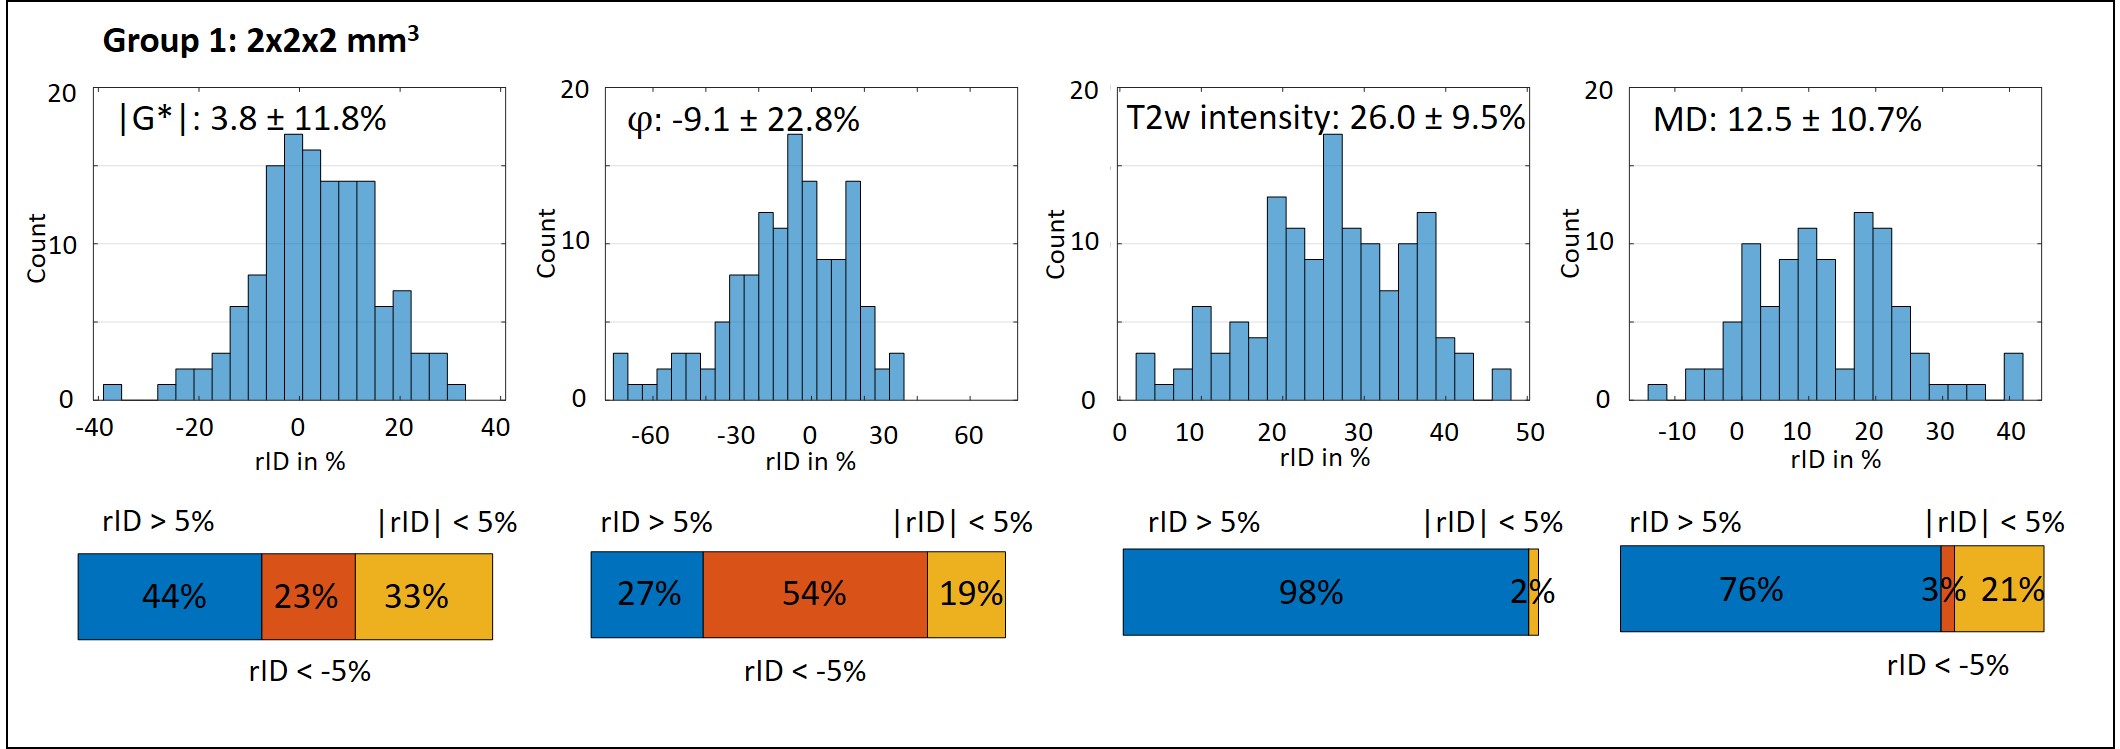
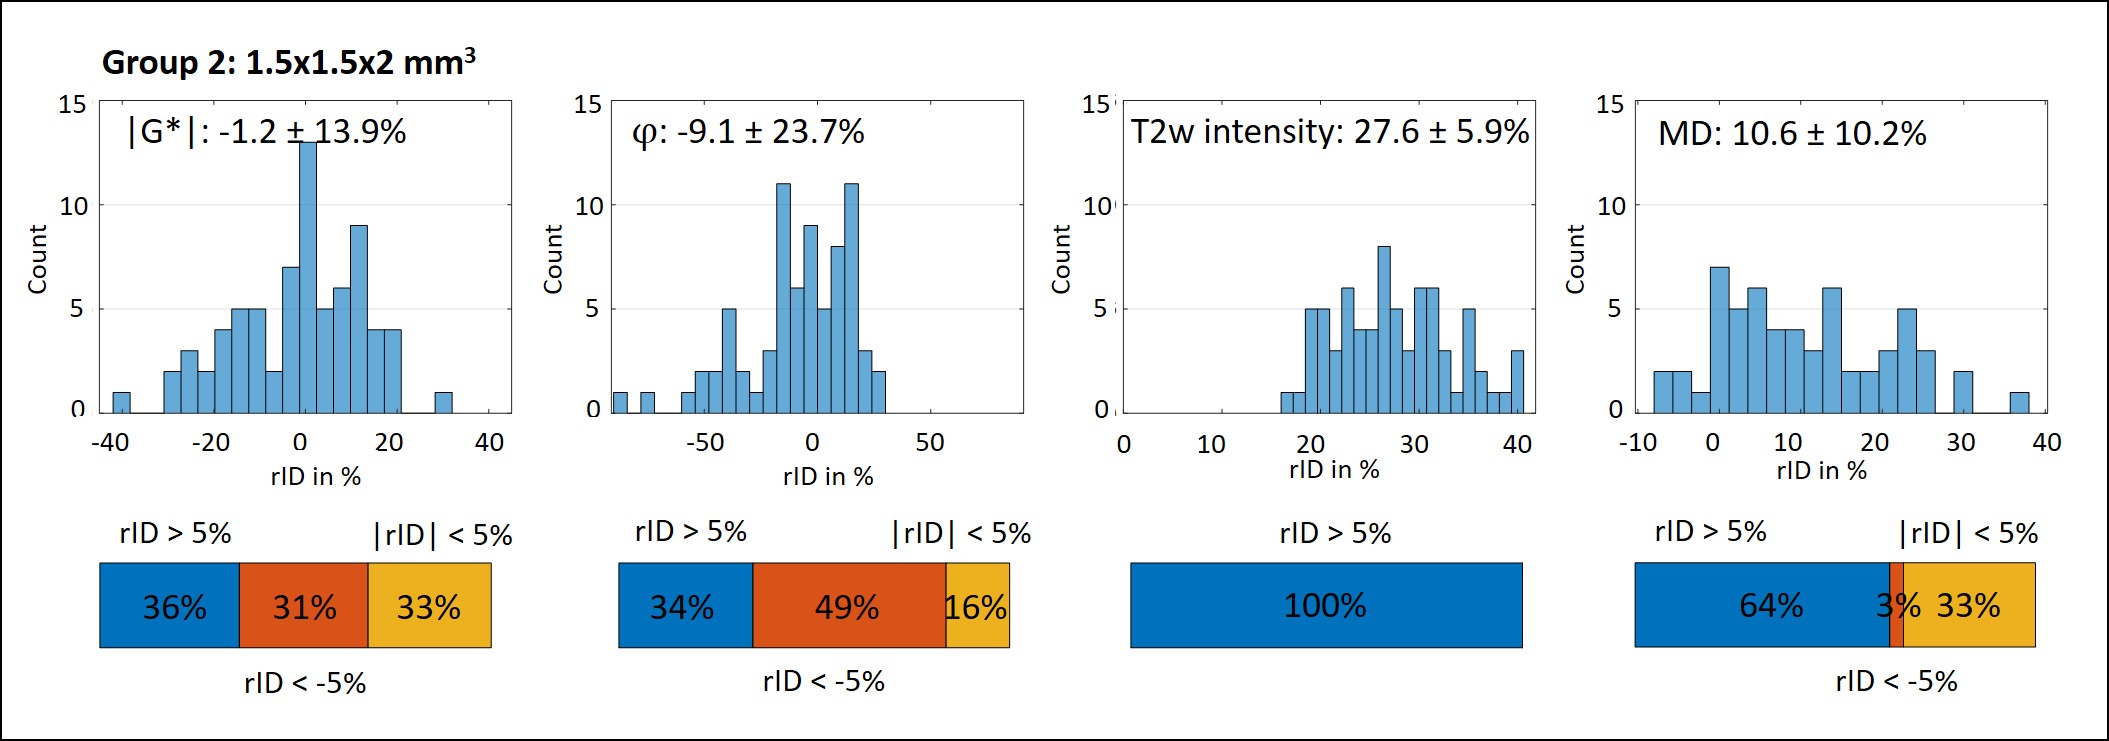
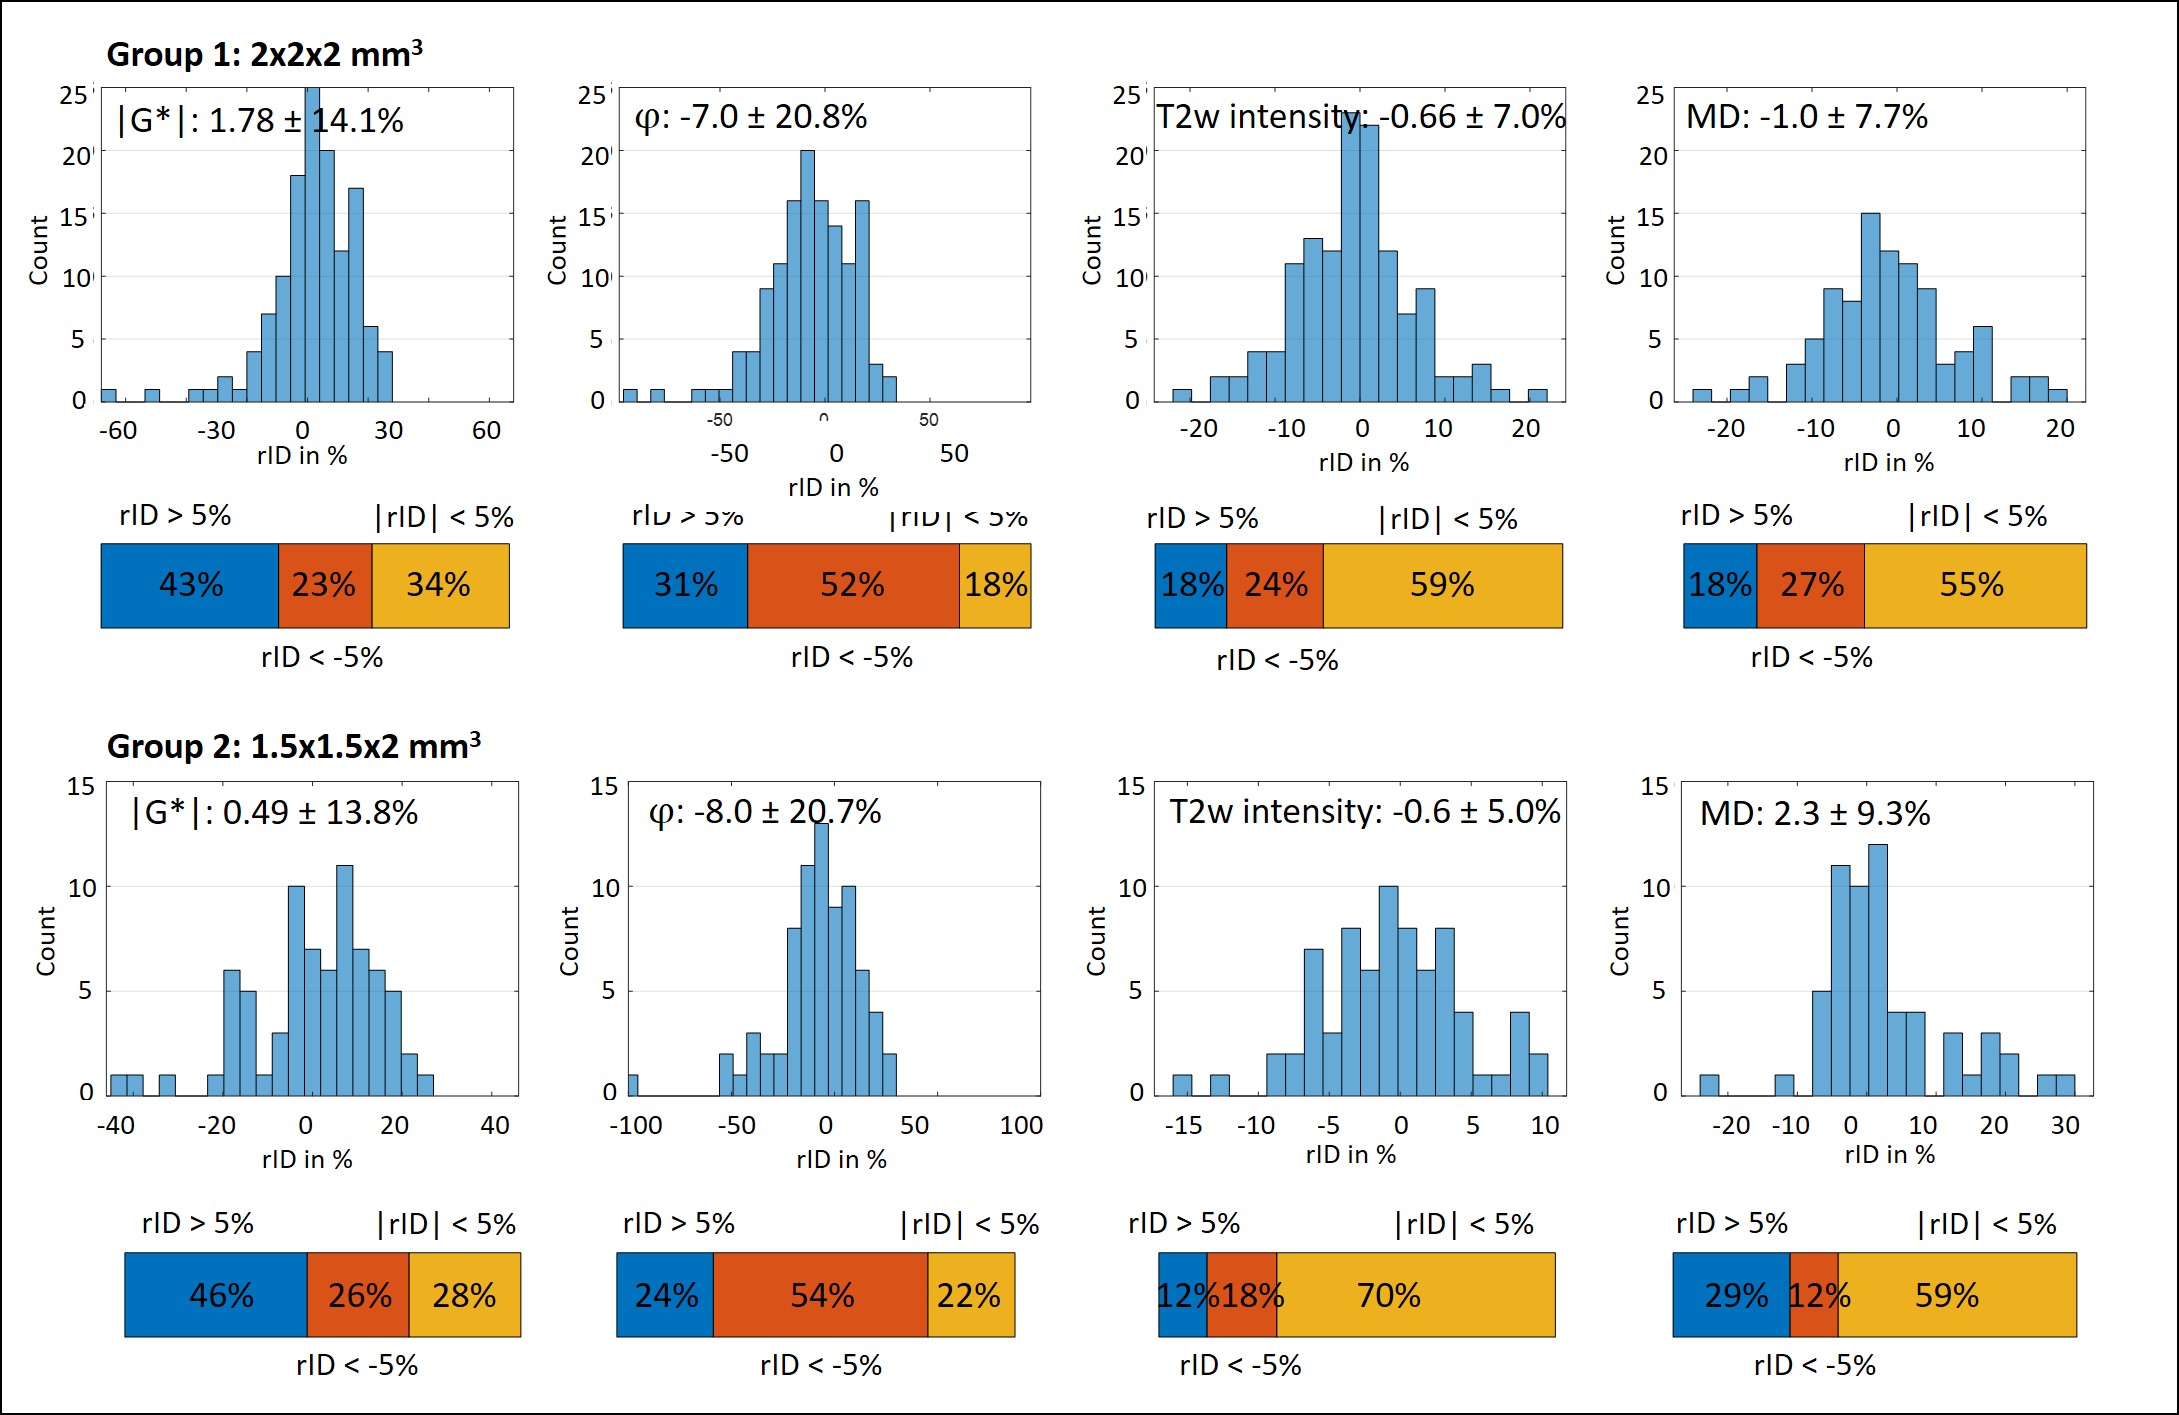
Figure 1 shows MRE magnitude, |G*|, φ and MD in two slices from each subgroup. Lesion and surrounding tissue masks are demarcated in red and green. The lesion appears hyperintense in the MRE magnitude image and MD.In Figure 2 (G1) and 3 (G2), the rID for the lesions is displayed as a histogram indicating normally distributed rID for each parameter and bar-charts with a threshold of 5% to illustrate contrast. Figure 4 shows the same for the spurious lesions. For |G*| and φ there is no significant difference between analyzing true or spurious lesions rID (P=0.32, P=0.43) whereas for T2w-intensity and MD there is a difference (P<1e-5).
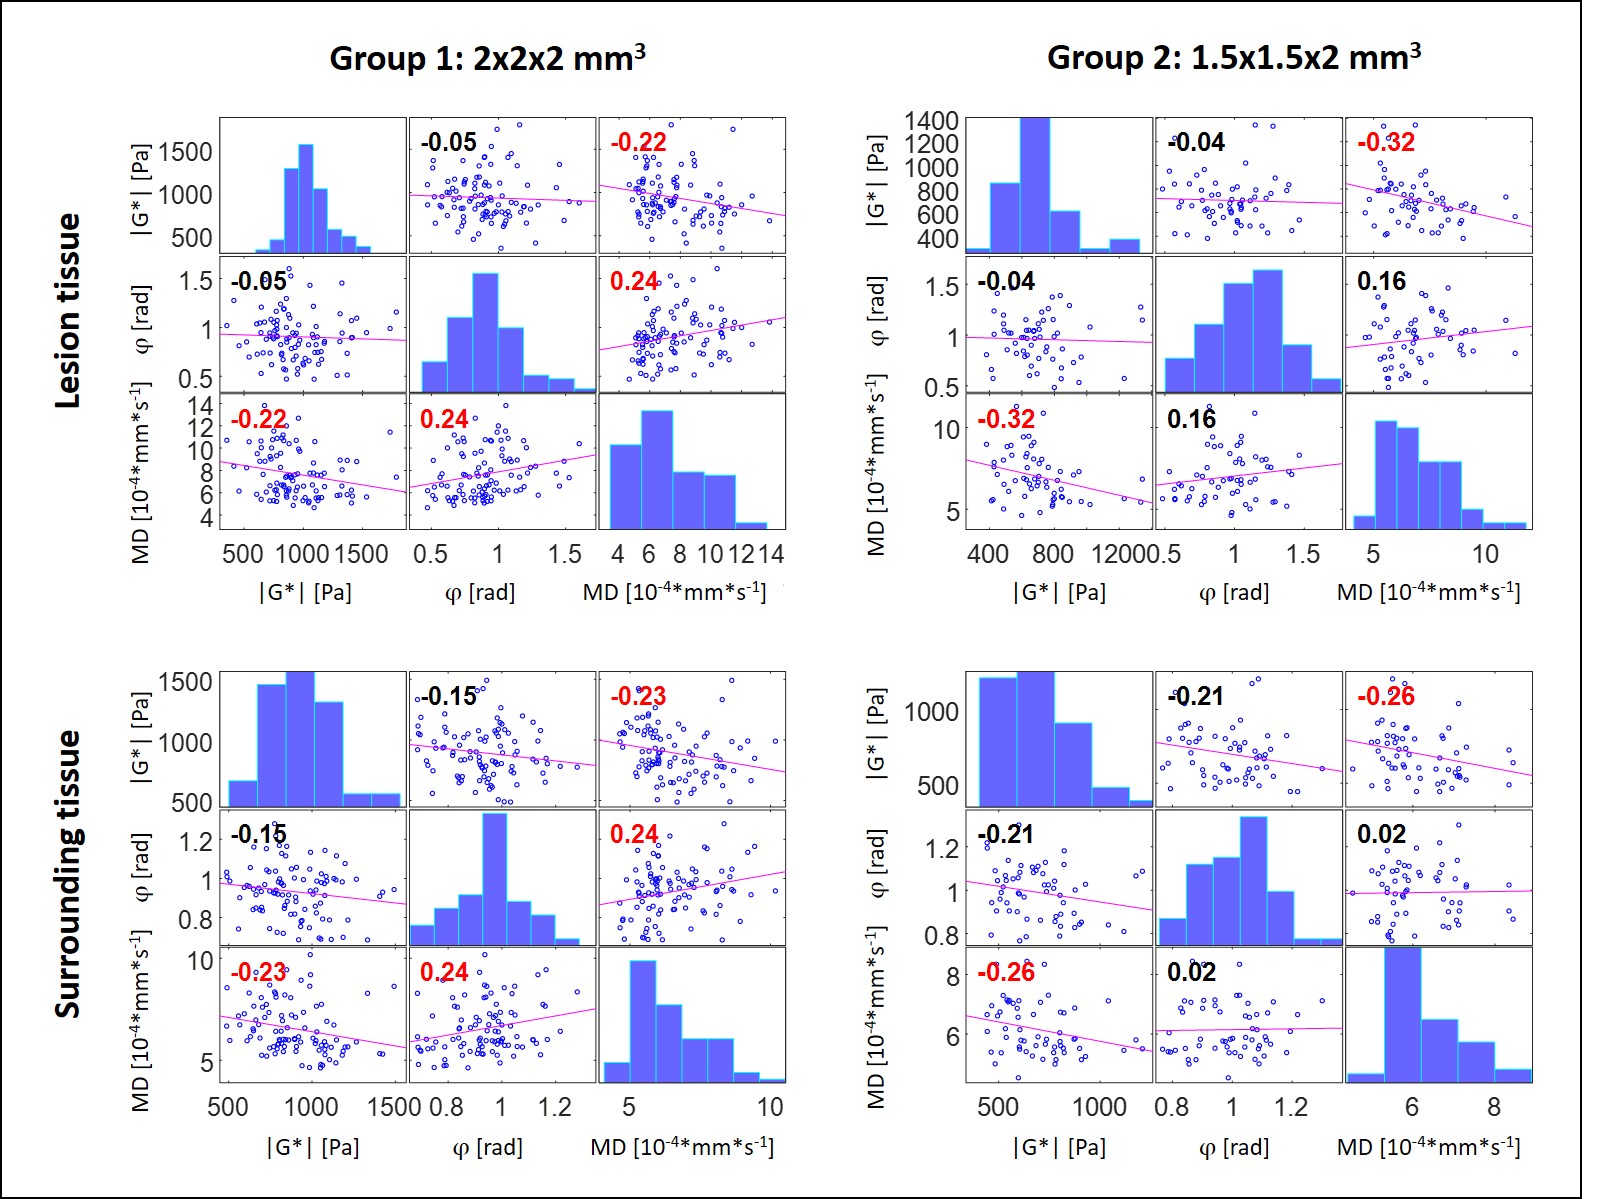
Figure 5 shows the correlation plots for G1 and G2 for all parameters for the lesion site and the surrounding tissue. Red correlation coefficients indicate significance (P<0.05). A slight negative correlation between |G*| and MD was found (P=0.02).
Discussion
To the best of our knowledge this is the first analysis of the imaging contrast generated by MRE in MS lesions that accounts for the marked variability of brain viscoelasticity due to the heterogeneous nature of brain tissue. The fact that MRE parameter maps often appear very heterogeneous imposes challenges to the identification of smaller lesions by eye. Therefore, we automatically processed lesion masks by accounting for (i) the rID between lesion and surrounding tissue and (ii) spurious signal changes due to heterogeneous MRE values in contralateral regions. This strategy allowed us (i) to identify that 44%, 24% and 32% of all analyzed lesions are stiffer, softer or not different to surrounding tissue, respectively, and (ii) that a similar pattern is observed when looking at arbitrary regions throughout the brain. While (i) alone might suggest systematic variation due to a possible diversity of pathologic states of MS lesions in our cohort, (ii) shows that there is no evidence for such systematic pattern. We consider this observation significant as similar results were obtained with 2-mm and 1.5-mm resolution. Nevertheless, since our cohort consisted of patients with chronic MS who underwent medical treatment over longer periods, we cannot exclude that viscoelasticity in MS is locally altered due to acute MS. MD contrast of lesions was mainly hyperintense as expected from literature[19].Conclusion
No evidence for a systematic pattern related to mechanical changes in MS lesions was found with multifrequency MRE at 2- and 1.5mm resolutions. Future technical improvements in MRE resolution and parameter reconstruction methods might reveal significant differences between lesion and brain properties, our results indicated that those differences are minor compared to published pathophysiological effects.Acknowledgements
Funding from the German Research Foundation (GRK 2260 BIOQIC, SFB1340 Matrix in Vision, Sa901/17-2) and from the European Union’s Horizon 2020 Program (ID 668039, EU FORCE – Imaging the Force of Cancer) is gratefully acknowledged.References
1 Yin, Z., Romano, A. J., Manduca, A., Ehman, R. L. & Huston, J., 3rd. Stiffness and Beyond: What MR Elastography Can Tell Us About Brain Structure and Function Under Physiologic and Pathologic Conditions. Top Magn Reson Imaging 27, 305-318, doi:10.1097/RMR.0000000000000178 (2018).
2 Hiscox, L. V., Johnson, C. L., Barnhill, E., McGarry, M. D. J., Huston, J., van Beek, E. J. R., Starr, J. M. & Roberts, N. Magnetic resonance elastography (MRE) of the human brain: technique, findings and clinical applications. Physics in Medicine and Biology 61, R401-R437, doi:10.1088/0031-9155/61/24/R401 (2016).
3 Murphy, M. C., Huston, J., 3rd & Ehman, R. L. MR elastography of the brain and its application in neurological diseases. Neuroimage 187, 176-183, doi:10.1016/j.neuroimage.2017.10.008 (2019).
4 Hirsch, S., Braun, J. & Sack, I. Magnetic Resonance Elastography: Physical Background And Medical Applications. (Wiley-VCH, 2017).
5 Wuerfel, J., Paul, F., Beierbach, B., Hamhaber, U., Klatt, D., Papazoglou, S., Zipp, F., Martus, P., Braun, J. & Sack, I. MR-elastography reveals degradation of tissue integrity in multiple sclerosis. Neuroimage 49, 2520-2525, doi:10.1016/j.neuroimage.2009.06.018 (2010).
6 Streitberger, K. J., Sack, I., Krefting, D., Pfuller, C., Braun, J., Paul, F. & Wuerfel, J. Brain viscoelasticity alteration in chronic-progressive multiple sclerosis. PLoS One 7, e29888, doi:10.1371/journal.pone.0029888 (2012).
7 Fehlner, A., Behrens, J. R., Streitberger, K. J., Papazoglou, S., Braun, J., Bellmann-Strobl, J., Ruprecht, K., Paul, F., Wurfel, J. & Sack, I. Higher-resolution MR elastography reveals early mechanical signatures of neuroinflammation in patients with clinically isolated syndrome. J Magn Reson Imaging 44, 51-58, doi:10.1002/jmri.25129 (2016).
8 Schregel, K., Wuerfel, E., Garteiser, P., Gemeinhardt, I., Prozorovski, T., Aktas, O., Merz, H., Petersen, D., Wuerfel, J. & Sinkus, R. Demyelination reduces brain parenchymal stiffness quantified in vivo by magnetic resonance elastography. Proc Natl Acad Sci U S A 109, 6650-6655, doi:10.1073/pnas.1200151109 (2012).
9 Wuerfel, J., Tysiak, E., Prozorovski, T., Smyth, M., Mueller, S., Schnorr, J., Taupitz, M. & Zipp, F. Mouse model mimics multiple sclerosis in the clinico-radiological paradox. Eur J Neurosci 26, 190-198 (2007).
10 Weickenmeier, J., de Rooij, R., Budday, S., Steinmann, P., Ovaert, T. C. & Kuhl, E. Brain stiffness increases with myelin content. Acta Biomater 42, 265-272, doi:10.1016/j.actbio.2016.07.040 (2016).
11 Wang, S., Millward, J. M., Hanke-Vela, L., Malla, B., Pilch, K., Gil-Infante, A., Waiczies, S., Mueller, S., Boehm-Sturm, P., Guo, J., Sack, I. & Infante-Duarte, C. MR Elastography-Based Assessment of Matrix Remodeling at Lesion Sites Associated With Clinical Severity in a Model of Multiple Sclerosis. Front Neurol 10, 1382, doi:10.3389/fneur.2019.01382 (2019).
12 Popescu, B. F., Pirko, I. & Lucchinetti, C. F. Pathology of multiple sclerosis: where do we stand? Continuum (Minneap Minn) 19, 901-921, doi:10.1212/01.Con.0000433291.23091.65 (2013).
13 Johnson, C. L., Thompson, C. A., Sandroff, B. M., Edwards, T. A., Hubbard, E. A., Klaren, R. E., Schwarb, H., Sutton, B. P., Pilutti, L. A. & Motl, R. W. in Proc 25st Annual Meeting ISMRM. (ed In: Proceedings of the 25st Annual Meeting of ISMRM).
14 Asbach, P., Ro, S. R., Aldoj, N., Snellings, J., Reiter, R., Lenk, J., Köhlitz, T., Haas, M., Guo, J., Hamm, B., Braun, J. & Sack, I. In Vivo Quantification of Water Diffusion, Stiffness, and Tissue Fluidity in Benign Prostatic Hyperplasia and Prostate Cancer. Invest Radiol 55, 524-530, doi:10.1097/rli.0000000000000685 (2020).
15 Schrank, F., Warmuth, C., Tzsch?tzsch, H., Kreft, B., Hirsch, S., Braun, J., Elgeti, T. & Sack, I. Cardiac-gated steady-state multifrequency magnetic resonance elastography of the brain: Effect of cerebral arterial pulsation on brain viscoelasticity. Journal of Cerebral Blood Flow and Metabolism 40, 991-1001, doi:10.1177/0271678x19850936 (2020).
16 Papazoglou, S., Hirsch, S., Braun, J. & Sack, I. Multifrequency inversion in magnetic resonance elastography. Phys Med Biol 57, 2329-2346, doi:10.1088/0031-9155/57/8/2329 (2012).
17 Meyer, T., Tzschätzsch, H., Braun, J., Kalra, P., Kolipaka, A. & Sack, I. in Proc 23st Annual Meeting ISMRM. (ed In: Proceedings of the 27st Annual Meeting of ISMRM) 3966.
18 Penny, W. D., Friston, K. J., Ashburner, J. T., Kiebel, S. J. & Nichols, T. E. Statistical parametric mapping: the analysis of functional brain images. (Elsevier, 2011).
19 Filippi, M., Cercignani, M., Inglese, M., Horsfield, M. A. & Comi, G. Diffusion tensor magnetic resonance imaging in multiple sclerosis. Neurology 56, 304-311 (2001).
Figures