0999
In vivo MR elastography of the murine hippocampus is sensitive to the microscopic mechanical properties of dentate gyrus subzones1Charité - Universitätsmedizin Berlin, Berlin, Germany, 2Universität Leipzig, Leipzig, Germany
Synopsis
In this study, we investigated the mechanical properties of subregions of the murine dentate gyrus in vivo using MR elastography (MRE) and ex vivo with atomic force microscopy (AFM). Consistent with AFM, subregional analysis of the dentate gyrus by MRE revealed that the subgranular zone (SGZ), in which adult neurogenesis takes place, is characterized by marked soft-solid properties. We conclude that MRE is sensitive to micromechanical properties beyond the image resolution. The observed soft-solid material properties of the SGZ quantified by AFM and MRE might be of functional relevance for neurogenesis in the mouse brain.
Introduction
The hippocampus consists of different regions such as the dentate gyrus (DG) with the subgranular zone (SGZ). The SGZ is one of the zones in the murine brain where neurogenesis occurs [1]. Using atomic force microscopy (AFM) and other micro-indentation methods, the elastic heterogeneity of the hippocampus and the DG was analysed ex vivo [2-4]. However, these studies never investigated the neurogenic niche, based on an anatomical marker and were never correlated with in vivo mechanical properties quantified by MR elastography (MRE). Therefore, this study aimed to (i) investigate the elastic properties of the neurogenic niche, the SGZ, using fluorescent neuronal stem cells as an anatomical marker in combination with AFM and (ii) test if in vivo MRE can resolve sub-voxel mechanical properties of the SGZ in the murine DG consistent with the findings of (i).Methods
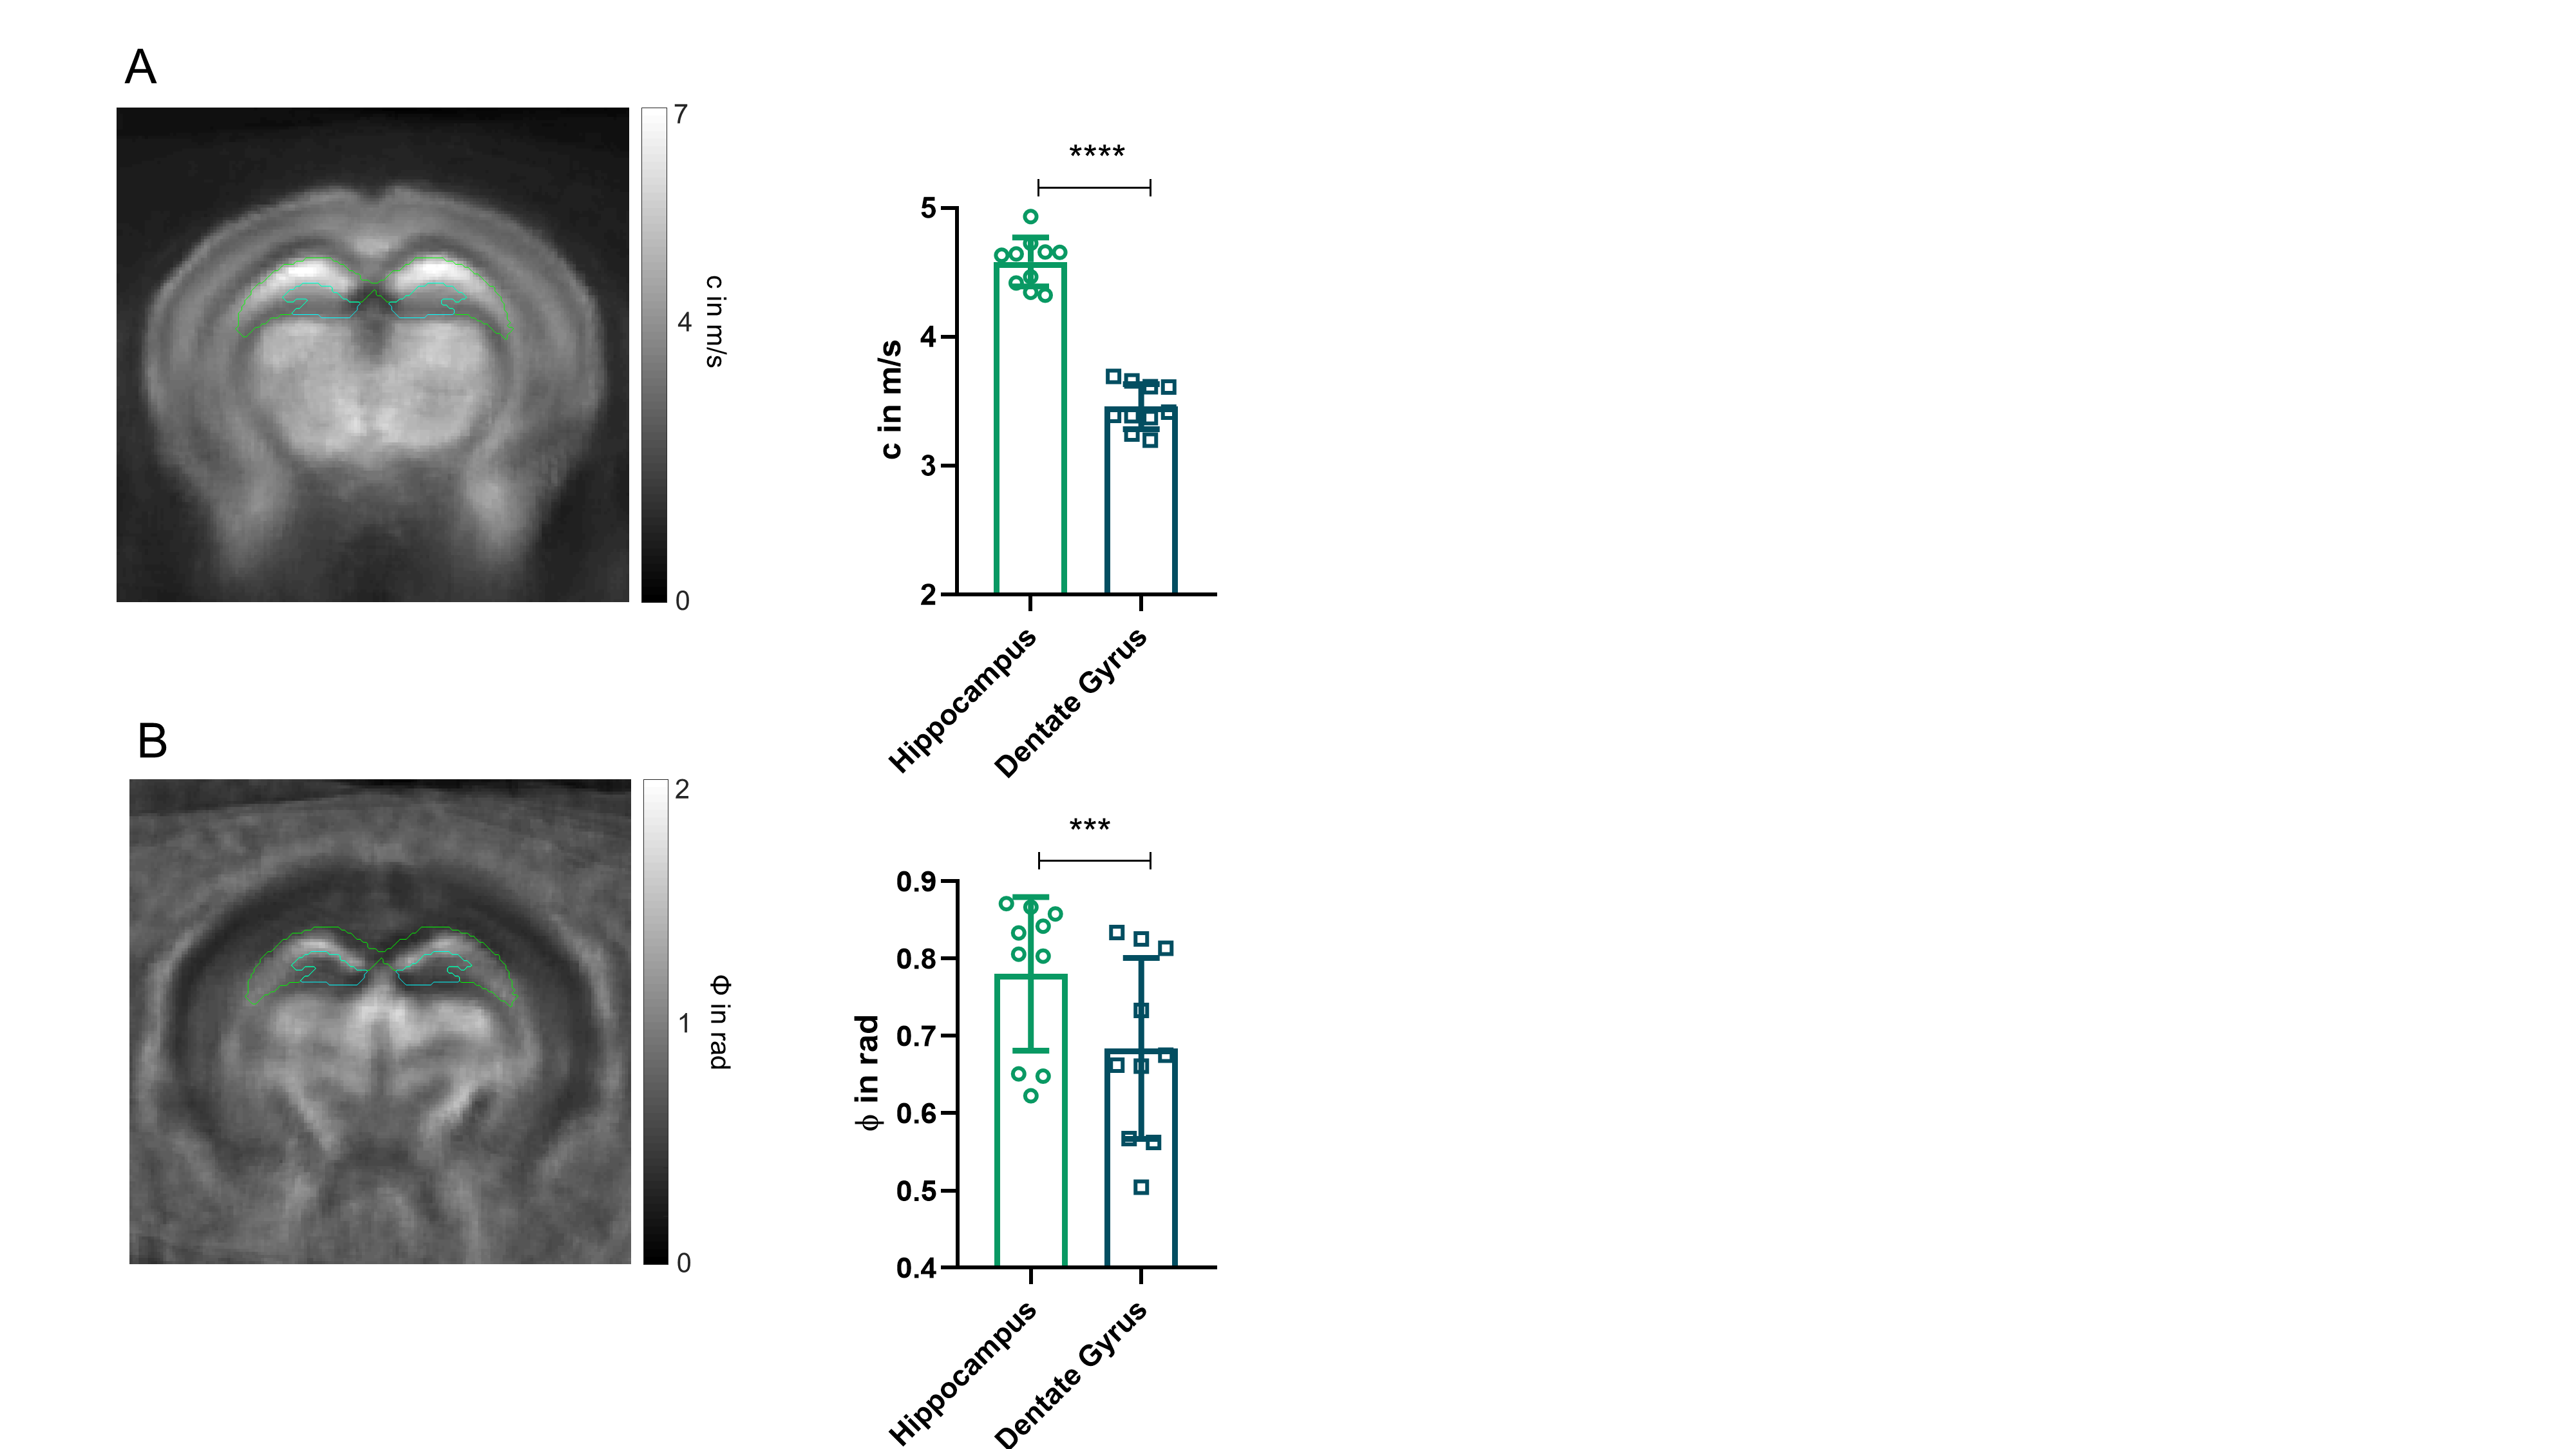
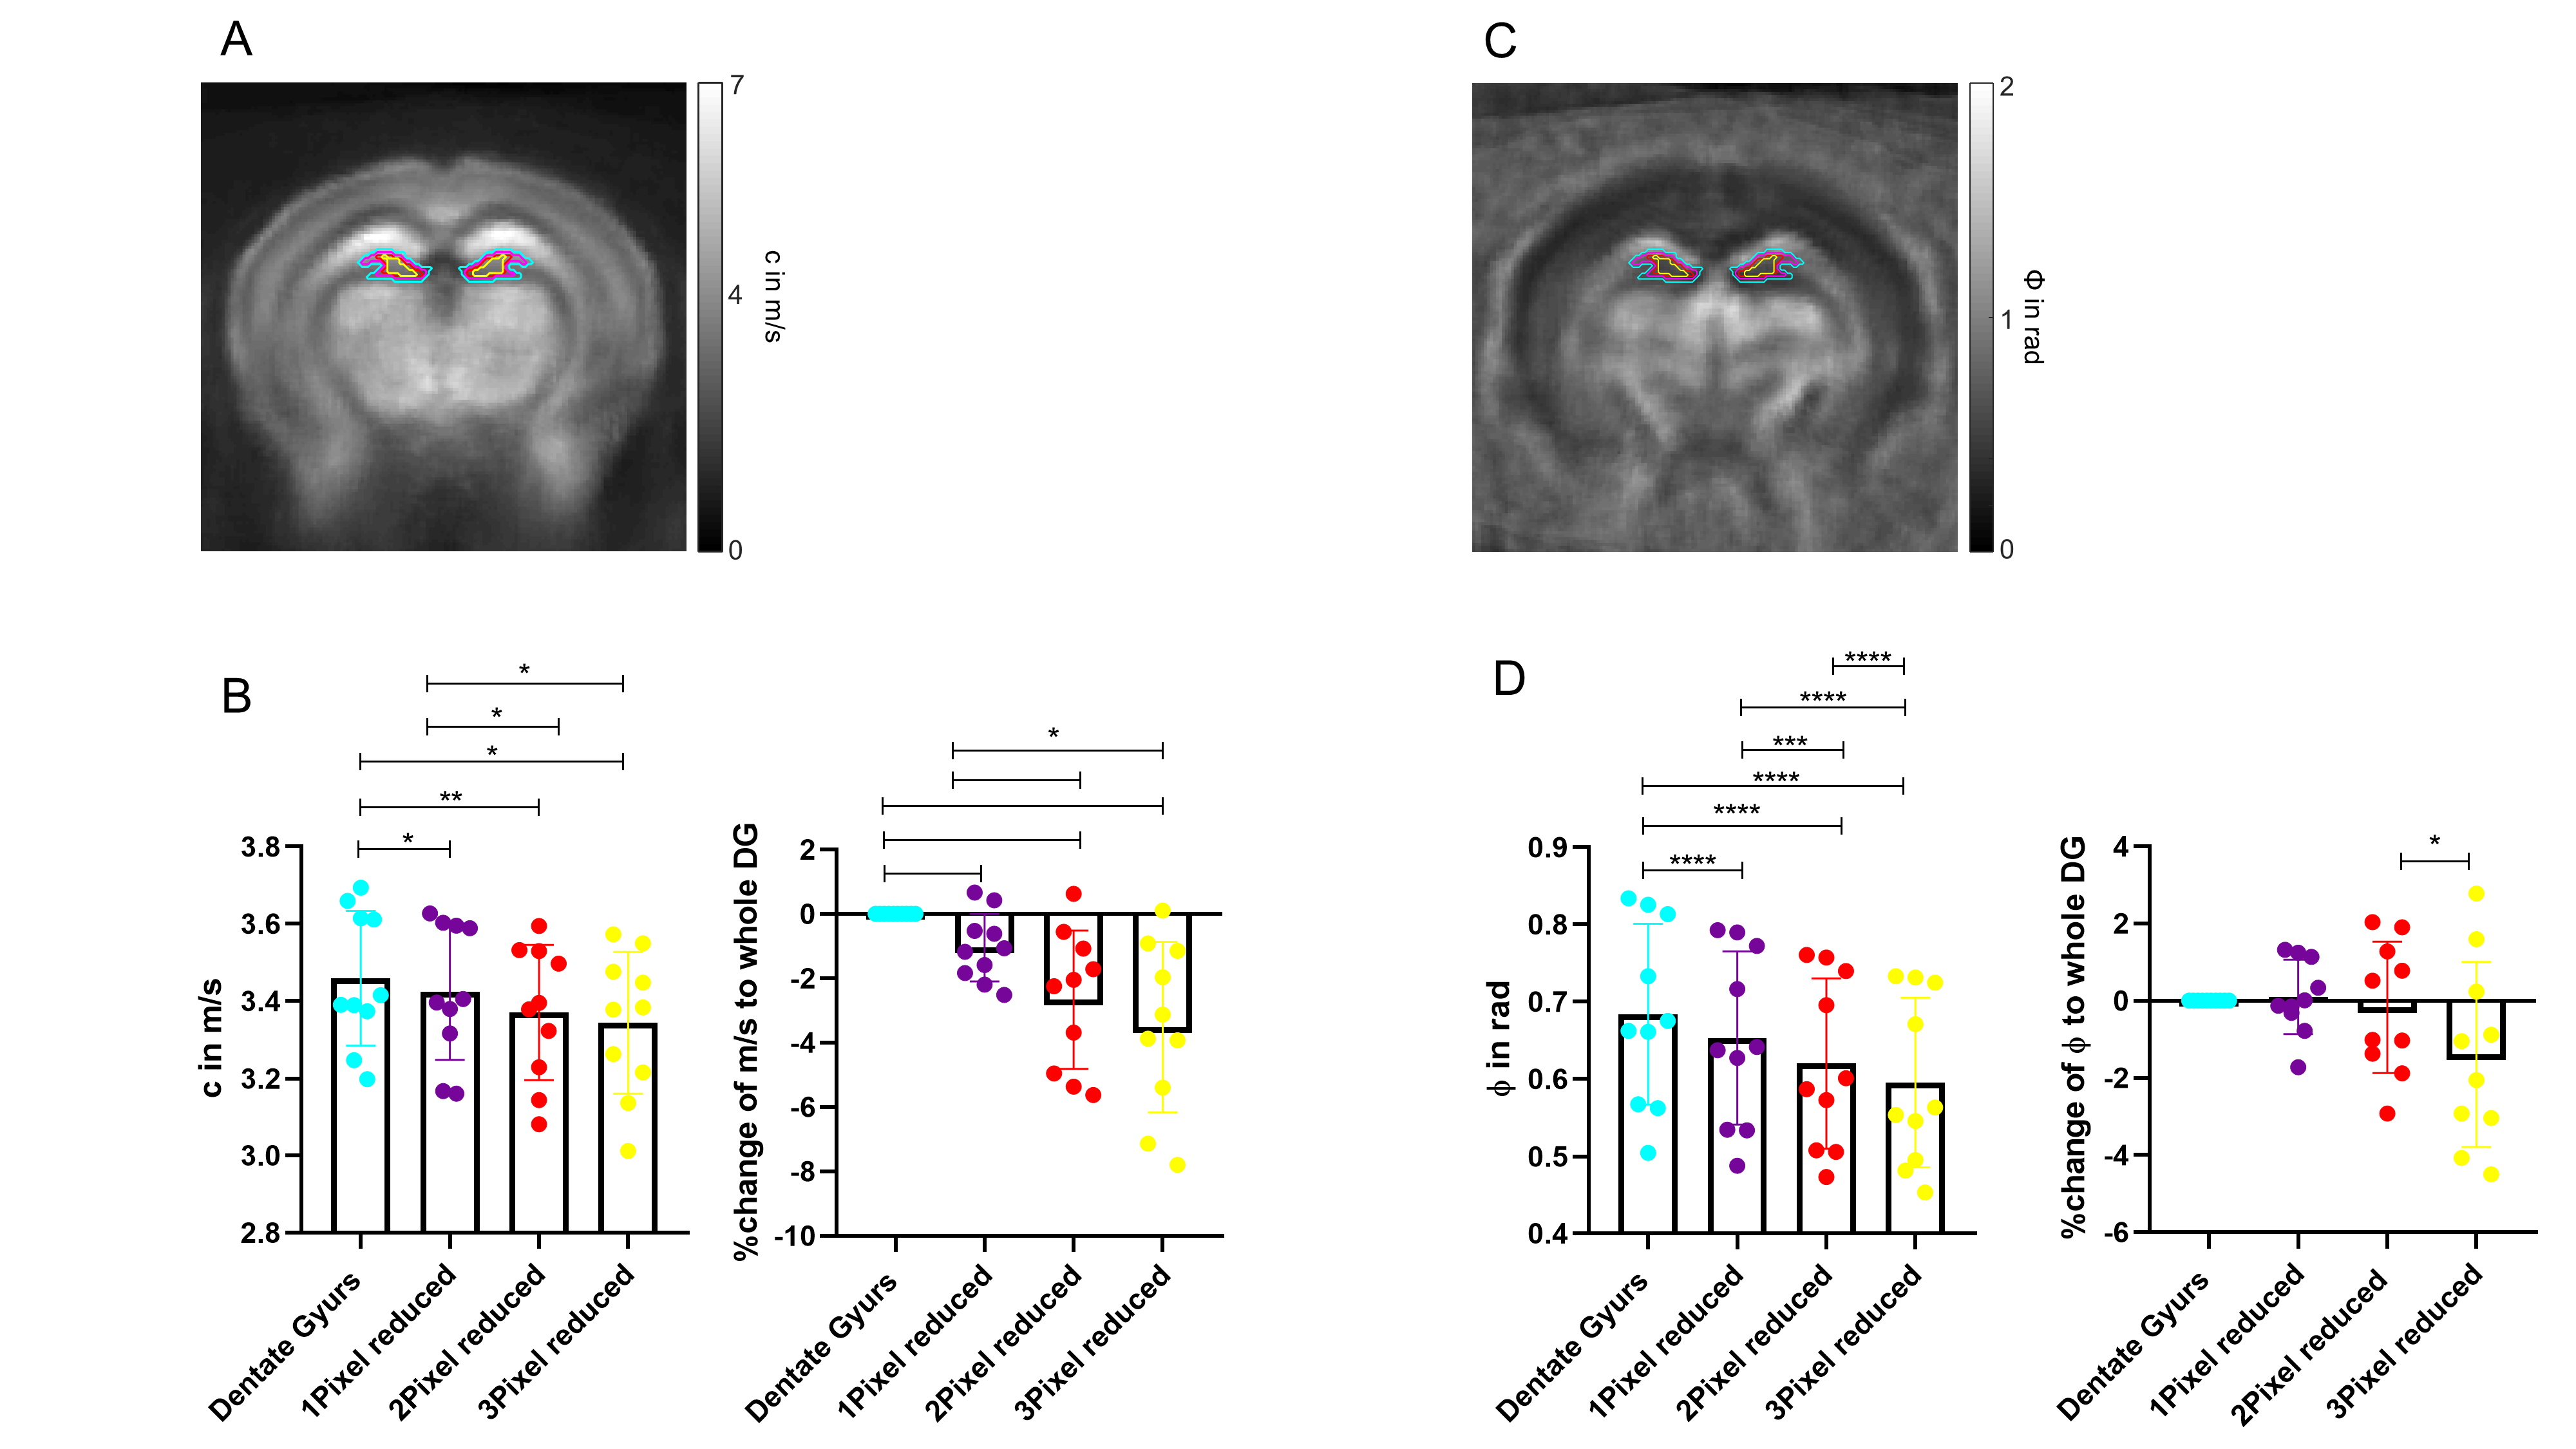
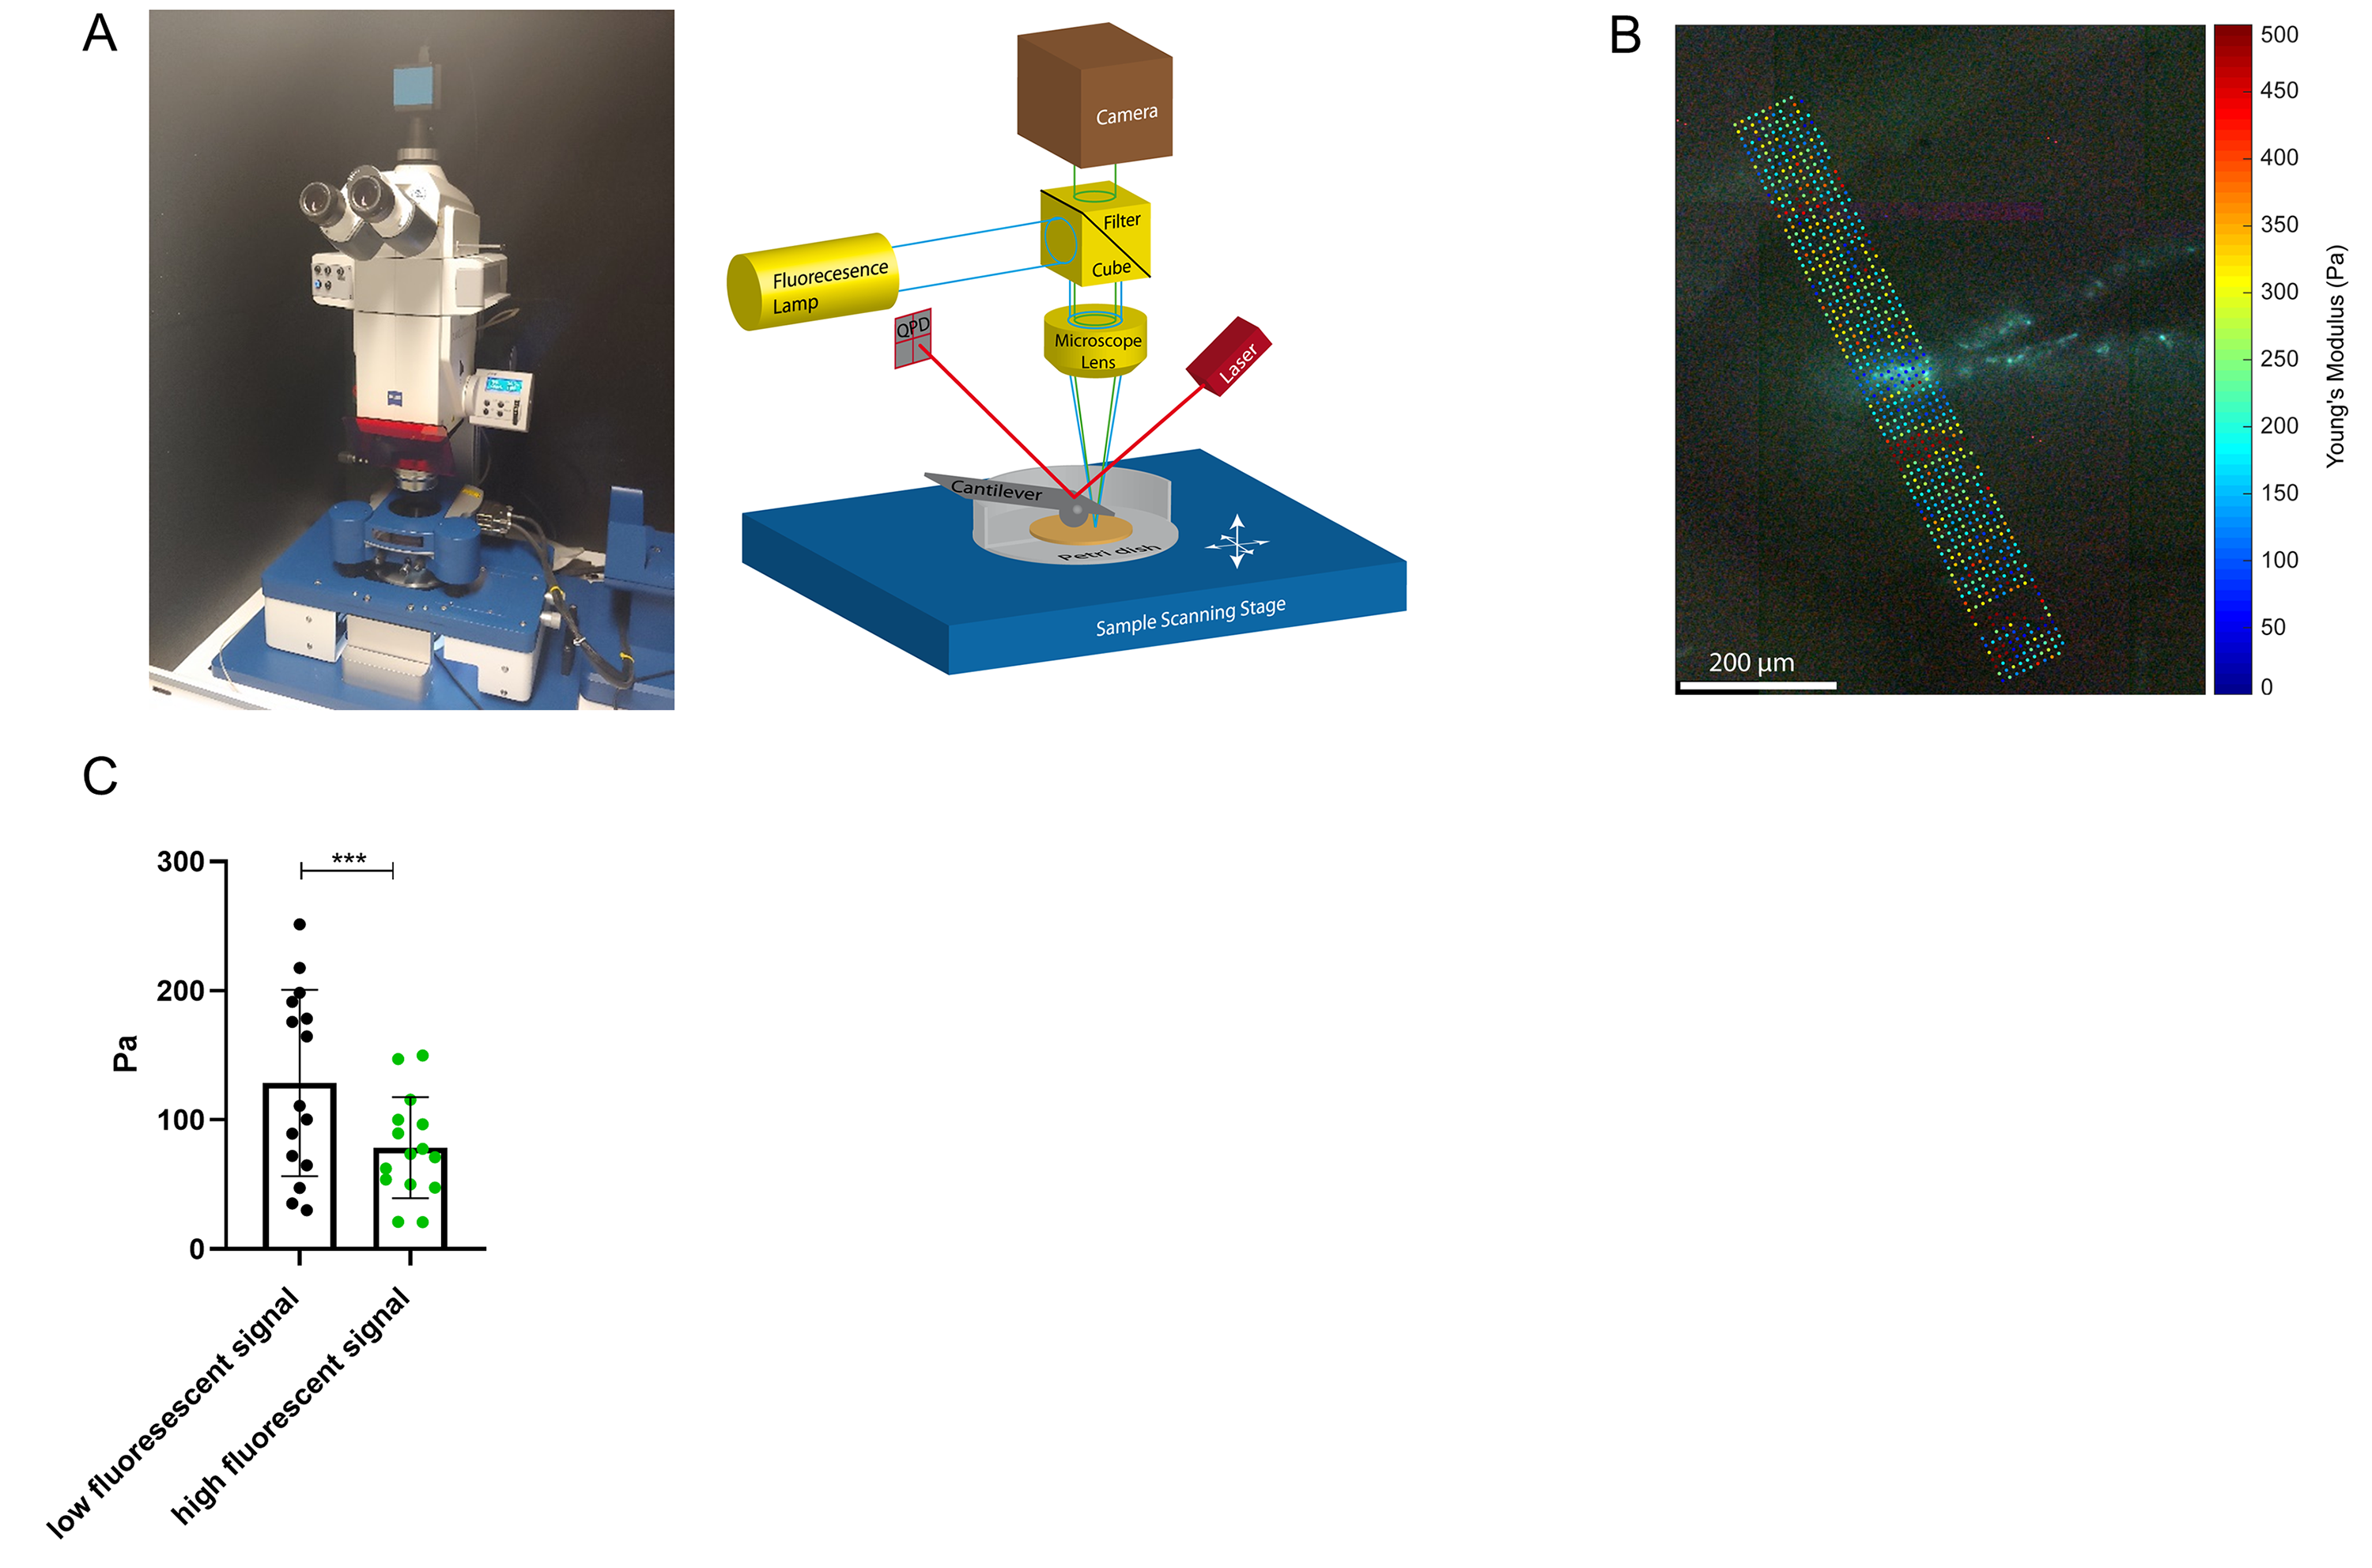
All measurements of the murine brain were performed coronal in the area bregma -2.2 mm to - 2.3 mm [5]. MRE 10 C57BL/6J mice (8 weeks old) were scanned at a 7-T small-animal scanner (Bruker BioSpec, Ettlingen, Germany). Waves images using multifrequency tomoelastography were acquired utilizing 5 frequencies ranging from 1000Hz-1400Hz (7slices, 0.8mm thickness, TE=53ms, TR=4000ms, FOV=16.2x10.8mm², matrix size=90x60). A costume-made driver system with a nonmagnetic piezoceramic actuator generated the vibrations [6]. k-MDEV inversion was used to determine the shear wave speed (c in m/s) as a surrogate marker of stiffness. MDEV inversion was used to reconstruct the phase angle of the complex shear modulus (φ in rad, named loss angle) as measure of tissue fluidity. c and φ maps of the murine brain were registered to the Allen brain atlas [5]. Masks corresponding to the hippocampus (containing CA1, CA2, and CA3) and DG were automatically generated (figure1A, left). To determine subregional differences in the DG and to isolate the SGZ, the DG mask was scaled down in a pixel-wise manner (figure 2A, C). AFM 6 Tg(Nes-EGFP)33Enik/J mice (7-9 weeks old), which express the green fluorescence protein (GFP) under the nestin-promoter, visualizing neuronal stem cells and progenitor cells, were transcardially perfused with ice cold phosphate buffered saline. Coronal brain slices of 350µm thickness were prepared. Elastic properties were obtained by indentation measurements using an AFM (Nanowizard4, JPK, figure 3A). For this purpose, commercially available cantilevers (0,2 N/m, CONT, Nanoworld) were modified by gluing a small polysterene bead (diameter ~ 6 µm) onto the tip. During measurements, tissue was placed in artificial cerebrospinal fluid, supplemented with synthetic air with 5% CO2. For each slice, a profile of 10-15 x 120-150 pixels over the DG, comprising the SGZ, was acquired (figure 3B). For anatomical orientation, fluorescence, visualizing the SGZ, was used. For each measurement point the Young’s modulus (E in Pa) and local fluorescent intensity was determined. A threshold value for the fluorescent intensity was determined visually and elasticity values were grouped accordingly.Results
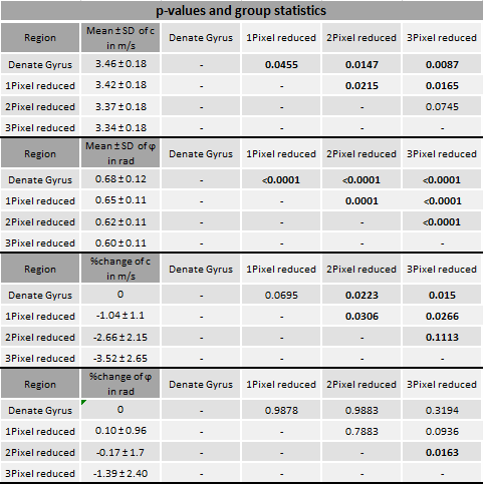
In vivo MRE shows regional viscoelastic differences between hippocampus subzones (CA1, CA2, CA3) and DG, which has a significantly lower stiffness and loss angle (c in m/s 4.58±0.19 vs. 3.46±0.18, p<0,0001; ϕ in rad 0.78±0.1 vs. 0.68±0.12, p=0.0003, figure 1A-B). Furthermore, MRE shows a significant reduction in c and ϕ in a subregional analysis of the DG (figure 2B left & D left, for statistics see figure 5). The reduction becomes apparent when the relative change in c and ϕ obtained by eroded masks (one, two and three pixels erosion) is analyzed relative to full DG values (figure 2B right, D right). In all mice, softening and transition from more fluid to solid properties was observed when approaching the SGZ (figure 2A, 2B). A summary of our statistical analysis is given in figure 4. Ex vivo AFM measurements are consistent with in vivo MRE measurements and show that the SGZ, marked by a high fluorescence signal (figure 3C), shows a reduced stiffness over AFM 15 measurements in 8 acute brain slices (128.50 ± 72.09 vs. 78.49 ± 39.08, p=0.0003, figure 3D).Discussion
Our findings show that in vivo MRE is able to detect subregional and microscopic viscoelastic differences in the DG. Isolation of the SGZ by reducing the DG mask in size, allows to detect the lower stiffness and a transition from fluid to solid properties. This finding is consistent with our ex vivo AFM data. Here we precisely identified the SGZ using the fluorescence signal intrinsically expressed by neuronal stem and progenitor cells in this tissue. Higher fluorescence values corresponded to lower stiffness values, providing evidence that the SGZ is softer than the surrounding tissue. Probably, this specific structural features of the SGZ are determined by the unique biological composition of neuronal stem and progenitor cells [4, 7], their interaction with the surrounding matrix and by the special environmental requirements for proliferation and maturation in the process of neurogenesis [4, 8].Conclusion
MRE can detect subregional viscoelastic differences in the murine DG in a sub-pixel resolution consistent with micro-mechanical tests by AFM. We detected marked soft-solid properties in the SGZ of the murine DG, which may point towards functional mechanical properties associated with neurogenesis.Acknowledgements
Funding from the German Research Foundation (GRK 2260 BIOQIC, SFB1340 Matrix in Vision) is gratefully acknowledged.References
1. Kempermann, G., et al., Milestones of neuronal development in the adult hippocampus. Trends in neurosciences, 2004. 27(8): p. 447-452.
2. Antonovaite, N., et al., Regional variations in stiffness in live mouse brain tissue determined by depth-controlled indentation mapping. Scientific reports, 2018. 8(1): p. 1-11.
3. Elkin, B.S., et al., Mechanical heterogeneity of the rat hippocampus measured by atomic force microscope indentation. Journal of neurotrauma, 2007. 24(5): p. 812-822.
4. Luque, T., et al., Microelastic mapping of the rat dentate gyrus. Royal Society Open Science, 2016. 3(4): p. 150702.
5. Science, A.I.f.B. Allen brain atlas reference atlas v1 2008 [cited 2020; v1:[Available from: http://mouse.brain-map.org/experiment/siv?id=100142143&imageId=102162514&imageType=atlas&initImage=atlas&showSubImage=y&contrast=0.5,0.5,0,255,4.
6. Bertalan, G., et al., Fast tomoelastography of the mouse brain by multifrequency single-shot MR elastography. Magnetic Resonance in Medicine, 2019. 81(4): p. 2676-2687.
7. Chen, L., et al., Statistical study of biomechanics of living brain cells during growth and maturation on artificial substrates. Biomaterials, 2016. 106: p. 240-249.
8. Rammensee, S., et al., Dynamics of mechanosensitive neural stem cell differentiation. Stem cells, 2017. 35(2): p. 497-506.
Figures