0998
Relation of native T1 & ECV values to gadolinium enhancement & myocardial perfusion in hypertrophic cardiomyopathy in 3T MRI
Anoop Ayyappan1, Harshith Kramadhari1, Ajit Kumar1, and Kapilamoorthy T.R.1
1Department of IS & IR, Sree Chitra Tirunal Institute of Medical Sciences & Technology, Kerala, India
1Department of IS & IR, Sree Chitra Tirunal Institute of Medical Sciences & Technology, Kerala, India
Synopsis
Hypertrophic cardiomyopathy (HCM) is a disorder of myocardium having a genetic basis, and high disease related mortality. Identification of areas of occult fibrosis along with overt fibrosis using T1 mapping will be useful in long term prognosis of patients along with other imaging parameters in MRI. This study was aimed at (a) determining the differences in native T1 values of controls and HCM patients, (b) to determine the relationship between early gadolinium enhancement (EGE)/Late gadolinium enhancement (LGE)/ perfusion abnormalities and native T1 and ECV values in patients of hypertrophic cardiomyopathy.
Aims and objectives
This study was aimed at (a) determining the differences in native T1 values of controls and HCM patients, (b) to determine the relationship between early gadolinium enhancement (EGE)/Late gadolinium enhancement (LGE) and native T1 values & ECV in patients of hypertrophic cardiomyopathy.Materials and methods
The study included 33 patients of HCM and 9 matched controls. CMR was done on 3T MRI machine (MR750w, GE Healthcare, Waukesha, WI, USA) with cardiac gating. SMART T1 (Native T1 mapping was acquired from saturation pulses with different delay times [300, 600 ms] and without magnetization preparation. Imaging parameters: Repetition time 3.9 ms; Echo time 1.8 ms; Flip angle 45°; Section thickness 8 mm; Field of- view 360 mm; Matrix size 192 × 128. TI – 250 - 20000 ms.8 datasets were obtained over 14 heartbeats which are shown in the Figure 1) maps were created by the MR system and were used to assess the native T1 values of the heart for all the 16 segments of the heart according to the AHA model. Perfusion assessment, EGE and LGE quantification was done using the Cvi 42 software. A subset (n=13) of these patients had ECV mapping assessed by manual calculation.Results
Native T1 values were higher in the HCM patient compared to the matched controls (1538.67 + 93 ms vs 1458.75 + 43 ms) and was statistically significant (p=< 0.05). ROC curve showed AUC of 0.78 with a cutoff of 1485.5 ms showing 77 % sensitivity and 79 % specificity at differentiating normal myocardium from HCM patients. The native T1 values were longer in areas of the heart in HCM patients with perfusion defects (1570.62 ± 78 ms vs 1535.25 ± 95 ms), was not statistically significant. The native T1 values were longer in segments showing EGE (1541.71 ± 103ms vs 1532.64 ± 86 ms), which was significant (p = < 0.05). Comparison of native T1 values and LGE showed longer T1 times in the segments showing LGE (Figure 2) when compared to segments without LGE (1554.79 ±94 ms vs 1533.63 ± 94 ms), which was not statistically significant. We observed a positive correlation between maximum wall thickness and native T1 values, which was statistically significant (p=< 0.01). ECV values were higher in cases with scar compared to cases without scar (61% vs 40 %) but was not statistically significant because of low number of patients (n=13).Conclusion
Native T1 values of myocardium by SMART1 maps can differentiate normal myocardium from cases of HCM, however there was significant overlap in values from both the group. It can detect areas of myocardial fibrosis which can go undetected by LGE and myocardial edema. However, T1 mapping can only be used as an adjunct to EGE and LGE sequences. T1 mapping can predict disease burden, as the T1 values increased with increase in the myocardial thickness.Acknowledgements
The authors would like to acknowledge GE Healthcare for their research support.References
No reference found.Figures
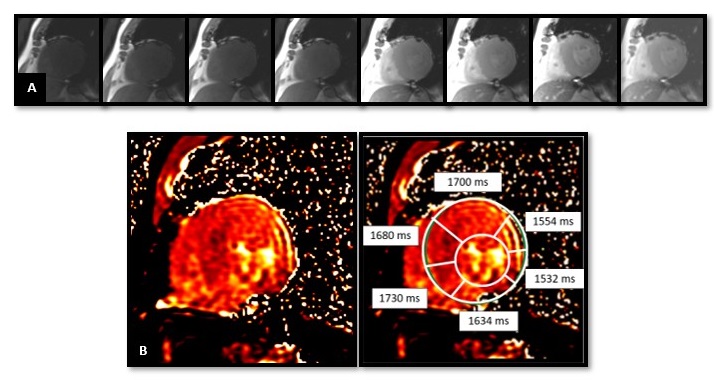
Figure 1: Panel A, shows acquisition of 8 images with varying T1 values over a period of 14 heartbeats. B shows the final T1 maps obtained from the console and the analysis of the T1 values by defining the endocardial and epicardial borders of the myocardium and applying the 17 segments AHA model to the heart. The average T1 values of the segments are denoted in the inserts.
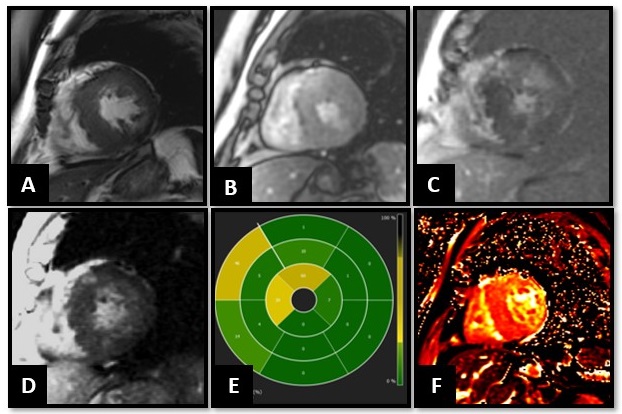
Figure 2: 67-year-old male patient with HCM. CMR showed asymmetric hypertrophy of the septum and the lateral wall, with a maximum thickness of 24mm in the septum (A). B, No obvious perfusion defects noted in the myocardial perfusion imaging. EGE, LGE PSIR sequences and bulls eye representation (C, D and E) showed enhancement in the thickened septum, mainly at the RV hinge points in the mid myocardium, diagnostic of HCM. Global T1 values were elevated to 1607.25 ± 40 ms, mainly in the thickened septum and areas of LGE.