0997
Extracellular Volume Fraction Mapping May Distinguish Acute Pediatric Heart Transplant Rejection from Non-Rejection1Radiology and Radiological Sciences, Vanderbilt University Medical Center, Nashville, TN, United States, 2Pediatrics, Medical College of Wisconsin, Milwaukee, WI, United States, 3Pediatric Cardiology, Vanderbilt University Medical Center, Nashville, TN, United States, 4Pediatric Cardiology, Joe DiMaggio Children’s Hospital, Hollywood, FL, United States
Synopsis
Acute rejection (AR) remains a significant cause of morbidity and mortality in pediatric patients after heart transplant. Endomyocardial biopsy (EMB) of the right ventricular septum is the standard method for diagnosing AR. However, EMB is prone to additional risk and sampling error as AR is a heterogeneous process. Here we show that extracellular volume fraction (ECV) mapping of the left ventricle (LV) analyzed with standard descriptive statistics and specialized texture analysis may differentiate pediatric heart transplant recipients as having AR or not. This CMR diagnostic approach offers diagnostic advantages including greater sampling volume and minimal invasiveness.
Introduction
Acute rejection (AR) remains a significant cause of morbidity and mortality in patients after pediatric heart transplant (PHTx).(1) The standard of care to diagnose AR is an endomyocardial biopsy (EMB) of the right side of the interventricular septum. This procedure is invasive, performed under anesthesia, and associated with a risk of morbidity and mortality.(2,3) Because of its limited sampling volume, EMB is also associated with false negative findings. In contrast to this, cardiac magnetic resonance (CMR) mapping of the extracellular volume fraction (ECV), calculated from pre- and post-contrast T1 measurements, is minimally invasive and is able to characterize pathological processes in the left ventricular (LV) wall. Therefore, the purpose of this study was to evaluate the potential for ECV mapping of the LV, analyzed using specialized texture analysis and standard descriptive statistics, to distinguish PHTx pediatric heart transplant rejection from non-rejection.Methods
Patients: AR was defined as a clinical change or positive EMB requiring intensification of immunosuppression. PHTx patients were prospectively enrolled at a single center at the time of EMB. Five subjects were enrolled without AR and seven subjects with AR. Patients with cardiac allograft vasculopathy were excludedImage Acquisition: CMR scans were acquired on Siemens 1.5T Avanto magnet without sedation. Analyses included standard volumetrics, late gadolinium enhancement (LGE), modified Look-Locker inversion recovery before and after contrast in the short axis at the mid-LV. Hematocrit was obtained at the time of CMR to calculate ECV.
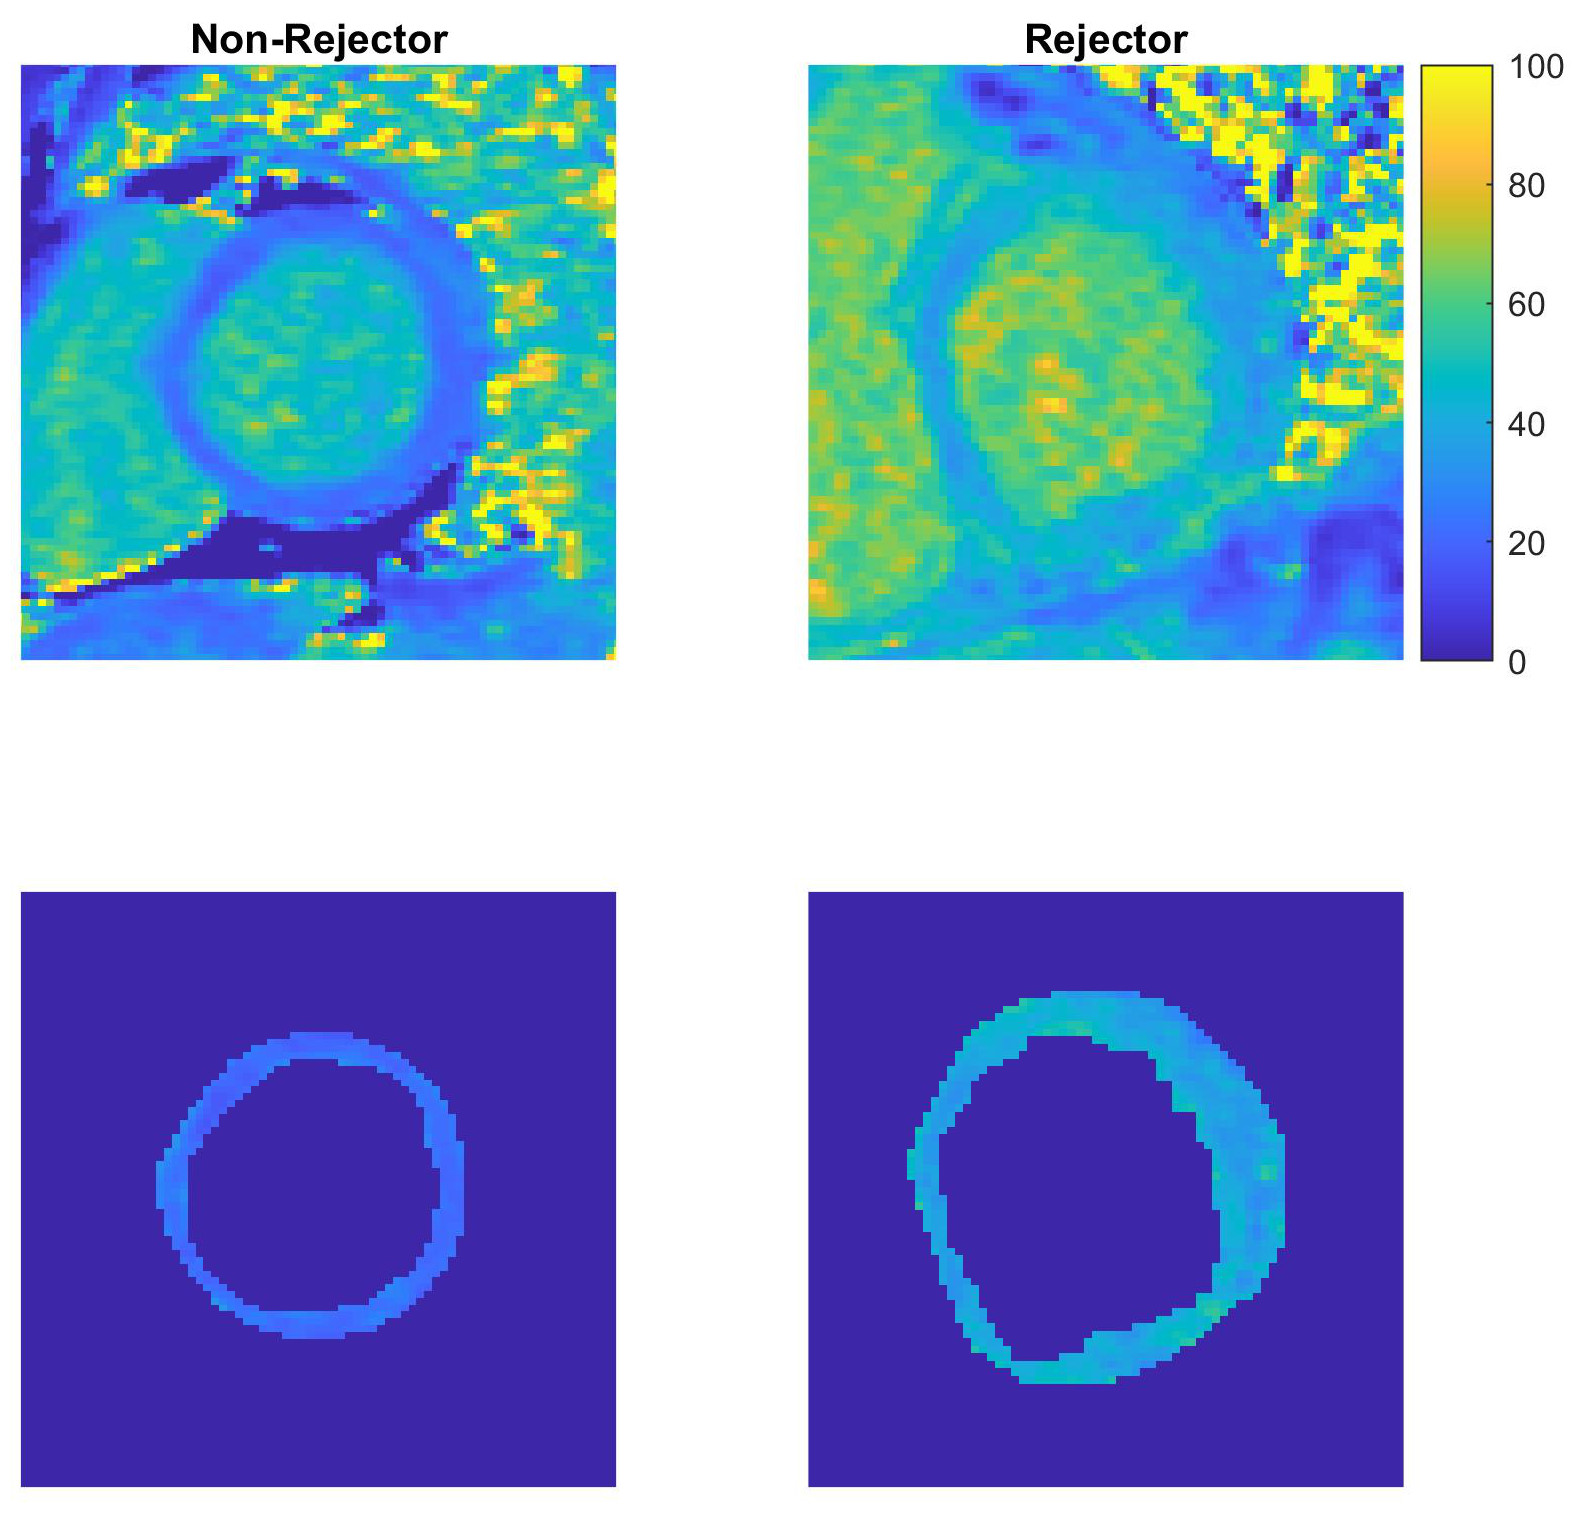
Image Analysis: ECV maps were created using QMaps (Medis), and the DICOM files were exported to MATLAB® for analysis. The ECV maps were analyzed by hand-defining the epicardial border. Then, the image within this region (LV wall and chamber) was segmented using a k-means clustering method. The chamber was selected and used to create a mask; the mask was dilated once and subtracted from the entire region to leave a mask representing only the LV wall. Dilation of the chamber mask was used to reduce the inclusion of partial volume artifacts along the LV endocardial border. The LV myocardial ECV maps were then characterized using typical descriptive statistics and measures derived from the gray-level cooccurrence matrix (GLCM) and gray-level run-length matrix (GLRLM).
Statistical analysis: Descriptive statistics including mean, standard deviation, median and interquartile range (IQR), and range were generated. Subjects with and without acute rejection were compared using a two-sided Student’s t-test or a Pearson’s chi-square test.
Results
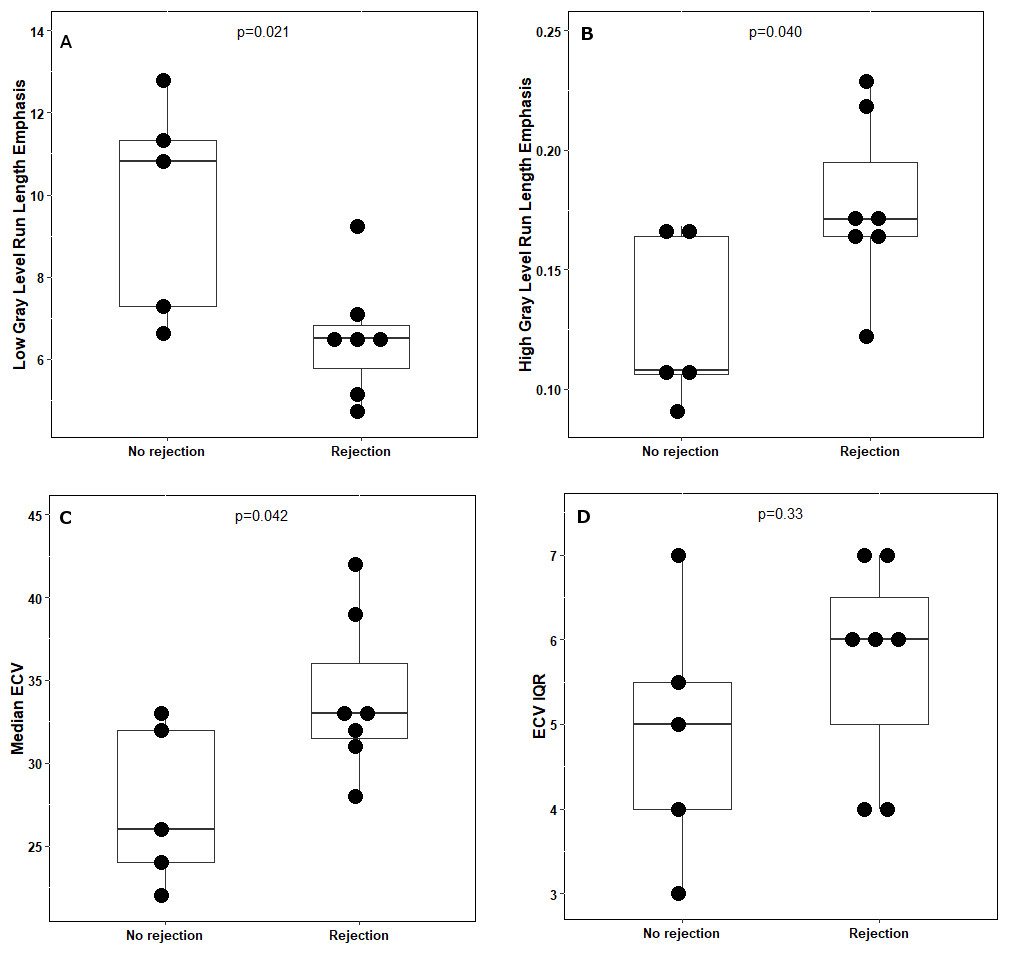
PHTx patients had a mean age of 15.6 years old (range 11-19) and a mean LV ejection fraction (EF) of 58% ± 10. Seven (58%) had patchy late gadolinium enhancement (LGE). There was no difference in LVEF or presence of LGE between subjects with and without rejection (p=0.31 and p=0.92, respectively). Figure 1 shows sample ECV maps, zoomed to emphasize the LV, before (top row) and after (bottom row) segmentation. The images at left (no-rejection) illustrate uniformly lower ECV values, while those to the right (acute rejection, AR) show a mottled texture with higher ECV values.Compared to myocardial walls with no rejection, those with AR had significantly lower low gray-level run-length emphasis (LGRE; means 6.5 vs. 9.8, p=0.021) and higher high gray-level run-length emphasis (HGRE; means 0.18 vs. 0.13, p=0.040). Those with AR also had a significantly higher median ECV in the LV wall (33% vs. 26%, p=0.042). There was no significant difference in the IQR of ECV in the LV wall (p=0.33).
Discussion
This preliminary study suggests that qualitative assessment of late gadolinium enhancement alone cannot distinguish PHTx patients with AR from those without AR. However, patients with AR identified using right ventricular EMB had higher mean HGRE values (reflecting more runs of connected pixels with high EV values) and lower LGRE values (reflecting fewer runs of connected pixels with low ECV values). The findings from this small cohort therefore suggest that ECV texture analysis has the potential for non-invasive diagnosis of AR in PHTx. Future analysis will focus on combining metrics to optimize sensitivity and specificity.Acknowledgements
No acknowledgement found.References
(1) Webber, S.A., et al., Late rejection episodes more than 1 year after pediatric heart transplantation: risk factors and outcomes. J Heart Lung Transplant, 2003. 22(8): p. 869-75.
(2) Saraiva, F., et al., Complications of endomyocardial biopsy in heart transplant patients: a retrospective study of 2117 consecutive procedures. Transplant Proc, 2011. 43(5): p. 1908-12.
(3) Pophal, S.G., et al., Complications of endomyocardial biopsy in children. J Am Coll Cardiol, 1999. 34(7): p. 2105-10.
Figures