0995
Myocardial T1 mapping and feature tracking in patients with OSA: potential novel insights into adaptive left ventricular remodeling phase1Department of Radiology, Guangdong Provincial People’s Hospital, Guangdong Academy of Medical Sciences, Guangzhou, China, 2Philips Healthcare, Guangzhou, China, 3Sleep Center, Department of Pulmonary and Critical Care Medicine, Guangdong Provincial People’s Hospital, Guangdong Academy of Medical Sciences, Guangdong Provincial Geriatrics Institute, Guangzhou, China, 4Department of Medical Statistics, School of Public Health, Sun Yat-sen University, Guangzhou, China
Synopsis
The comprehensive assessment of left ventricular (LV) remodeling by cardiac magnetic resonance (CMR) imaging with T1 mapping and feature tracking (FT) technology in obstructive sleep apnea (OSA) was conducted in this study. Indexed extracellular volume (iECV) and indexed cellular volume (iCV) of myocardial tissue construction were derived from T1 mapping. The results show that elevated LV mass index (LVMi) in OSA was mainly from iCV, while not from iECV, with no LV ejection function (LVEF) or strain parameters impairment. Cellular hypertrophy accompanied with normal LV systolic function in patients with OSA may contribute to adaptive LV remodeling phase.
Purpose and Introduction
Obstructive sleep apnea, characterized by repetitive partial or complete upper respiratory tract obstruction during sleep, is a common respiratory disorder affecting more than 39.4% individuals in China1. OSA is associated with cardiac hypertrophy and have high odds of developing concentric left ventricular hypertrophy2. For detecting detrimental effect on the heart in OSA patients, echocardiographic examination is the most widely utilized method. However, CMR, as the gold standard imaging technology to evaluate left ventricular function and structure and as the unique tool for characterizing myocardial tissue changes, is scare, especially in OSA patients without any other medical disorders. Therefore, we aimed to characterize and assess myocardial structure, volume, function and tissue characteristic changes following LV remodeling in first diagnosed OSA patients by CMR method with T1 mapping and feature tracking technology.Materials and Methods
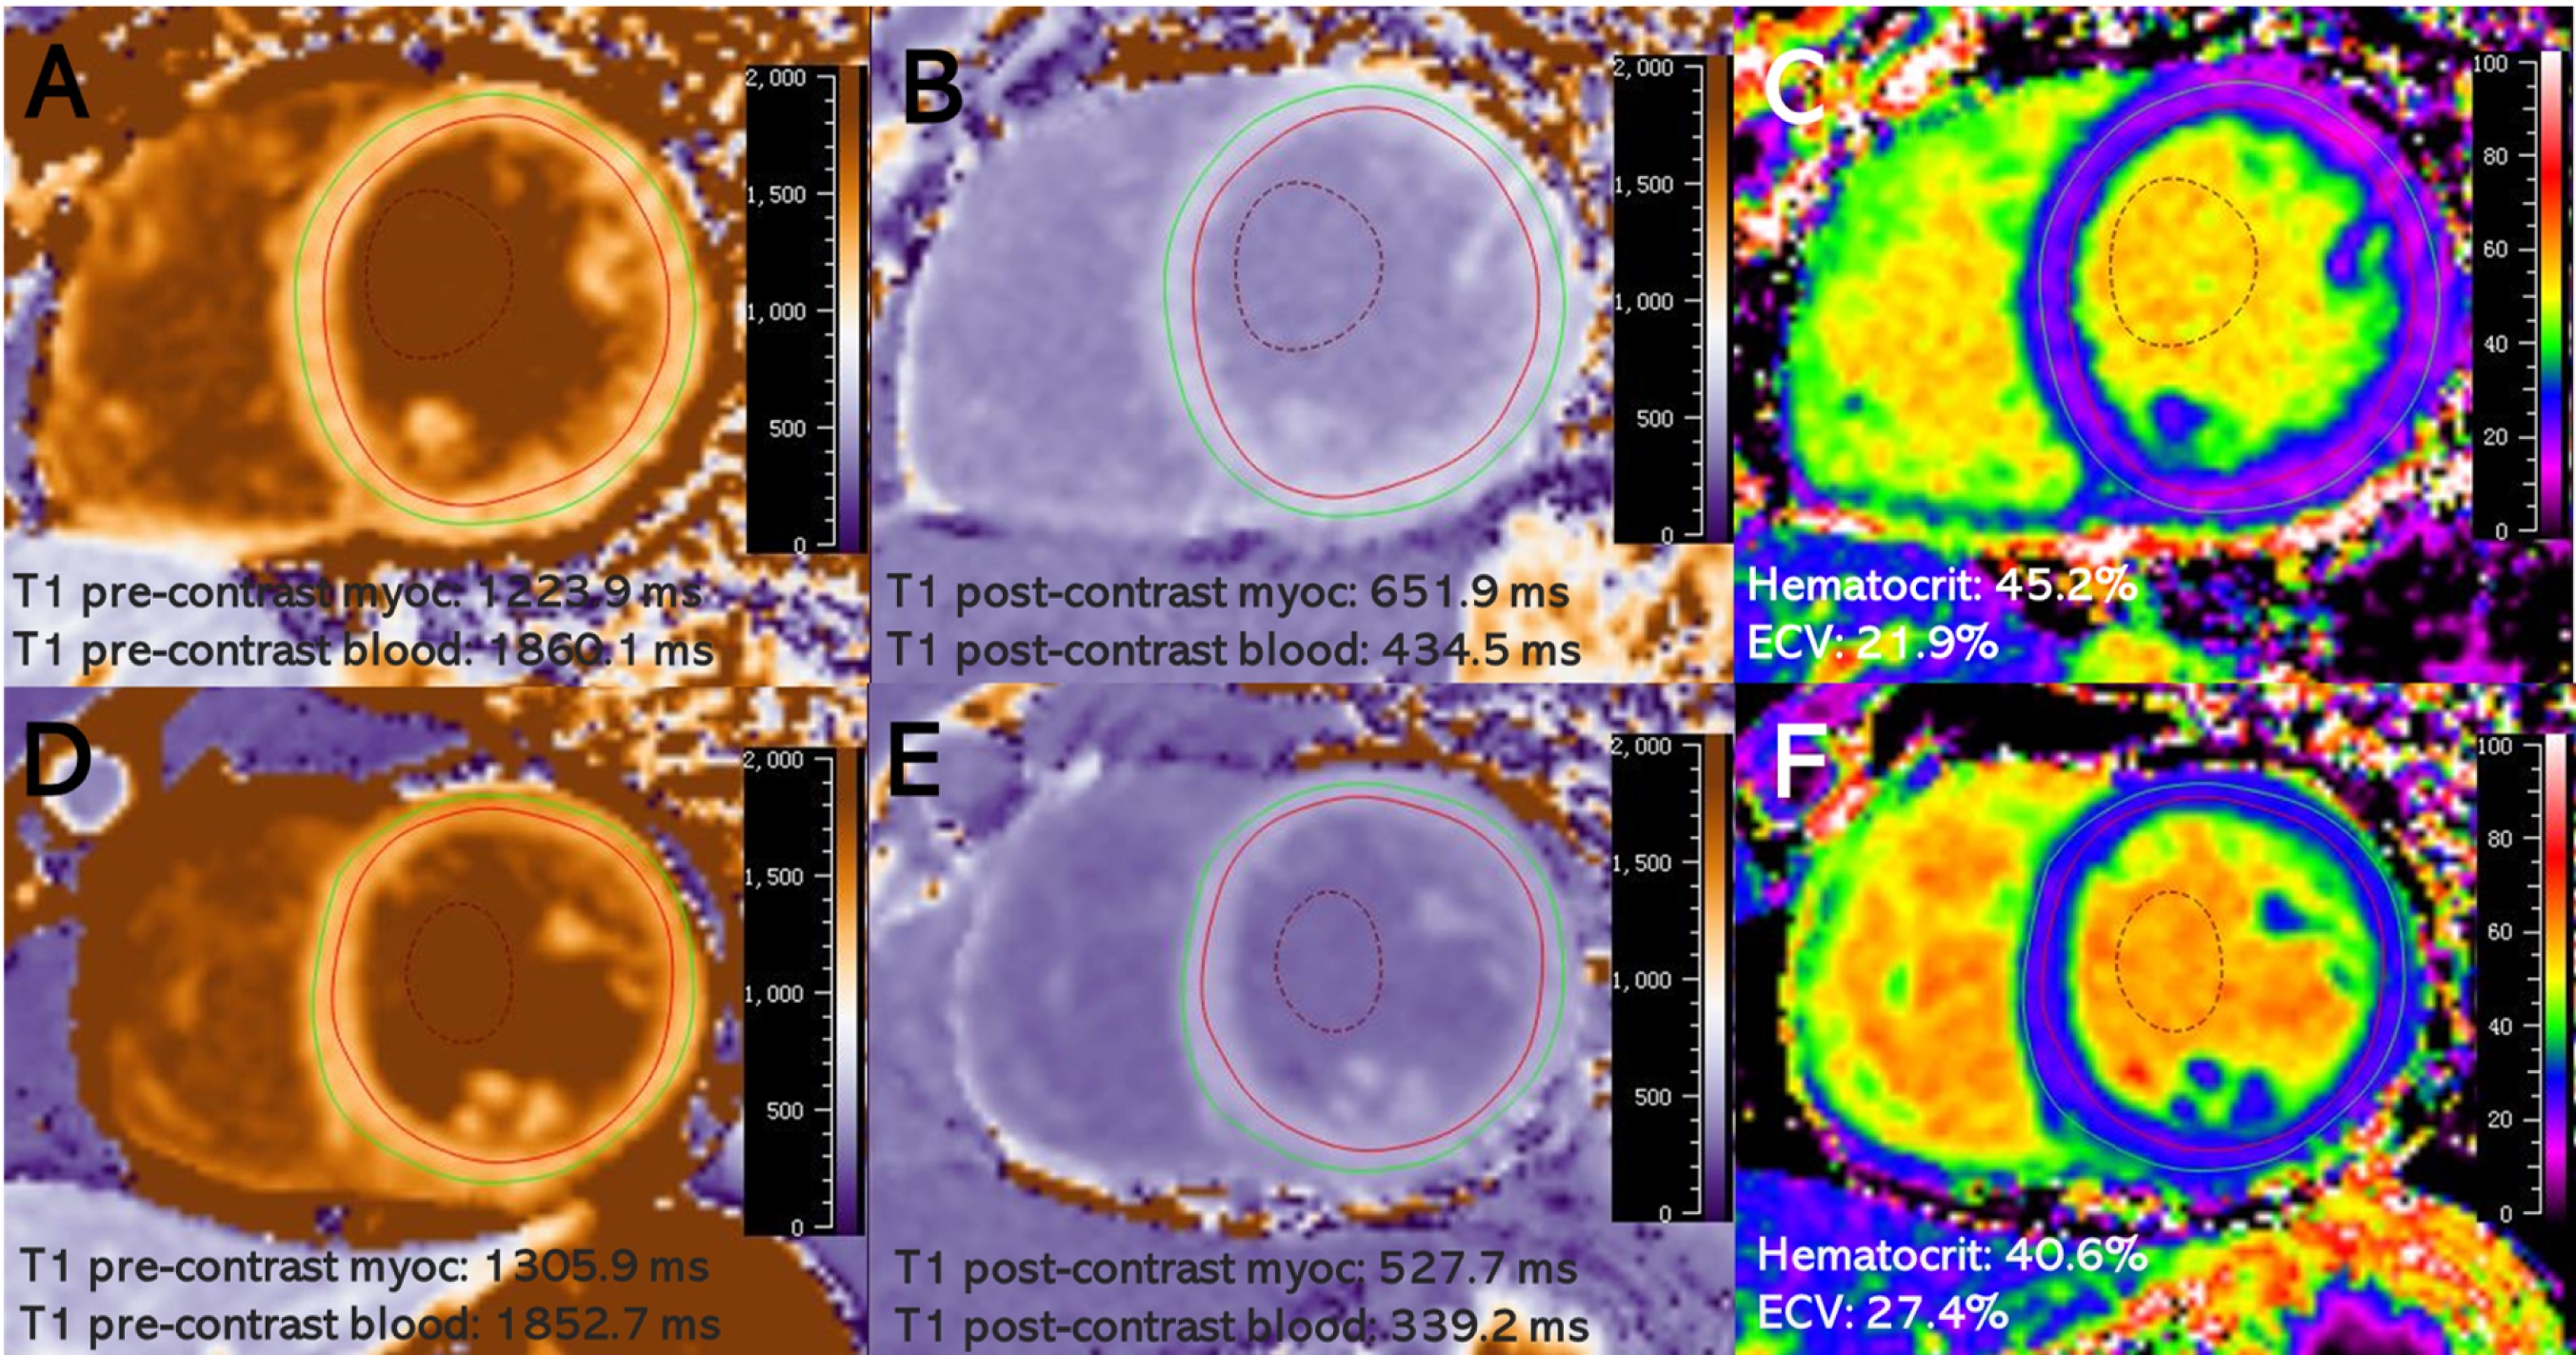
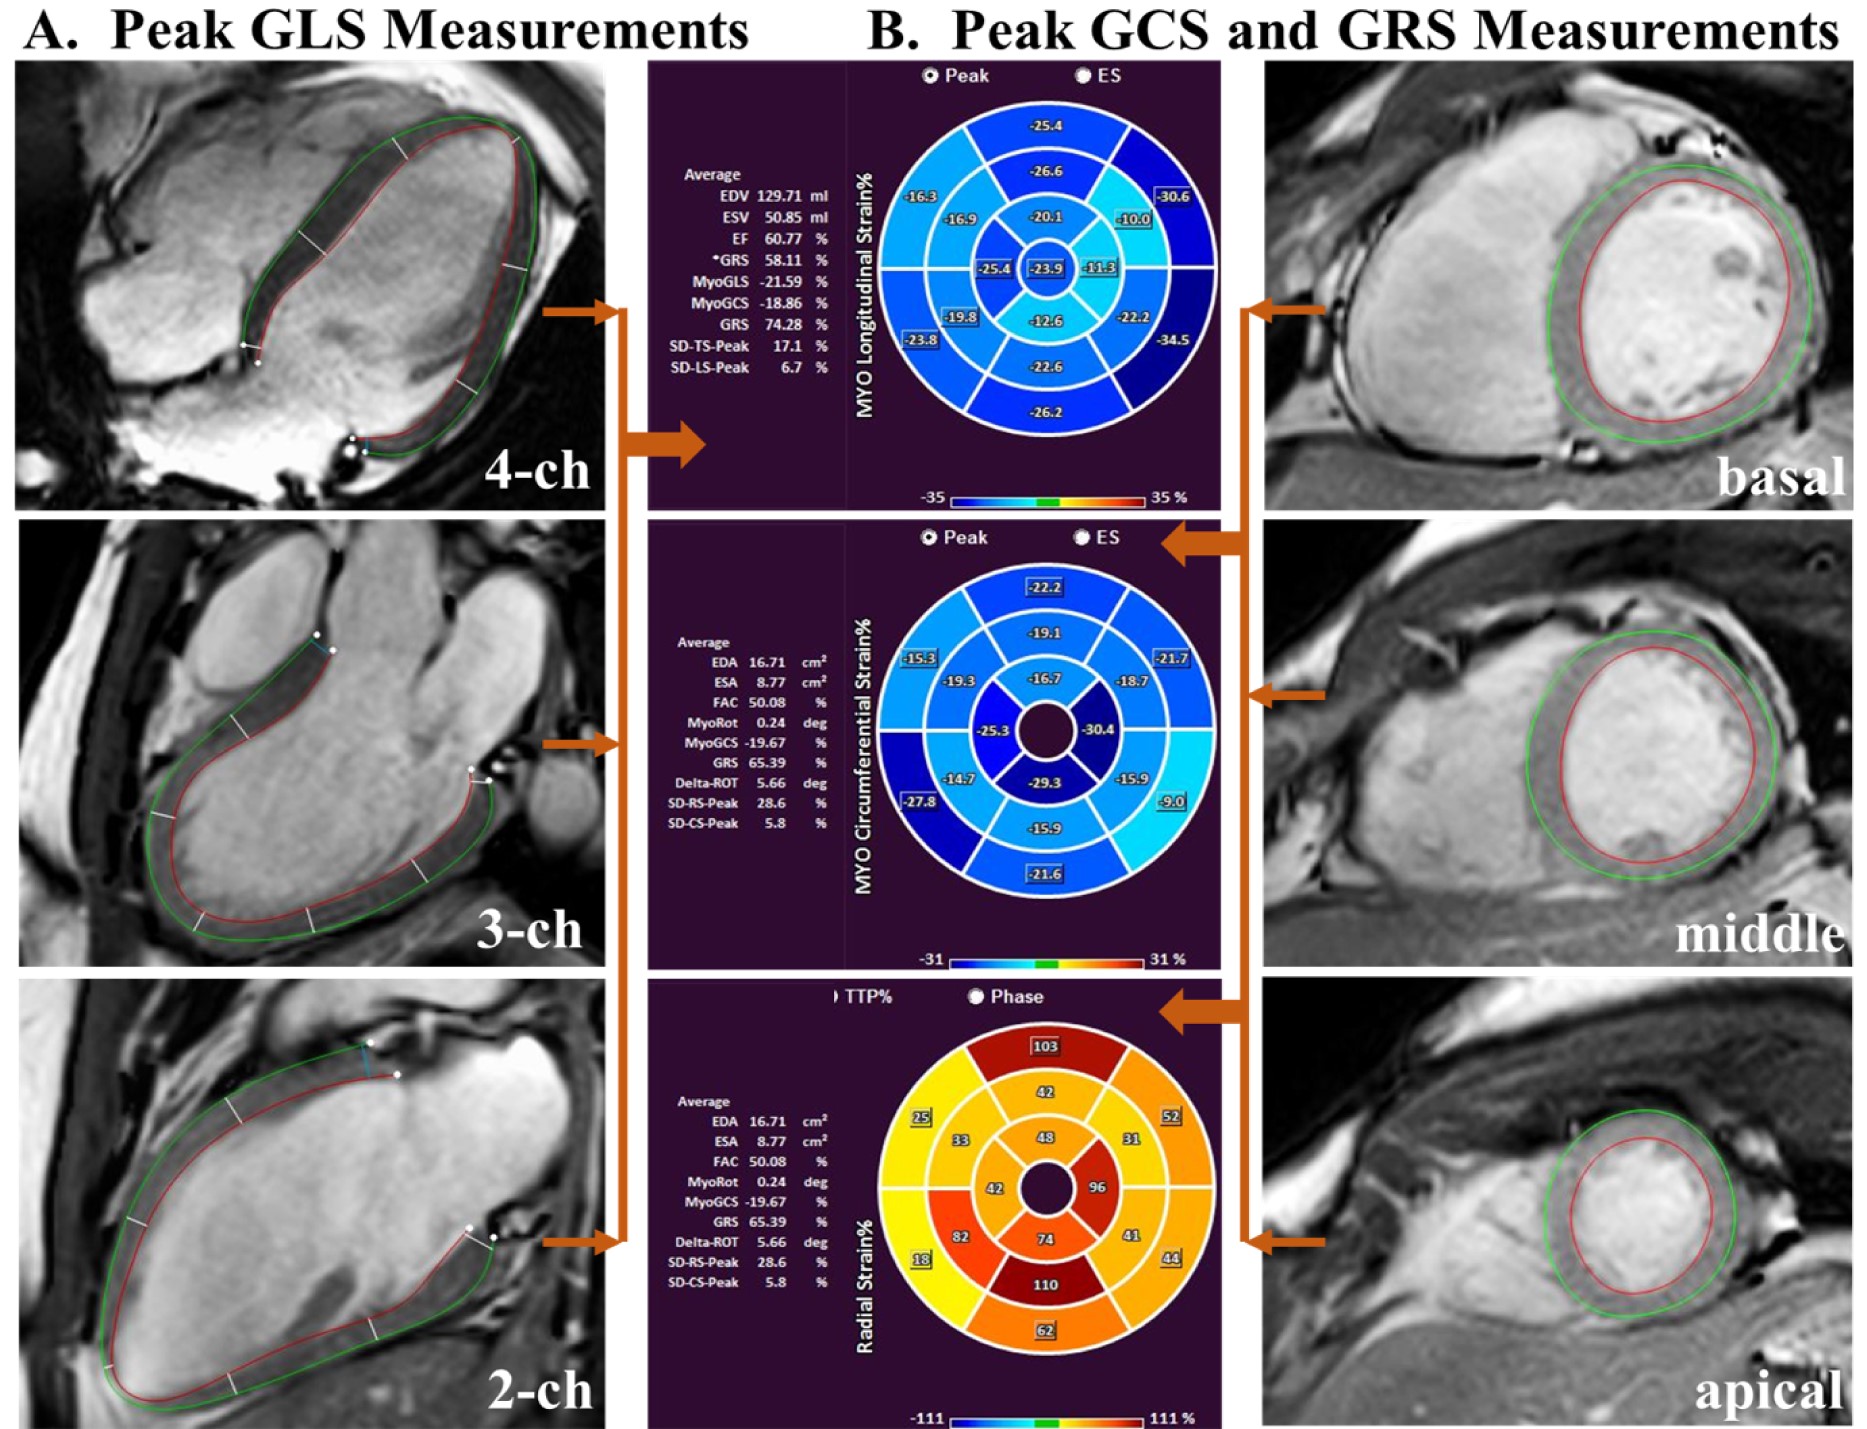
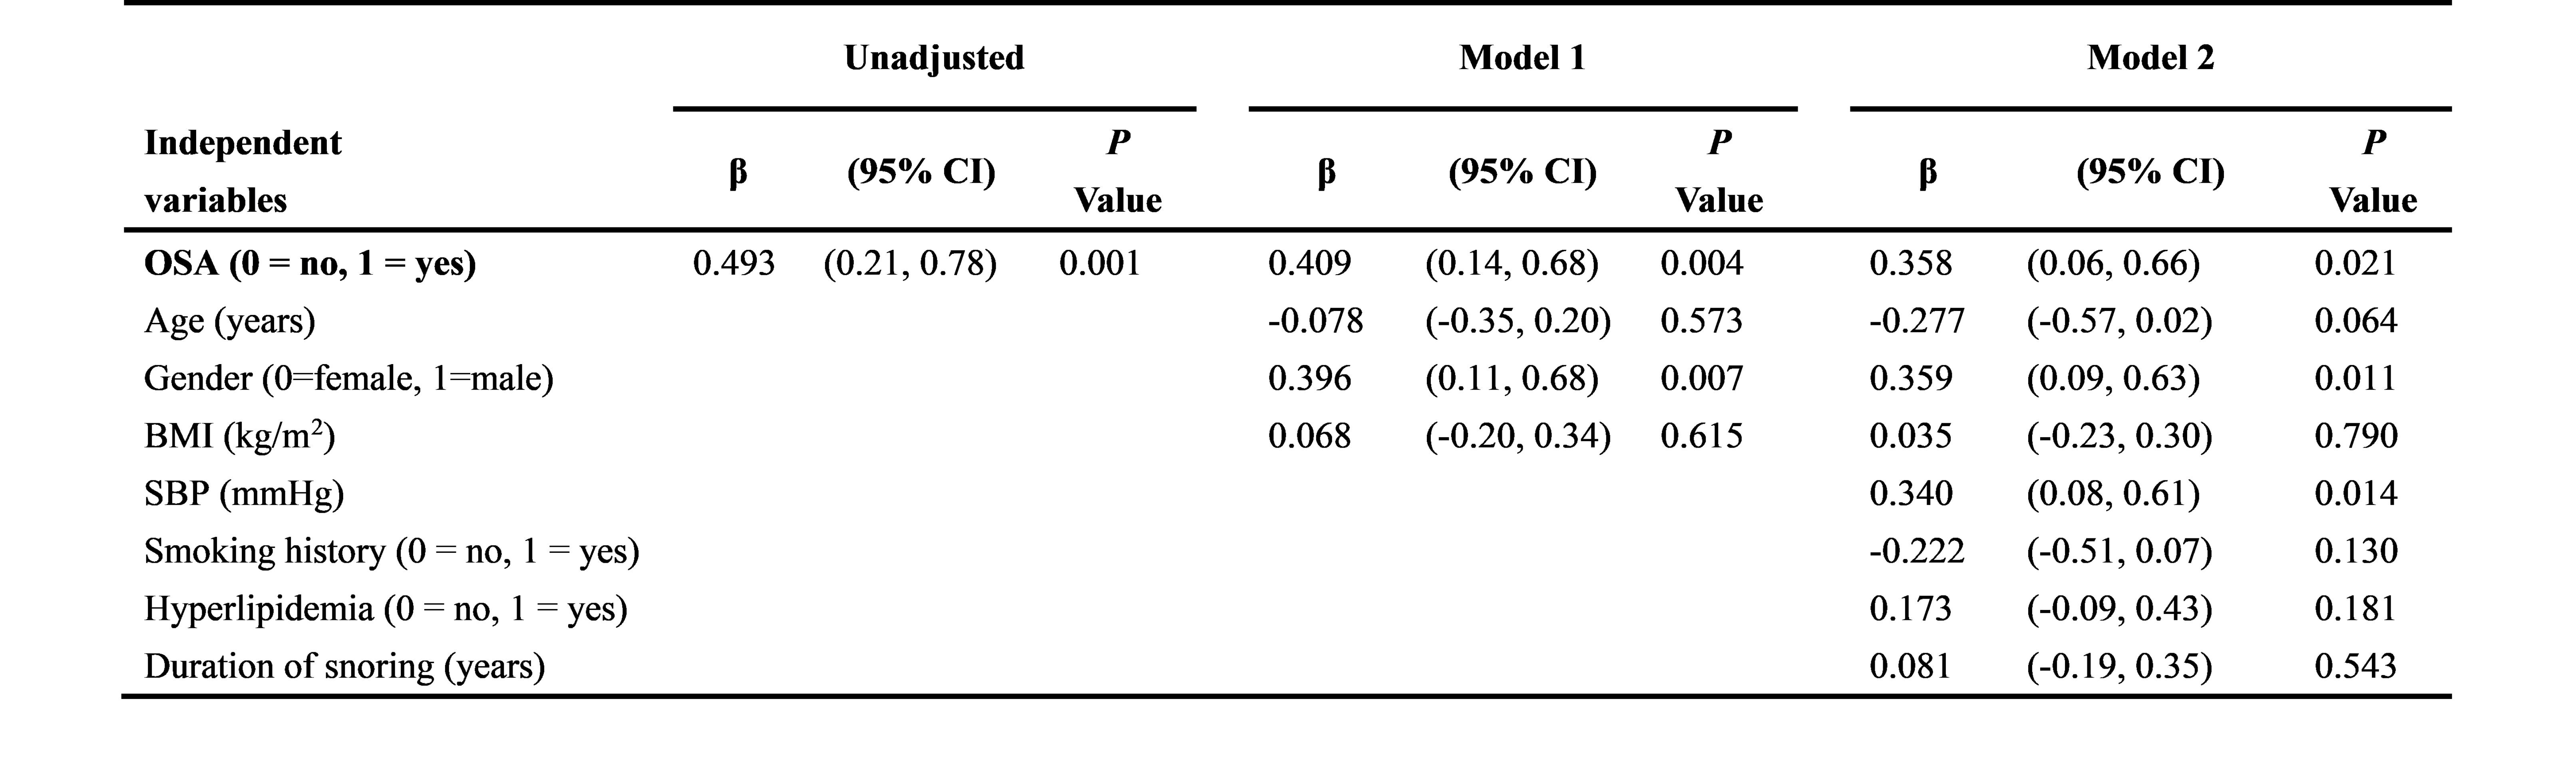
All 41 participants without major cardiovascular diseases were recruited from the Sleep Center of our hospital for snoring or sleeping problems. After an overnight polysomnography examination, all participants underwent standard CMR imaging protocol on a 3.0 T clinical scanner (Ingenia, Philips Medical Systems, Best, the Netherlands), with a 32-channel coil for signal reception. CMR scans were used to evaluate LV function, volume, structure, deformation with feature tracking, diffuse myocardial fibrosis with T1 mapping and focal replacement fibrosis with late gadolinium enhancement (LGE) in these subjects. iECV obtained as LVMi/1.05×ECV% and iCV derived as (LVMi/1.05×[1–ECV%]) were recorded. Based on the apnea-hypopnea index (AHI), participants were divided into the OSA (AHI ≥ 5 events/h) and control (AHI < 5 events/h) groups. Statistical analysis was performed with SPSS and the GraphPad Prism software. Normally distributed continuous variables were expressed as mean ± standard deviation (SD), while skewed ones were expressed as median (interquartile range). Categorical variables were reported as number and frequency (%). Comparisons between the OSA and control groups were performed by the Student’s t-test, Mann-Whitney U test, Fisher’s exact test or Chi-square test as appropriate. Multiple linear regression analyses were applied to confirm the significant impact of OSA on LVMi value. Two-sided P values <0.05 was considered statistically significant.Results
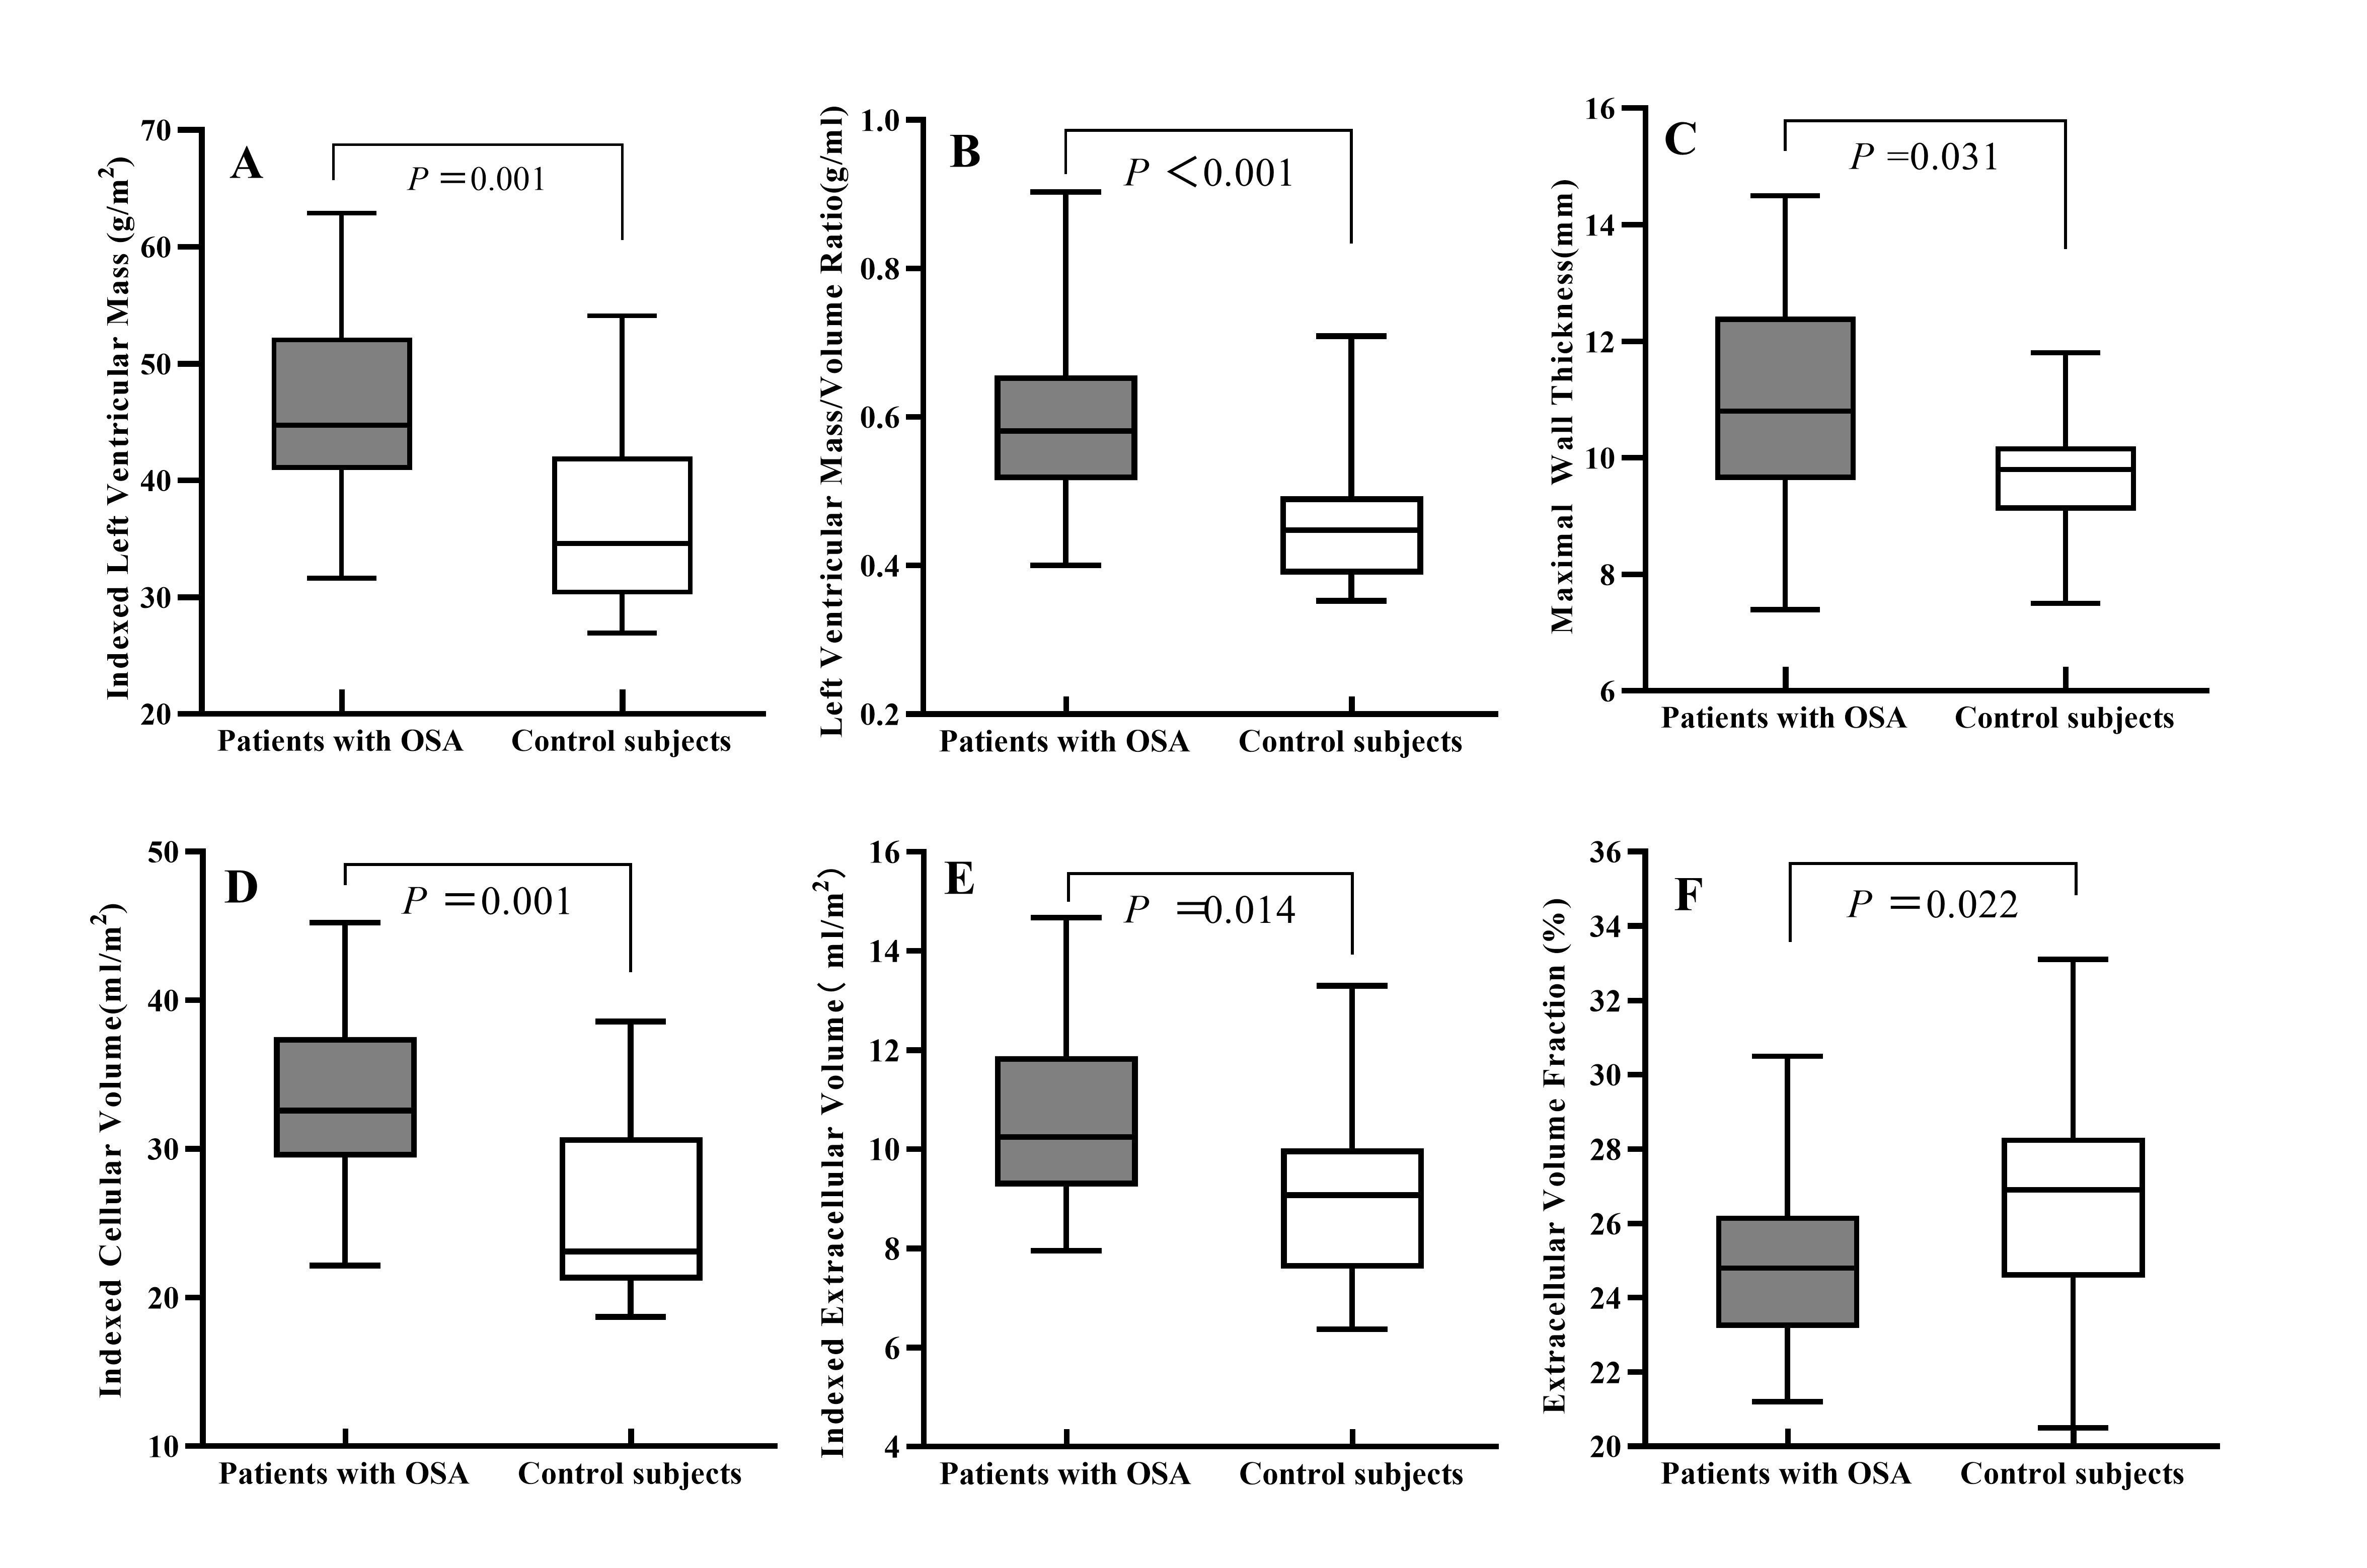
24 patients with OSA (AHI ≥ 5 events/h; age 42.7±11.6 years; 75% male) were compared with 17 controls (AHI < 5 events/h; age 41.2±8.2 years; 58.8% male). The subjects were predominantly middle-aged males without significant differences between the two groups. The OSA group had slightly elevated body mass index (26.5±3.6 kg/m2 vs. 24.4±2.5 kg/m2, P=0.04) compared with controls, and 9 (37.5%) OSA patients also had hypertension. The OSA group had higher LVMi value than control group (45.4±8.7 g/m2 vs. 36.1±7.7 g/m2, P = 0.001). Both groups kept preserved LV systolic function as demonstrated by similar LV ejection fraction, global longitudinal strain, global circumferential strain and global radial strain values (all P >0.05). Late gadolinium enhancement was not detected in these two groups, whereas ECV% was slightly decreased in the OSA group (24.7±2.1 % vs. 26.6±3.0%, P = 0.02). Compared with controls, iCV was greatly larger (median 32.6 ml/m2, interquartile range [IQR]: 29.4-37.5 vs. median 23.1 ml/m2, IQR: 21.2-30.8, P = 0.001), while iECV was slightly increased (10.6 ± 1.8 ml/m2 vs. 9.1 ± 1.9 ml/m2, P = 0.01). On multivariate linear regression analysis, OSA (β =0.358, P =0.021), male gender (β =0.359, P =0.011) and systolic blood pressure (β =0.340, P =0.014) were the strongest factor correlated with elevated LVMi.Conclusion
In conclusion, the presence of OSA is significantly associated with elevated LVMi. Elevated LVMi accompanied with normal LV systolic function in first diagnosed OSA patients may contribute to adaptive LV remodeling phase, which can be assessed with T1 mapping and feature tracking technique.Acknowledgements
No acknowledgement found.References
1. Chen X, Wang R, Zee P, et al. Racial/Ethnic Differences in Sleep Disturbances: The Multi-Ethnic Study of Atherosclerosis (MESA). Sleep. 2015;38(6):877-888.Y M, S U, A M, et al. Diffusion-weighted magnetic resonance imaging for detecting lymph node metastasis of rectal cancer. 2011; 35(4): 895-9.
2. Cuspidi C, Tadic M, Sala C, Gherbesi E, Grassi G, Mancia G. Targeting Concentric Left Ventricular Hypertrophy In Obstructive Sleep Apnea Syndrome. A Meta-Analysis of Echocardiographic Studies. Am J Hypertens. 2019: hpz198.
Figures