0994
Cardiac 1H MRS detected reduced myocardial triglycerides after Doxorubicin injection: an in vivo animal study1Siemens Medical Solutions USA, Inc., Boston, MA, United States, 2Department of Medicine, Cardiovascular Division, Beth Israel Deaconess Medical Center and Harvard Medical School, Boston, MA, United States, 3Siemens Healthcare Limited GB&I, Frimley, United Kingdom
Synopsis
Cardiotoxicity remains a side effect of chemotherapy agents. Non-invasive imaging including cardiac MR has been applied to assess cardiac injury in patients receiving chemotherapy. Alterations in cardiac energetics have been reported in previous studies but have not been widely investigated in vivo. In this study, single voxel 1H spectroscopy was applied to detect lipid metabolism changes in a large animal model. The results showed reduced myocardial triglycerides content in the doxorubicin-treated group in comparison with the control group.
Background
Cardiotoxicity remains a side effect of established chemotherapy agents or novel immune checkpoint inhibitors.1 Non-invasive imaging plays a major role in the detection and monitoring of patients undergoing cancer treatments. Previous studies have investigated the potential of cardiac MR in assessing cardiac injury in patients receiving chemotherapy via various methods, including left ventricular ejection fraction (LVEF), myocardial strain, T1/T2 mapping, and late gadolinium enhanced imaging.2-5 On the other hand, alterations in cardiac energetics have been reported in doxorubicin-induced cardiotoxicity.6-10 These alterations include damage to the mitochondria, reduced ATP production, and disorders in fatty acid metabolism. However, limited studies have investigated the associated metabolic changes in vivo.11,12In this study, we sought to detect cardiac lipid metabolism changes after doxorubicin treatment in a large animal model using 1H spectroscopy. Specifically, myocardial triglycerides (TG) content was quantified with in vivo single voxel 1H spectroscopy and compared between the treatment and control groups.
Methods
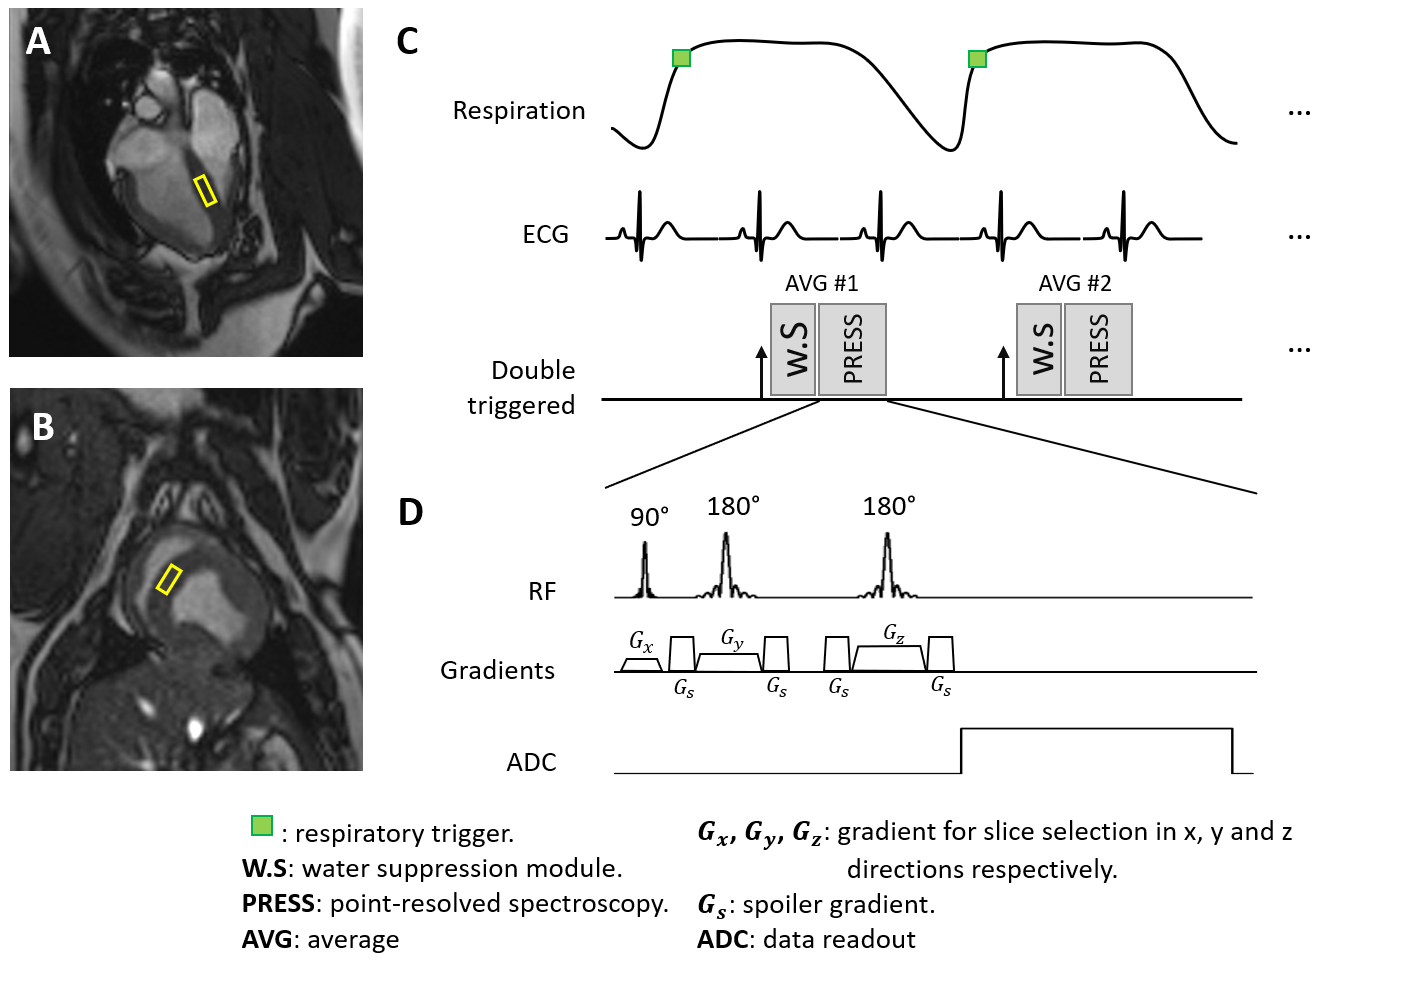
Seven healthy female 7-month-old Yucatan minipigs received doxorubicin by i.v. bolus every 3 weeks for a total of 4 cycles. Each injection was dosed at 75 mg/m2 based on body surfaced area. Cardiac MR scan was performed 3 weeks after the last doxorubicin injection. Three gender- and age-matched minipigs were scanned without doxorubicin exposure as control. All animals were scanned under isoflurane-maintained anesthesia on a 3T system (MAGNETOM Vida, Siemens Healthcare, Erlangen, Germany) using surface and spine coils for data reception. The study protocol was approved by the Institutional Animal Care and Use Committee.Cardiac MR was performed to acquire: (1) cine images on short-axis slices with TE = 1.4 ms, TR = 3.17 ms, temporal resolution = 25 ms, voxel size = 0.8x0.8x0.8 mm3; (2) 1H-MR spectra using point-resolved spectroscopy (PRESS) on a septal voxel (Fig.1) during free-breathing.13,14 Spectroscopy acquisition was respiratory triggered to end-expiration and ECG-triggered to end-systole to reduce adverse effects of motion on data quality. PRESS parameters included voxel size = 20x20x10 mm3, TE = 33 ms, 32 averages, 512 samples with 2500 Hz bandwidth, and effective TR > 2500 ms. Each spectrum took about 3min and 40s to acquire. Two spectra were acquired with and without water suppression respectively.
LVEF was calculated from the cine images using cvi42 software (Circle Cardiovascular Imaging Inc, Calgary, Canada). Water-suppressed spectra were fitted to estimate TG peaks at 0.9, 1.3 and 2.1 ppm, creatine at 3.02 ppm, trimethyl-ammonium (TMA) at 3.21 ppm and taurine at 3.39 ppm. Non-water-suppressed spectra were used to fit the water peak at 4.7 ppm.15 Myocardial TG content was calculated as the ratio of area under TG peaks at 0.9 and 1.3 ppm to area under water peak (TG/W). Creatine content (CR/W) and TG-to-creatine (TG/CR) ratio were also determined similarly. All spectra were fitted using the on-scanner software (syngo.MR Spectro, Siemens Healthcare, Erlangen, Germany) with a time-domain fitting algorithm with prior knowledges.16
LVEF, TG/W, CR/W, and TG/CR were compared between the treatment (DOX) and control (CTL) groups. Data are presented as mean ± standard deviation. T-test was used for statistical test with a significance level of 0.05.
Results
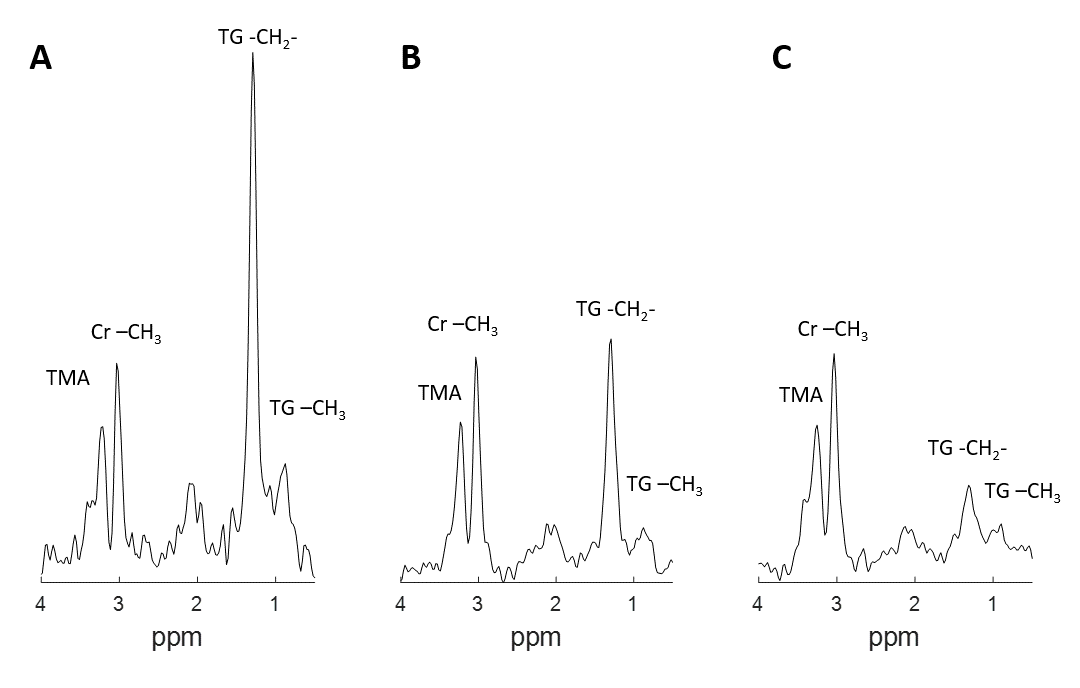
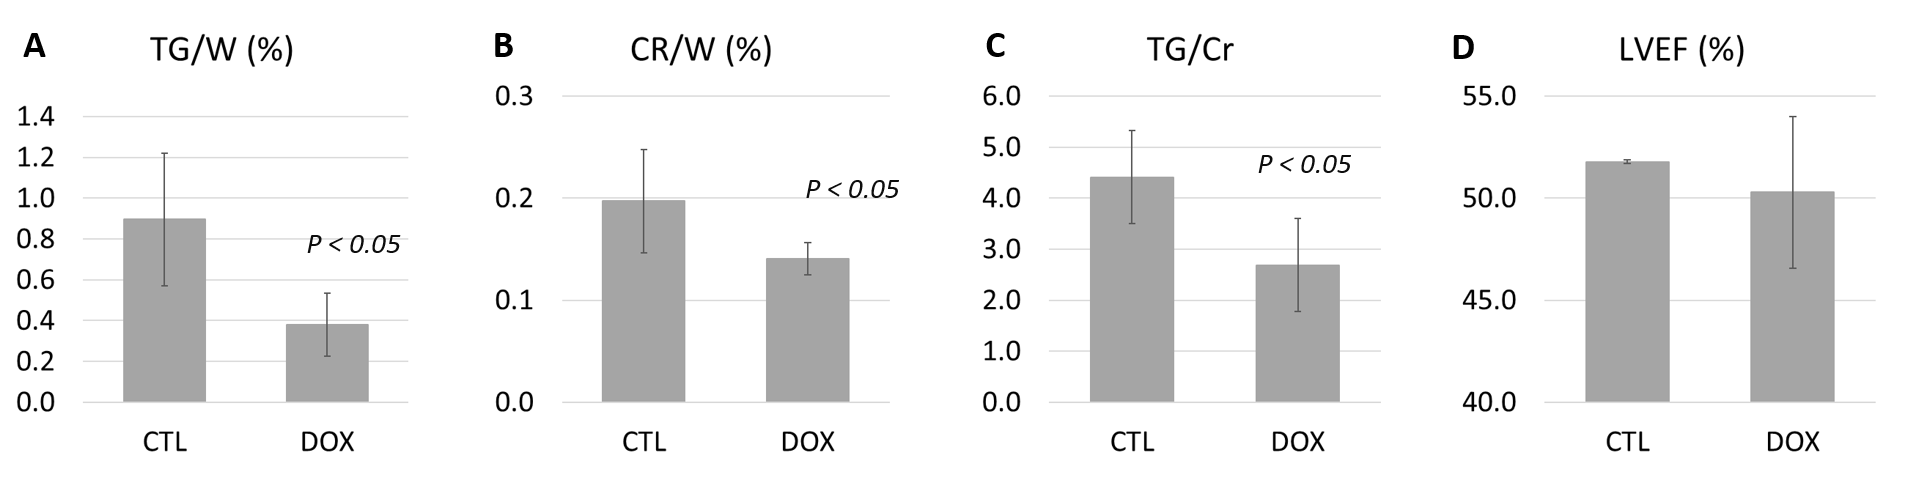
Fig.2 shows exemplary spectra from one CTL (A, TG/W = 1.13%) and two DOX animals (B-C, TG/W = 0.36% and 0.21% respectively). The TG peaks (relative to the creatine peak at 3.02 ppm) at 0.9 and 1.3 ppm of the DOX animals had lower magnitudes compared to those of the CTL animal.Fig.3 compares the function and metabolic measurements of all animals. Specifically, the TG/W, CR/W, and TG/Cr of DOX group decreased compared to the CTL group (TG/W, 0.37±0.15 vs. 0.89±0.32, P < 0.05; CR/W, 0.14±0.02 vs. 0.20±0.05, P<0.05; TG/Cr, 2.53±0.73 vs. 4.41±0.91, P < 0.05). The LVEF was not different between the two groups.
Discussion
Metabolic changes were detected using 1H spectroscopy following doxorubicin administration in an animal model. Compared to the control group, myocardial TG decreased in the DOX group, as demonstrated by a 58% deduction in TG/W and a 39% reduction in TG/CR. The creatine content of DOX group was also less than that of CTL group. These findings agree with prior metabonomic studies of cardiotoxicity that reported downregulation of multiple metabolites including triglycerides, glycerol, and creatine in the heart tissue.10,11 Further studies should investigate whether in vivo TG content quantitation can be a useful biomarker of cardiotoxicity.Acknowledgements
This project was funded by NIH 5R01HL127015-05 (PI: Nezafat).References
1. McGowan, John V., et al. "Anthracycline chemotherapy and cardiotoxicity." Cardiovascular drugs and therapy 31.1 (2017): 63-75.
2. Thavendiranathan, Paaladinesh, et al. "Cardiac MRI in the assessment of cardiac injury and toxicity from cancer chemotherapy: a systematic review." Circulation: Cardiovascular Imaging 6.6 (2013): 1080-1091.
3. Naresh, Nivedita K., et al. "Cardiac MRI Myocardial Functional and Tissue Characterization Detects Early Cardiac Dysfunction in a Mouse Model of Chemotherapy‐Induced Cardiotoxicity." NMR in Biomedicine 33.9 (2020): e4327.
4. Farhad, Hoshang, et al. "Characterization of the changes in cardiac structure and function in mice treated with anthracyclines using serial cardiac magnetic resonance imaging." Circulation: Cardiovascular Imaging 9.12 (2016): e003584.
5. Hong, Yoo Jin, et al. "Early detection and serial monitoring of anthracycline-induced cardiotoxicity using T1-mapping cardiac magnetic resonance imaging: an animal study." Scientific reports 7.1 (2017): 1-10.
6. Tokarska-Schlattner, Malgorzata, Theo Wallimann, and Uwe Schlattner. "Alterations in myocardial energy metabolism induced by the anti-cancer drug doxorubicin." Comptes rendus biologies 329.9 (2006): 657-668.
7. Tokarska-Schlattner, Malgorzata, et al. "New insights into doxorubicin-induced cardiotoxicity: the critical role of cellular energetics." Journal of molecular and cellular cardiology 41.3 (2006): 389-405.
8. Nagendran, Jeevan, et al. "Cardiomyocyte specific adipose triglyceride lipase overexpression prevents doxorubicin induced cardiac dysfunction in female mice." Heart 99.14 (2013): 1041-1047.
9. Niu, Qian-Yun, et al. "1H NMR based metabolomic profiling revealed doxorubicin-induced systematic alterations in a rat model." Journal of pharmaceutical and biomedical analysis 118 (2016): 338-348.
10. Dallons, Matthieu, et al. "New Insights About Doxorubicin-Induced Toxicity to Cardiomyoblast-Derived H9C2 Cells and Dexrazoxane Cytoprotective Effect: Contribution of In Vitro 1H-NMR Metabonomics." Frontiers in Pharmacology 11 (2020).
11. Eidenschink, Andrea B., et al. "Myocardial high-energy phosphate metabolism is altered after treatment with anthracycline in childhood." Cardiology in the young 10.6 (2000): 610-617.
12. Maslov, M. Y., et al. "Reduced in vivo high-energy phosphates precede adriamycin-induced cardiac dysfunction." American Journal of Physiology-Heart and Circulatory Physiology 299.2 (2010): H332-H337.
13. Bottomley, Paul A. "Selective volume method for performing localized NMR spectroscopy." U.S. Patent No. 4,480,228. 30 Oct. 1984.
14. Felblinger, Jacques, et al. "Methods and reproducibility of cardiac/respiratory double‐triggered 1H‐MR spectroscopy of the human heart." Magnetic Resonance in Medicine: An Official Journal of the International Society for Magnetic Resonance in Medicine 42.5 (1999): 903-910.
15. Chang, Kuang-Fu, et al. "Left Ventricular Function and Myocardial Triglyceride Content on 3T Cardiac MR Predict Major Cardiovascular Adverse Events and Readmission in Patients Hospitalized with Acute Heart Failure." Journal of clinical medicine 9.1 (2020): 169.
16. Weiland, Elisabeth. "Automatische Quantifizierung von Metabolitenkonzentrationen in: i: in vivo:/i: Spektren." (2004).
Figures