0993
2D High Resolution Myocardial TRAFF2 Mapping: Reproducibility and Accuracy
Joao Tourais1, Ingo Hermann1,2, Rick Voncken3, Ömer Burak Demirel4, Sebastian Weingärtner1, and Mehmet Akcakaya4
1Magnetic Resonance Systems Lab, Department of Imaging Physics, TU Delft, Delft, Netherlands, 2Computer Assisted Clinical Medicine, Medical Faculty Mannheim, Heidelberg University, Mannheim, Germany, 3Scannexus BV, Maastricht, Netherlands, 4Department for Electrical and Computer Engineering, and Center for Magnetic Resonance Research, University of Minnesota, Minnesota, MN, United States
1Magnetic Resonance Systems Lab, Department of Imaging Physics, TU Delft, Delft, Netherlands, 2Computer Assisted Clinical Medicine, Medical Faculty Mannheim, Heidelberg University, Mannheim, Germany, 3Scannexus BV, Maastricht, Netherlands, 4Department for Electrical and Computer Engineering, and Center for Magnetic Resonance Research, University of Minnesota, Minnesota, MN, United States
Synopsis
Relaxation Along a Fictitious Field (RAFF) times in the 2nd rotating frame (TRAFF2) have shown promise for the depiction of acute myocardial infarct in a mouse model. In this work, in vivo myocardial TRAFF2 maps are acquired in a single breath-hold at 3T. An additional image was acquired following saturation preparation to enable reconstruction with a three-parameter fit model. Visually high-quality map quality, homogeneous signal, artifact resilience and low inter-scan variability were achieved with TRAFF2 in vivo. This makes TRAFF2 an excellent candidate for myocardial tissue characterization in clinical use.
Introduction
Relaxation Along a Fictitious Field (RAFF)1,2 has been recently proposed as a new imaging biomarker. RAFF times in the 2nd rotating frame (TRAFF2) have shown promise for the depiction of acute myocardial infarct and chronic scar in a mouse model at 9.4T3. Specifically, TRAFF2 maps have the potential to accurately determine myocardial infarct size without the use of contrast agents and with clinically tolerable specific absorption rate (SAR).The purpose of this study was to demonstrate the feasibility of TRAFF2 mapping in the myocardium on a clinical 3T scanner with a standard body transmitter. The accuracy and reproducibility of TRAFF2 with two different fit models were assessed in phantoms and in vivo.
Methods
Images were acquired in two phantoms and two healthy subjects on a 3T scanner (Siemens Magnetom Prisma) using the body coil for transmission, and a 24 channel receive array. TRAFF2 maps were obtained from five images using multiple (0 to 4) repetitions of RAFF2 preparation blocks2 (Fig. 1), with a block duration of 8 ms. After each RAFF pulse, randomized spoiling with a duration of 300 μseconds was interleaved in the acquisition. Additionally, after the acquisition of all the RAFF2-weighted images, an image immediately preceded by a saturation pulse was acquired. The latter captures the effect of imaging pulses on the magnetization curve and enables the use of a three-parameter fit model. All end-diastolic images were preceded by a rest-period of 4 seconds to allow for signal recovery4. Relaxation times TRAFF2 were calculated using a three- (3P) and a two-parameter (2P) fit model (where the saturation prepared image was excluded). Standard deviation (SD) maps in ms were obtained from the fit residuals5 to obtain a spatially resolved estimation of the TRAFF2 precision. The following parameters were used for TRAFF2 mapping in phantoms and in vivo: FOV: 300x225mm2; In-plane resolution: 2.0x2.0mm2; Slice thick.: 10mm; GRAPPA factor: 2; Readout type: bSSFP; FA: 70°; Segments: 57; TE = 1.41 ms. SAR burden remained under the threshold for standard operation, and no first-level mode was enabled. For reference, in the phantom experiments, a T2 prepared-based bSSFP T2 mapping sequence was acquired with TE-T2prep = 0, 30, 60, 120ms, and similar imaging parameters6. End-diastolic myocardial TRAFF2 mapping acquisitions were performed during a single breath-hold in healthy subjects. To assess inter-scan reproducibility, 3 scan repetitions were performed in separate breath-holds in the in vivo experiments.Results
A representative case of a phantom TRAFF2 map and the corresponding SD map is shown in Fig. 2. Phantom measurements show good sensitivity of RAFF2 relaxation maps to changes in the phantom composition (Fig. 3), with moderate correlation (R2=0.78) with T2 times (T2 16-450ms). RAFF times obtained with a 3P fit are consistently lower than 2P, as expected from literature.In vivo myocardial TRAFF2 maps were obtained with high visual map quality and low variability throughout the healthy myocardium (Fig. 4). A largely homogeneous depiction of the myocardium is visible with both 2P and 3P (Fig. 4A-B). Inter-scan voxel-wise variability (Fig. 5C) is comparable to the intra-scan variability obtained from the SD maps (Fig. 5B), showing excellent reproducibility. Consistently higher TRAFF2 values were observed when using a 2P fit compared to a 3P fit (Fig. 4C). The bullseye plot with the mean TRAFF2 times for the three measurements shows homogeneous values for the healthy volunteer (Fig. 5D). No B1+ or B0 related artifacts are visually apparent in the TRAFF2 maps.
Discussion
In this work, we demonstrate the feasibility of in vivo myocardial TRAFF2 mapping at 3T in a single breath-hold. Homogeneous maps of high visual quality were obtained for phantom and in-vivo.Adding a saturation prepared image enables the use of a three-parameter fit. Three parameter fits have previously been reported to increase the consistency of the relaxation time measurements across different sampling patterns4 and the resilience to changes in scan parameters and other confounders4,7,8.
The homogeneous signal and artifact resilience make TRAFF2 an excellent candidate for clinical use. Voxel-wise inter-scan variability was found comparable to intra-scan variability indicating excellent reproducibility of the TRAFF2 mapping sequence. In combination with the clinically acceptable SAR, RAFF2 mapping could provide a promising candidate for the non-contrast evaluation of scar in ischemic and non-ischemic heart disease.
Conclusion
Myocardial RAFF2 mapping achieves visually high-quality maps, homogeneous signal, artifact resilience, and low inter-scan variability without the use of contrast agents and with clinically tolerable SAR.Acknowledgements
S.W. acknowledges funding from the 4TU Precision Medicine program, a NWO Start-up STU.019.024 and ZonMW OffRoad 04510011910073.References
- Liimatainen, T., Sorce, D.J., O'Connell, R., Garwood, M. and Michaeli, S. (2010), MRI contrast from relaxation along a fictitious field (RAFF). Magn. Reson. Med., 64: 983-994.
- Liimatainen, T., Hakkarainen, H., Mangia, S., Huttunen, J.M., Storino, C., Idiyatullin, D., Sorce, D., Garwood, M. and Michaeli, S. (2015), MRI contrasts in high rank rotating frames. Magn. Reson. Med., 73: 254-262.
- Yla-Herttuala, E., Laidinen, S., Laakso, H. et al. Quantification of myocardial infarct area based on TRAFFn relaxation time maps - comparison with cardiovascular magnetic resonance late gadolinium enhancement, T1rho and T2 in vivo. J Cardiovasc Magn Reson 20, 34 (2018).
- Akçakaya, M., Basha, T.A., Weingartner, S., Roujol, S., Berg, S. and Nezafat, R. (2015), Improved quantitative myocardial T2 mapping: Impact of the fitting model. Magn. Reson. Med, 74: 93-105.
- Kellman, P., Arai, A.E. and Xue, H. T1 and extracellular volume mapping in the heart: estimation of error maps and the influence of noise on precision. J Cardiovasc Magn Reson 15, 56 (2013).
- Giri S, Chung YC, Merchant A, et al. T2 quantification for improved detection of myocardial edema. J Cardiovasc Magn Reson. 2009;11(1):56.
- Robson MD, Piechnik SK, Tunnicliffe EM, Neubauer S. T1 measurements in the human myocardium: the effects of magnetization transfer on the SASHA and MOLLI sequences. Magn Reson Med. 2013;70(3):664-670.
- Thiesson, S.B., Thompson, R.B. and Chow, K. Characterization of T1 bias from lipids in MOLLI and SASHA pulse sequences. J Cardiovasc Magn Reson 17, W10 (2015).
Figures
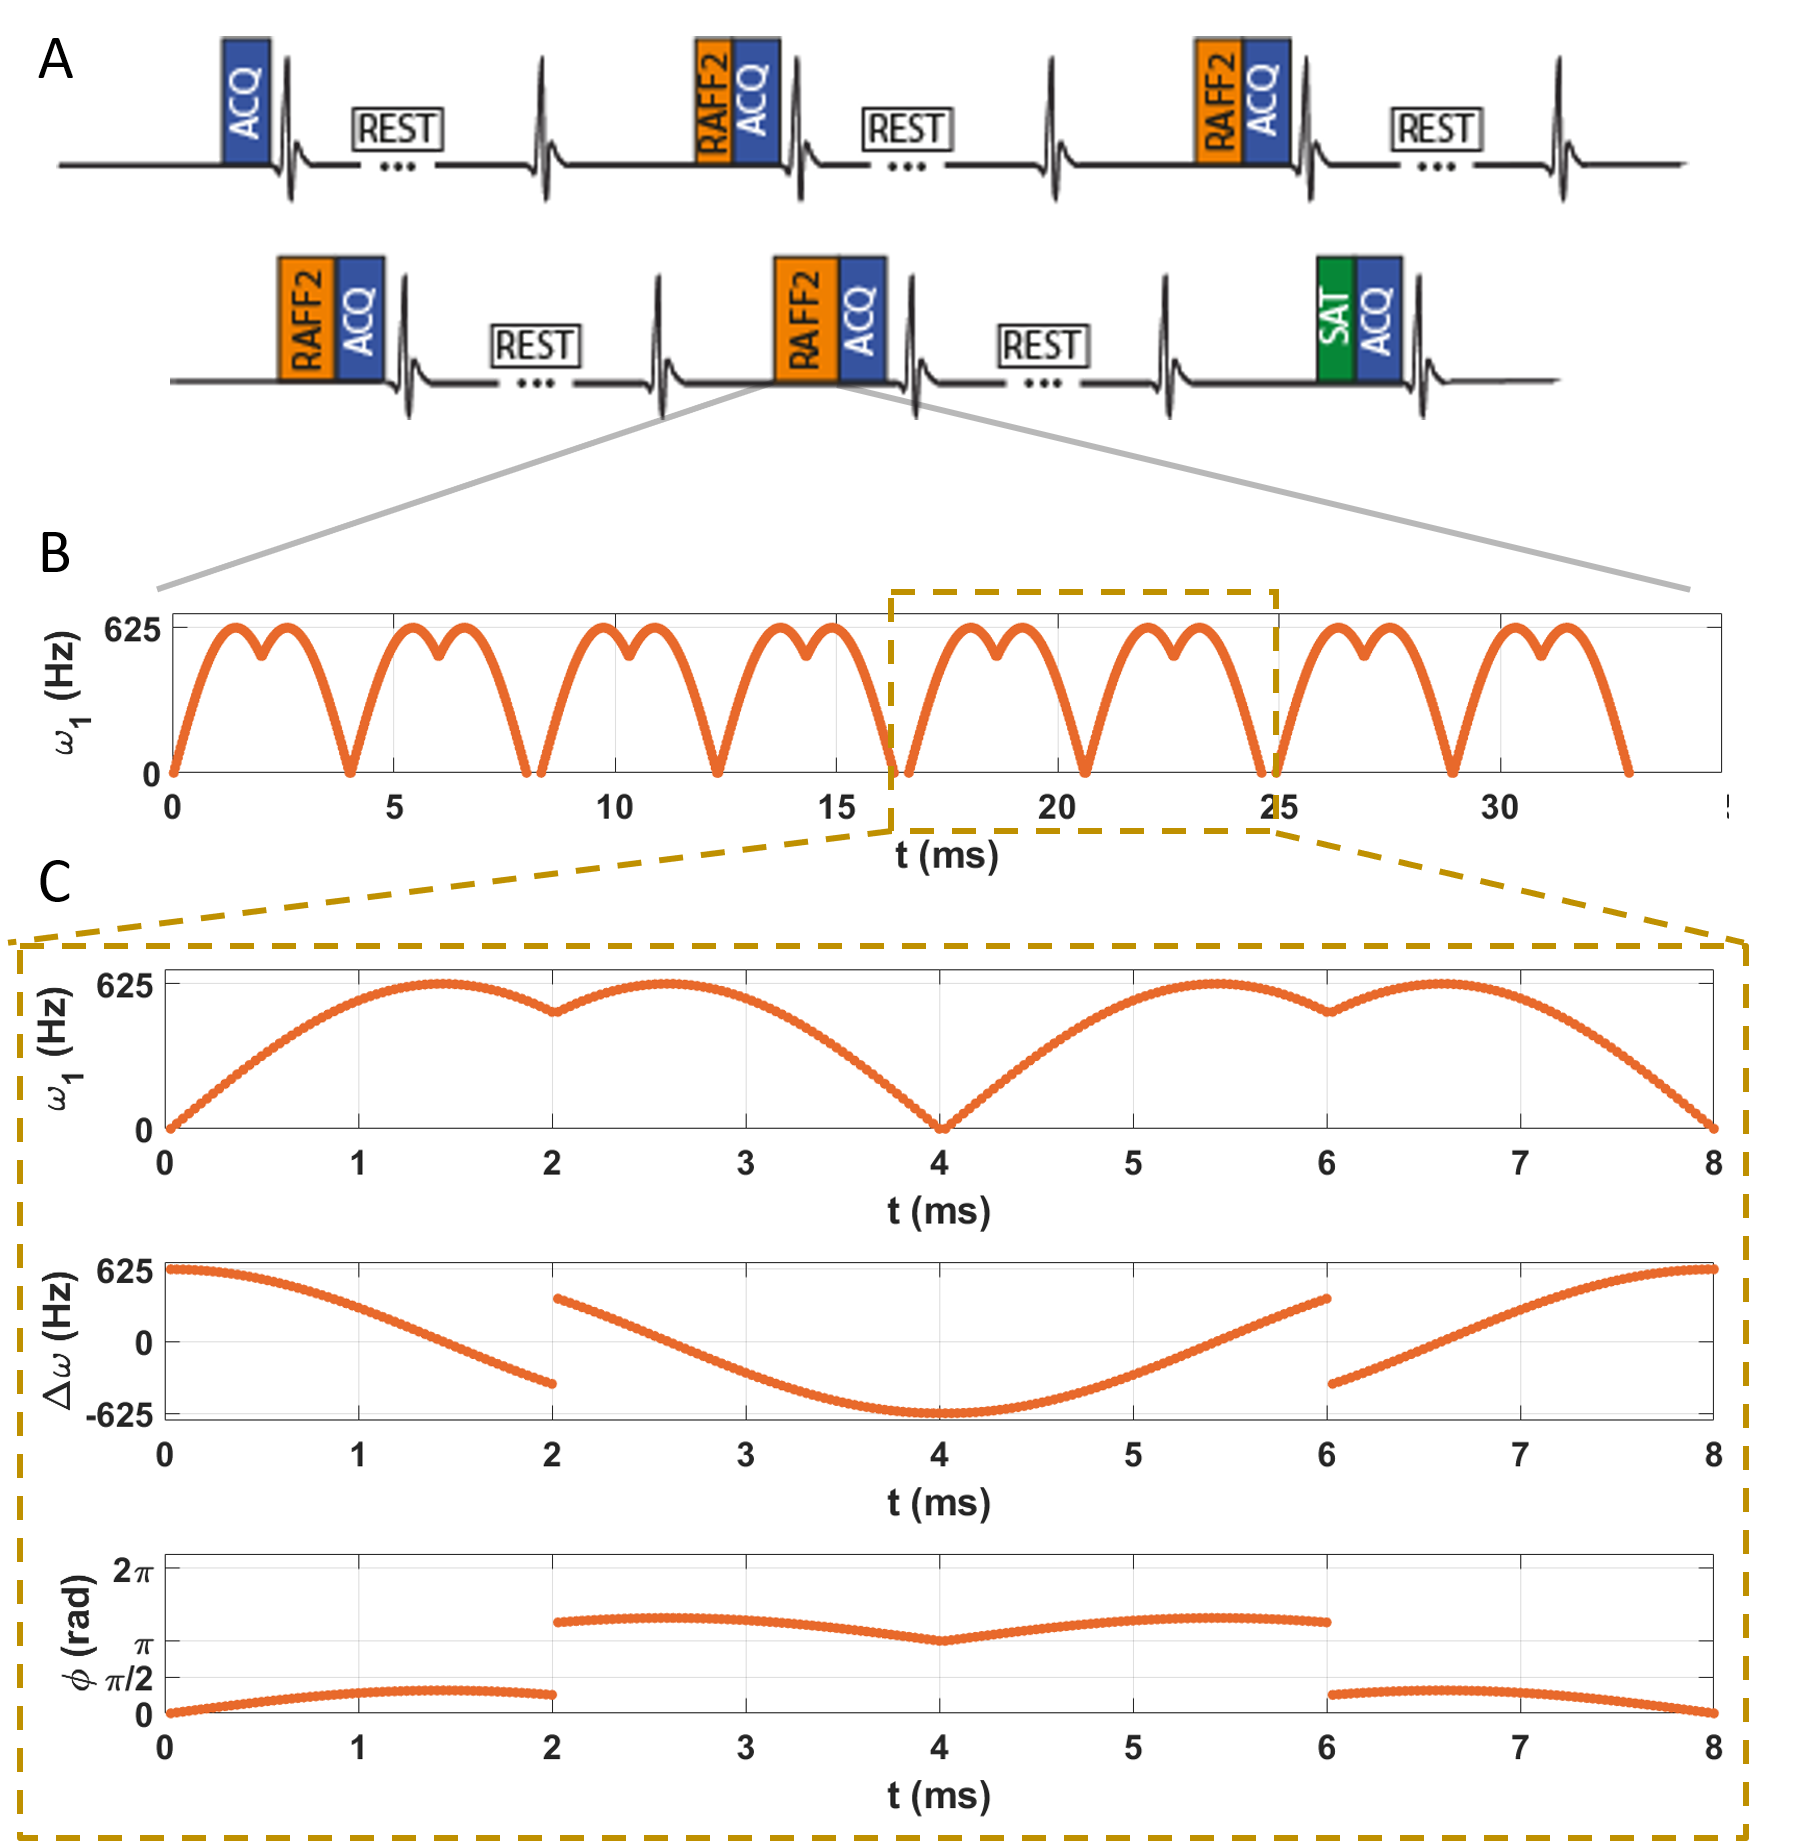
Fig. 1: Pulse sequence diagram for the myocardial TRAFF2 mapping sequence. A) 5 images with different TRAFF2-weighting using a train of RAFF2 preparation pulses are followed by a saturation image. 4 seconds rest-periods are interleaved in the acquisition to allow for magnetization recovery. Imaging is performed during a single breath-hold and with ECG triggering. B) RAFF pulse train with 4 RAFF2 pulse repetitions with interleaved blips. C) Single RAFF2 RF Pulse block. Top: Amplitude modulation function; Middle: Frequency-offset modulation; Bottom: Phase modulation function.
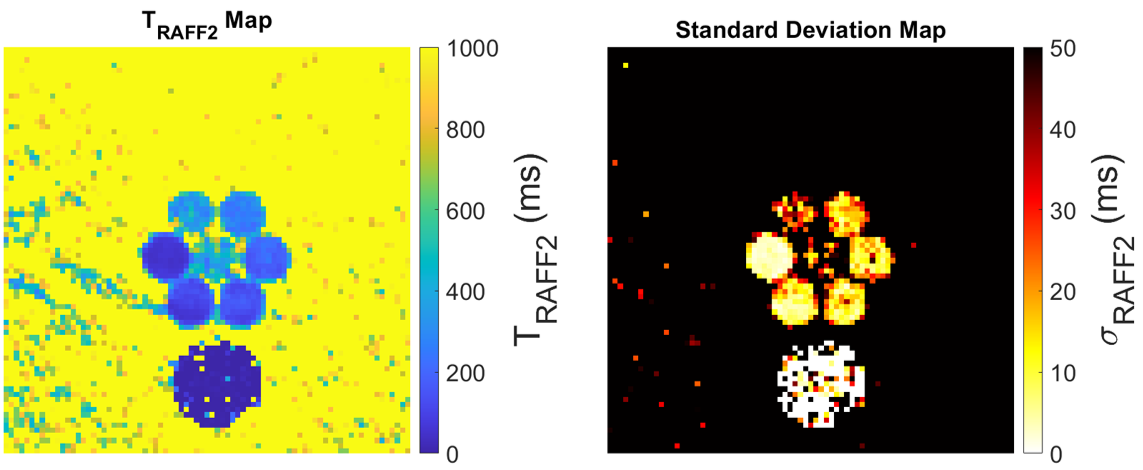
Fig. 2: Representative TRAFF2 map (left) and the corresponding standard deviation map (right). TRAFF2 values range from 57 to 448 ms in the 7 vials of the phantom; The coefficient of variation ranges from 6 to 13%, in this phantom experiment.
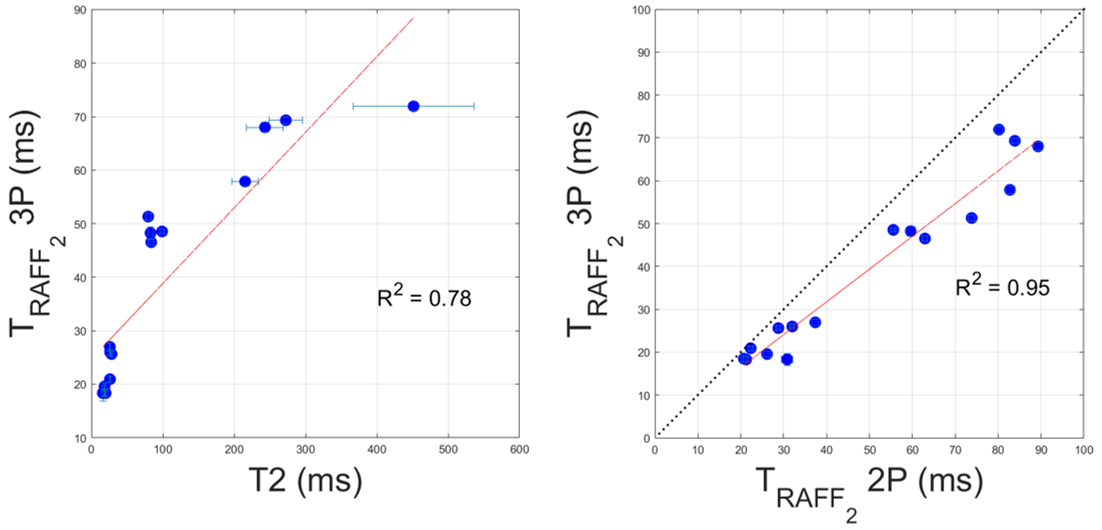
Fig. 3: A) T2 and TRAFF2 (three-parameter fit) values in phantom measurements. Good correlation between the relaxation properties in phantom is observed; B) Comparison between TRAFF2 values obtained with a three-parameter (3P) versus a two-parameter (2P) fit model.
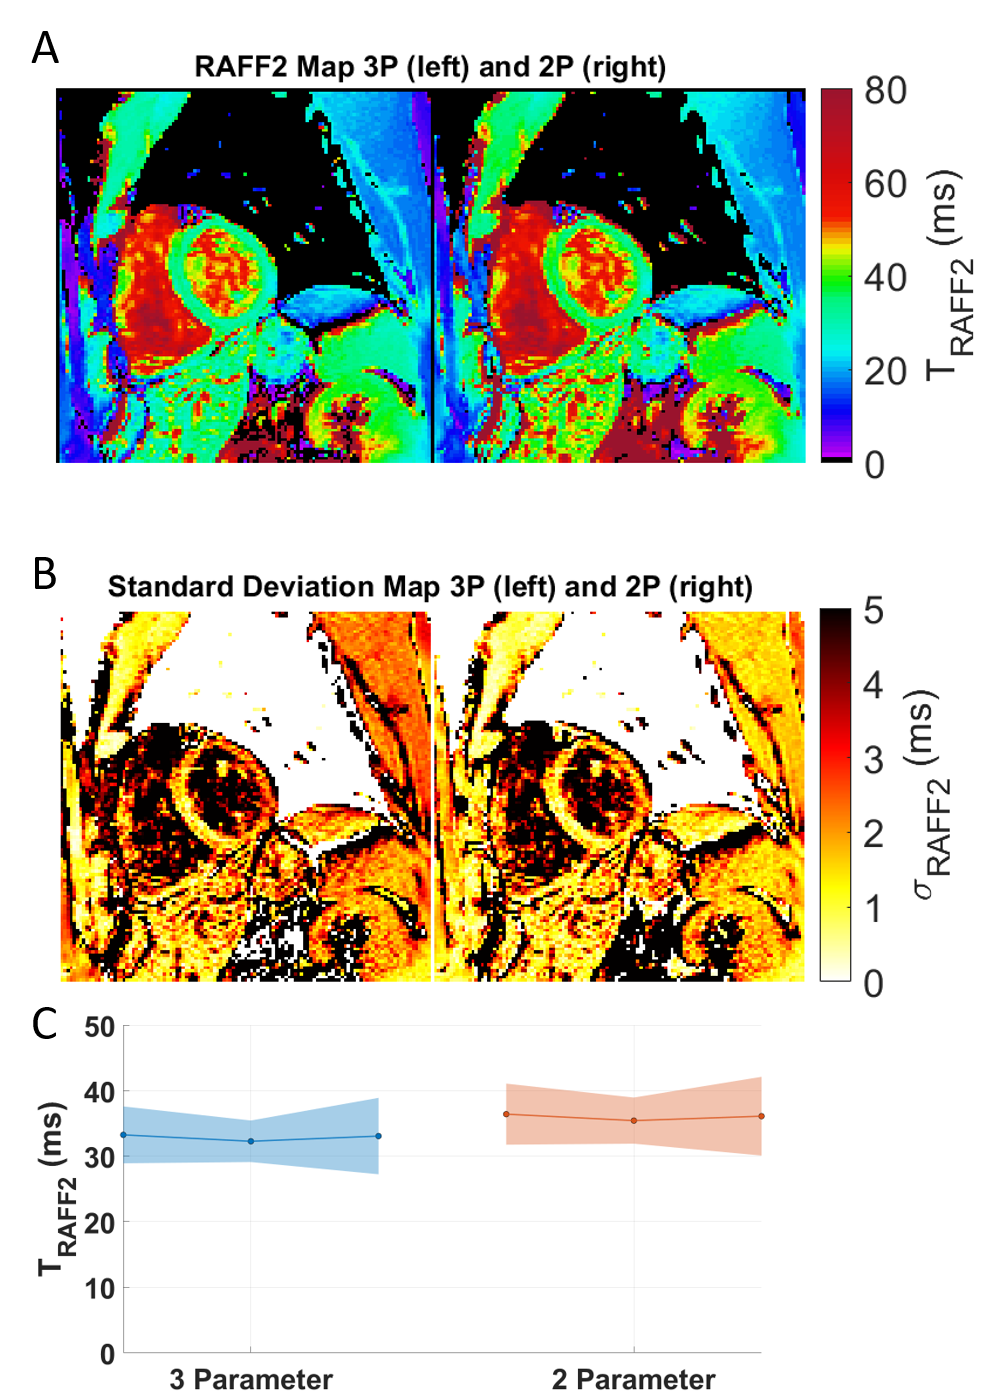
Fig. 4: TRAFF2 (A) and standard deviation maps (B) using a three-parameter (left) and a two-parameter (right) fit model, acquired in a healthy subject; Artifact-free parameter maps with largely homogeneous signal throughout the myocardium are obtained. C) Mean septal TRAFF2 relaxation times, for three separate scans and for the two fit models. The shading indicates intra-scan variability.
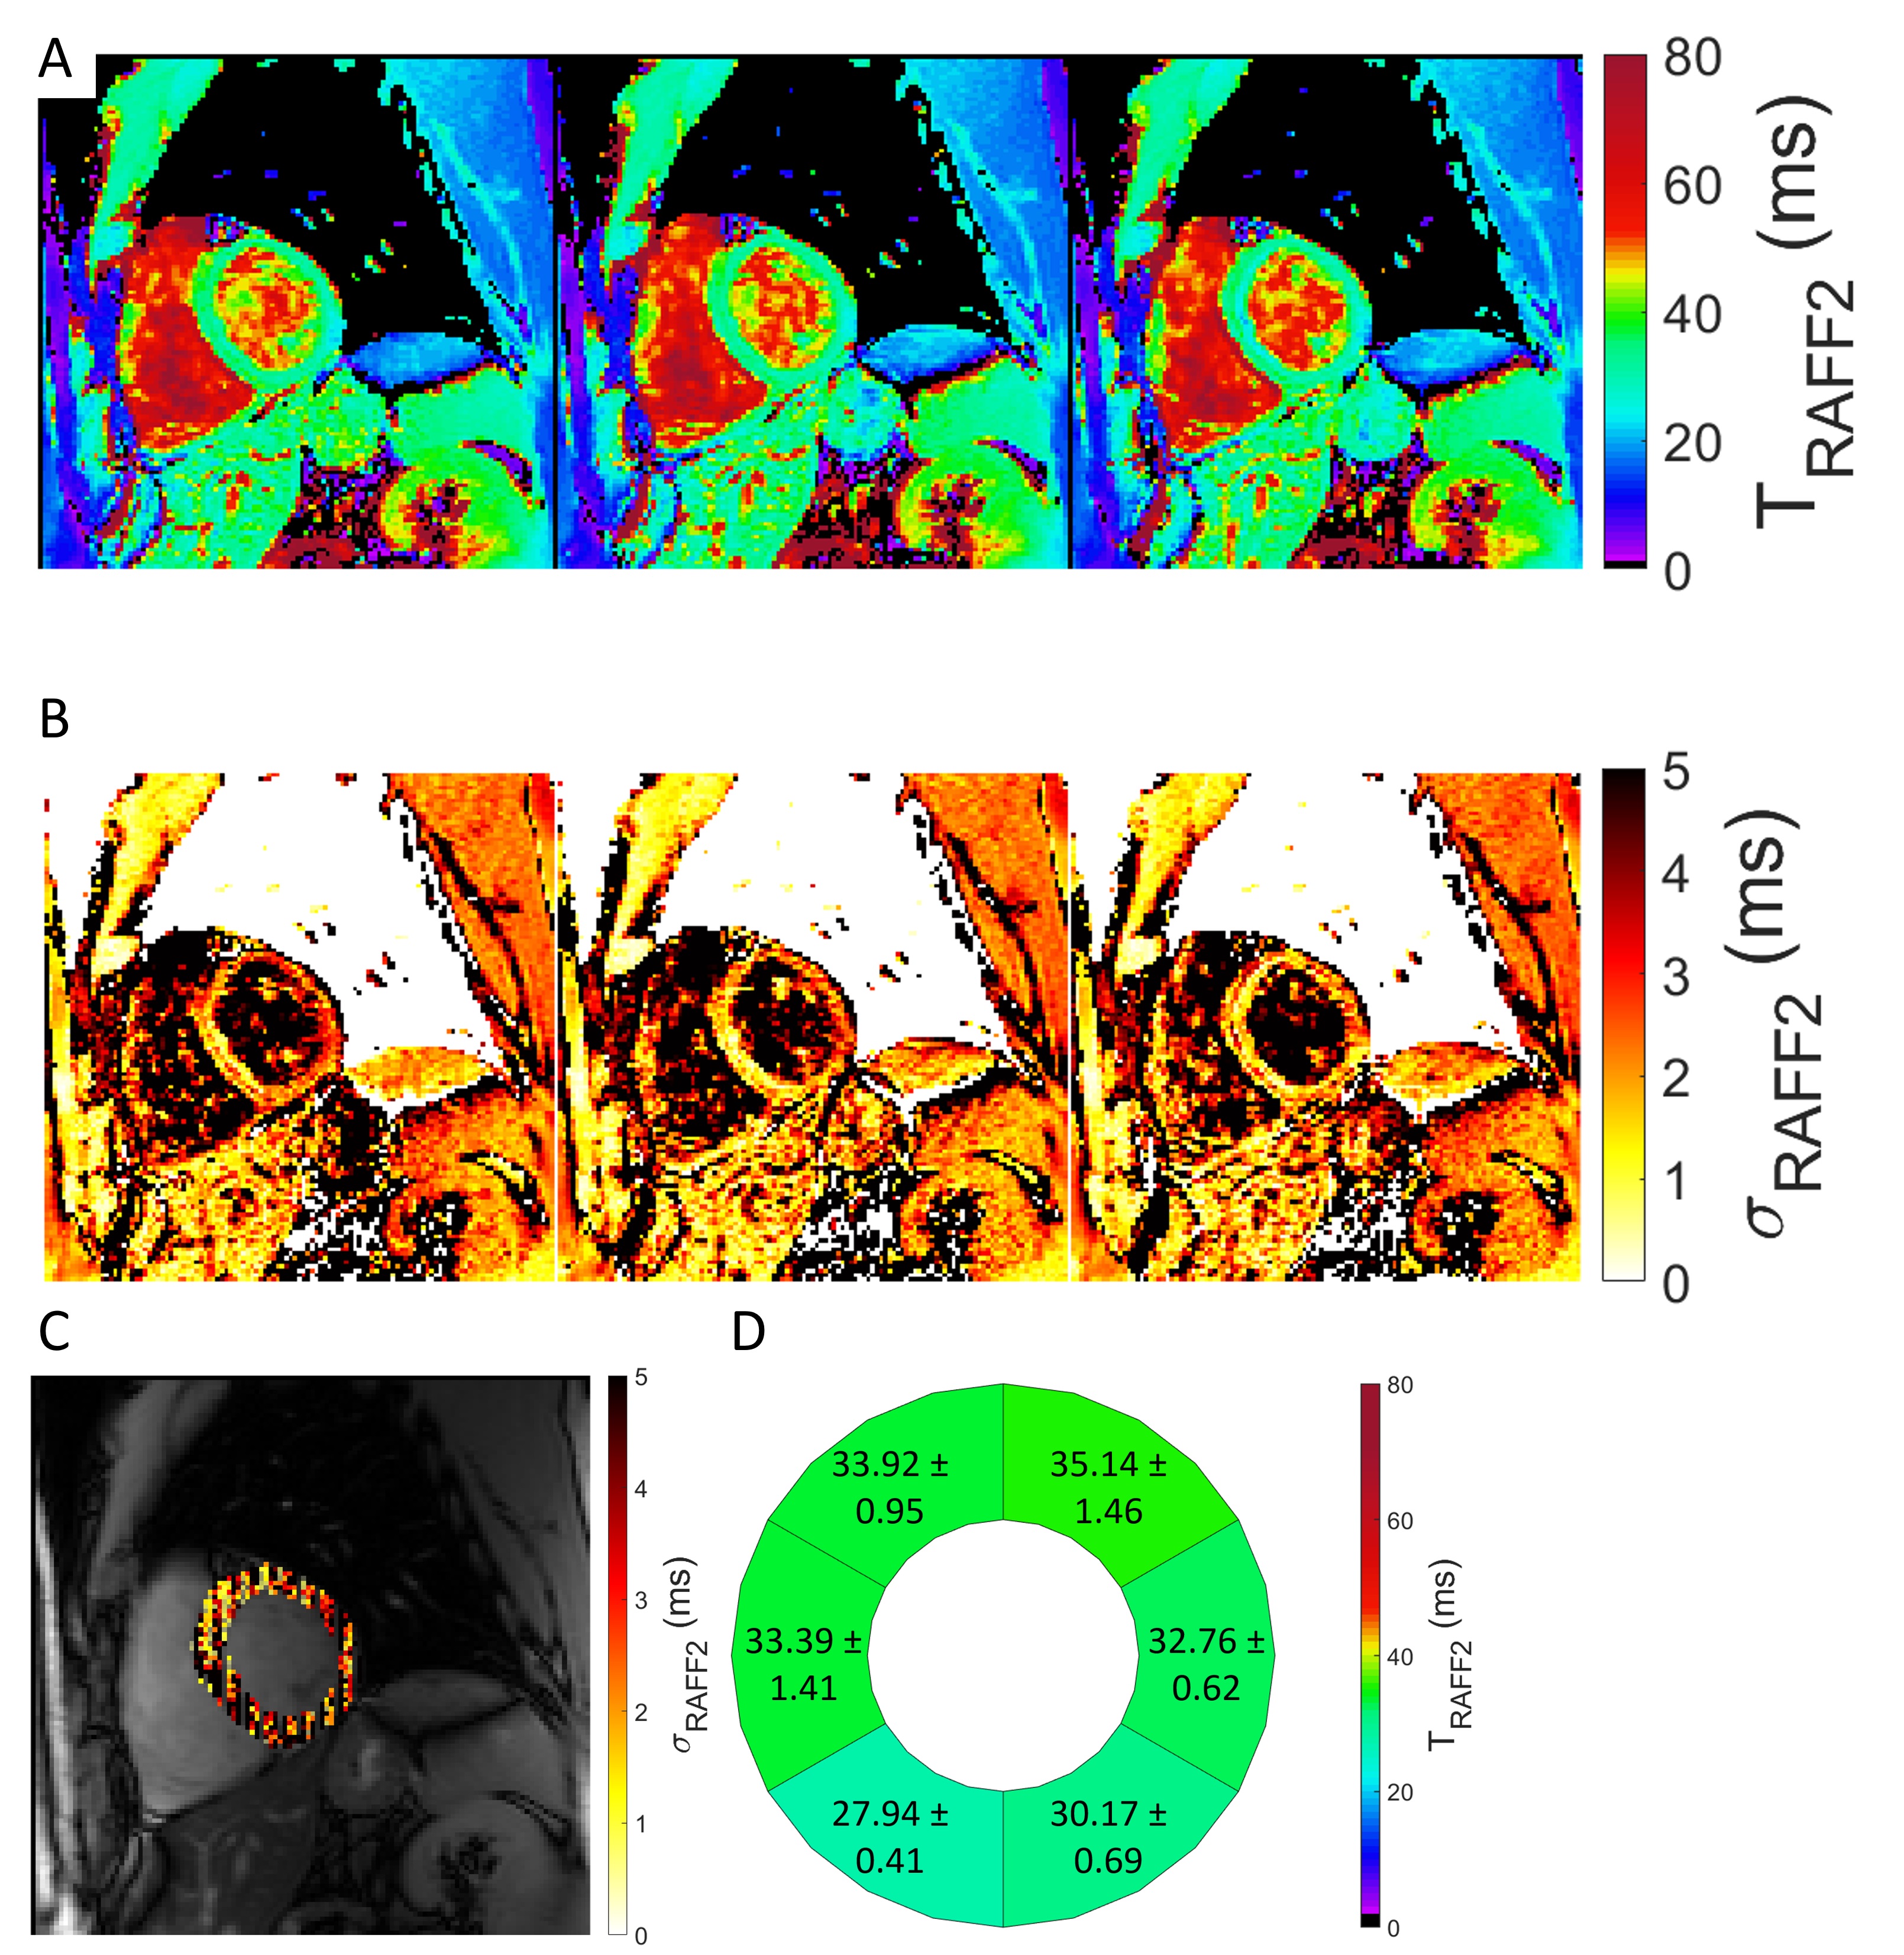
Fig. 5: A-B) TRAFF2 and standard deviation maps (three-parameter fit) from three separate acquisitions indicating high reproducibility. C) Semi-transparent overlay of voxel-wise inter-scan variability across the three acquisitions. D) Bullseye plot for the six mid-ventricular AHA segments. Each segment contains the mean ± SD across the three scans.