0988
Are myocardial MOLLI T1 differences between athletic and non-athletic subjects real or dependent on center differences or MOLLI scheme?1Radiology, UZ Leuven, Leuven, Belgium, 2Imaging and Pathology, KU Leuven, Leuven, Belgium, 3Department of Cardiovascular Sciences, KU Leuven, Leuven, Belgium, 4Department of Electrical Engineering (ESAT), KU Leuven, Leuven, Belgium, 5Medical Imaging Research Center, Medical Physics and Quality Assessment, KU Leuven, Leuven, Belgium, 6Philips Benelux, Eindhoven, Netherlands, 7Exercise Physiology Research Group, KU Leuven, Leuven, Belgium, 8Jessa Hospital, Hasselt, Belgium
Synopsis
We analysed differences in myocardial T1 between non-athletic subjects and athletes (which started endurance training early or late in life) to determine inter-center consistency. In addition, we implemented and extended MOLLI scheme (5s5s1s) to improve precision at very low heart rate typical in athlete's and compared with results from a standard 5s3s MOLLI. Absolute levels were dependent on MOLLI scheme and site, but group differences were very similar as evident from full myocardium T1 histograms.
Introduction
Although inter-center Cardiac MR (CMR) studies have reported no difference in mean myocardial T1 values for healthy subjects1-3, standardization remains an issue. Even when the same T1 mapping sequence is used across centers potential site (or scanner) differences should be evaluated4. In particular when assessing rather subtle differences (or lack of) reported for athletes technical aspects may become more relevant5-10. Furthermore, endurance athletes typically have a low heart rate which may also cause a bias in T14,11. We therefore implemented an extended modified Look-Locker inversion recovery (MOLLI) scheme: 5s(3s)5s(3s)1s. The addition of a third inversion (at longer inversion time TI) should theoretically improve precision (at low heart rate) while still allowing to calculate results from the standard 5s(3s)3s MOLLI scheme from the same scan. We aimed to assess the impact of the extended MOLLI scheme and inter-center data acquisition by evaluating shifts in absolute T1 levels and T1 differences between athletic and non-athletic subjects. To enhance the sensitivity of our analysis we determined the T1 distribution (histogram) of the full myocardium rather than reporting only group T1 averages from typically a septal ROI.Methods
CMR T1 mapping (base and mid short-axis and horizontal long axis views) was performed at two centers as part of the Master@Heart trial which is an ongoing study assessing the beneficial effects of long-term endurance exercise for the prevention of coronary disease (https://www.masteratheart.be/). Subjects were defined in three groups based on the age at which endurance training was initiated: lifelong endurance athletes (‘Early’, site 1: n=14, site 2: n=8), late-onset endurance athletes (after 30 years of age, ‘Late’, site 1: n=15, site 2: n=7) and non-athletic subjects (site 1: n=10, site 2: n=8). Each subject was scanned once at either site 1 or site 2. The scanner type differed between centers (Philips, site 1: 1.5T Ingenia or site 2: 1.5T Achieva). To avoid potentially reduced T1 fit precision resulting from poor sampling of the T1 decay at low heart rates a 5s(3s)5s(3s)1s MOLLI scheme was implemented (3rd inversion TI 580ms). From this scheme the standard 5s(3s)3s MOLLI (TI +/-350ms) result was also calculated by discarding data acquired during the final part (i.e. 2s(3s)1s) before calculating T1. T1 mapping acquisition parameters were: bSSFP readout with TR:2.0ms, TE:0.9ms, flip angle: 35°, slice thickness: 10mm, acquisition matrix: 152x150 reconstructed to 256x256, SENSE factor: 2.T1 maps where calculated offline after motion correction of the T1 weighted images using described methodology (in-house matlab tool12). Motion correction was performed separately for the standard MOLLI data to avoid the possible impact of the longer breathhold required for the extended MOLLI on standard MOLLI results (potentially less stable breathhold near the end). Next, the myocardium was manually contoured (Fiji, NIH, USA) by the same operator using a fixed color code and range (lut royal; 500-1500ms) and avoiding evident artefacts or blood pool pixels. Finally, histograms (Fiji, 5ms bins; 650-1750ms) were pooled across all image planes and subjects within a group. At both centers T1 mapping data was also acquired from the same commercially available phantom (nine tubes, T1: 250ms to 1700ms; 22±2°C; cfr. the T1MES study13).
Results and Discussion
Figure 1 shows the T1 histograms from the extended MOLLI 5s(3s)5s(3s)1s (top row) and standard 5s(3s)3s MOLLI schemes (bottom row) at center 1 (L) and 2 (R). Although a bias in T1 between both centers could be noted (table 1) very similar inter-group shifts between athletic and non-athletic groups were found for both sites. Phantom results showed a similar trend but could only explain part (~15ms) of the global T1 shift (site1: 993 ms, site 2: 1007 ms). The slightly higher absolute T1 values for the extended scheme did not substantially affect group differences. The variability in T1 across the myocardium was significantly lower for the extended MOLLI scheme for both sites (table 2). This is also noticeable by the more narrow pooled histograms for the extended scheme (although less evident due to inter-subject variability). This preliminary data shows that an extended MOLLI scheme is feasible and accurately reports differences in T1 values between athletic and non-athletic groups, as compared to the standard MOLLI scheme albeit with higher absolute values and a narrower distribution. As absolute T1 values in all groups differ between sites, pooling data would add to the variability within groups. The latter could be minimized by keeping all groups balanced in all sites and could be overcome by reporting intergroup difference rather than absolute T1 values.Conclusions
Using a full myocardial tissue T1 histogram representation we could demonstrate that a similar shift in T1 distribution between athletic and non-athletic subjects can be observed in data from both sites and that this shift remains if an extended MOLLI acquisition scheme was used. Thus, we conclude that the healthy myocardium T1 differences between an athletic and a non-athletic population are real. The extended MOLLI scheme did result in a slightly more homogeneous T1 distribution across the myocardium with a small positive bias vs. the standard 5s(3s)3s MOLLI.Acknowledgements
Sofie Tilborghs is supported by a Ph.D fellowship of the Research Foundation Flanders (FWO-11D8518N). The Master@Heart trial is funded by the FWO (FWO-T003717N).
References
- Piechnik SK , Ferreira VM , Lewandowski AJ , et al . Normal variation of magnetic resonance T1 relaxation times in the human population at 1.5 T using ShMOLLI. J Cardiovasc Magn Reson 2013;15:13.doi:10.1186/1532-429X-15-13
- Dabir D, Child N, Kalra A, Rogers T, Gebker R, Jabbour A, Plein S, Yu CY, Otton J, Kidambi A, McDiarmid A, Broadbent D, Higgins DM, Schnackenburg B, Foote L, Cummins C, Nagel E, Puntmann VO. Reference values for healthy human myocardium using a T1 mapping methodology: results from the International T1 Multicenter cardiovascular magnetic resonance study. J Cardiovasc Magn Reson. 2014 Oct 21;16(1):69.
- Hinojar R, Varma N, Child N, Goodman B, Jabbour A, Yu CY, et al. T1 Mapping in Discrimination of Hypertrophic Phenotypes: Hypertensive Heart Disease and Hypertrophic Cardiomyopathy: Findings From the International T1 Multicenter Cardiovascular Magnetic Resonance Study. Circ Cardiovasc Imaging. 2015 8(12):10.1161/CIRCIMAGING.115.003285.
- Messroghli DR, Moon JC, Ferreira VM, et al. Clinical recommendations for cardiovascular magnetic resonance mapping of T1, T2, T2* and extracellular volume: A consensus statement by the Society for Cardiovascular Magnetic Resonance (SCMR) endorsed by the European Association for Cardiovascular Imaging (EACVI). J Cardiovasc Magn Reson. 2017;19(1):75.
- Tahir E, Starekova J, Muellerleile K, von Stritzky A, Münch J, Avanesov M, Weinrich JM, Stehning C, Bohnen S, Radunski UK, Freiwald E, Blankenberg S, Adam G, Pressler A, Patten M, Lund GK. Myocardial Fibrosis in Competitive Triathletes Detected by Contrast-Enhanced CMR Correlates With Exercise-Induced Hypertension and Competition History. JACC Cardiovasc Imaging. 2018 Sep;11(9):1260-1270.
- Görmeli CA, Görmeli G, Yağmur J, Özdemir ZM, Kahraman AS, Çolak C, Özdemir R. Assessment of myocardial changes in athletes with native T1 mapping and cardiac functional evaluation using 3 T MRI. Int J Cardiovasc Imaging. 2016 Jun;32(6):975-81.
- McDiarmid AK, Swoboda PP, Erhayiem B, Lancaster RE, Lyall GK, Broadbent DA, Dobson LE, Musa TA, Ripley DP, Garg P, Greenwood JP, Ferguson C, Plein S. Athletic Cardiac Adaptation in Males Is a Consequence of Elevated Myocyte Mass. Circ Cardiovasc Imaging. 2016 Apr;9(4):e003579.
- Banks L, Altaha MA, Yan AT, Dorian P, Konieczny K, Deva DP, LA Gerche A, Akhavein F, Bentley RF, Connelly KA, Goodman JM. Left Ventricular Fibrosis in Middle-Age Athletes and Physically Active Adults. Med Sci Sports Exerc. 2020 Dec;52(12):2500-2507.
- Pujadas S, Doñate M, Li CH, Merchan S, Cabanillas A, Alomar X, Pons-Llado G, Serra-Grima R, Carreras F. Myocardial remodelling and tissue characterisation by cardiovascular magnetic resonance (CMR) in endurance athletes. BMJ Open Sport Exerc Med. 2018 Oct 25;4(1):e000422.
- Mordi I, Carrick D, Bezerra H, Tzemos N. T1 and T2 mapping for early diagnosis of dilated non-ischaemic cardiomyopathy in middle-aged patients and differentiation from normal physiological adaptation. Eur Heart J Cardiovasc Imaging. 2016 Jul;17(7):797-803.
- Kellman
P, Hansen MS. T1-mapping in the heart: accuracy and precision. J Cardiovasc Magn Reson.
2014;16:2
- Tilborghs S, Dresselaers T, Claus P, et al. Robust motion correction for cardiac T1 and ECV mapping using a T1 relaxation model approach, MedIA, 2019
- Captur G, Gatehouse P, Keenan KE, et al. A medical device-grade T1 and ECV phantom for global T1 mapping quality assurance-the T1 Mapping and ECV Standardization in cardiovascular magnetic resonance (T1MES) program. J Cardiovasc Magn Reson. 2016;18(1):58
Figures
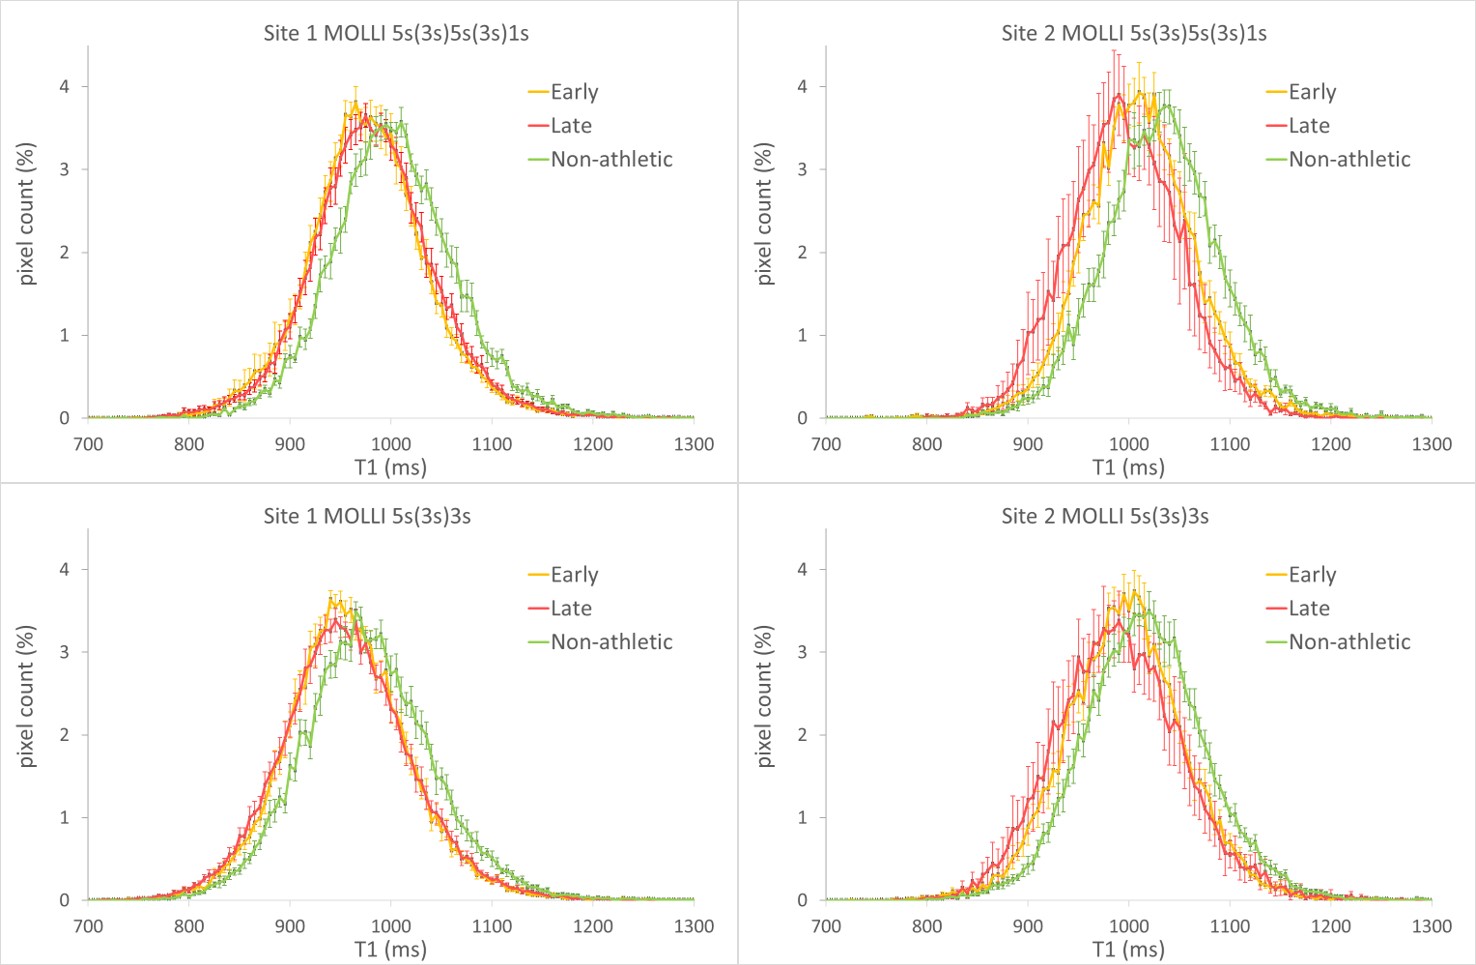
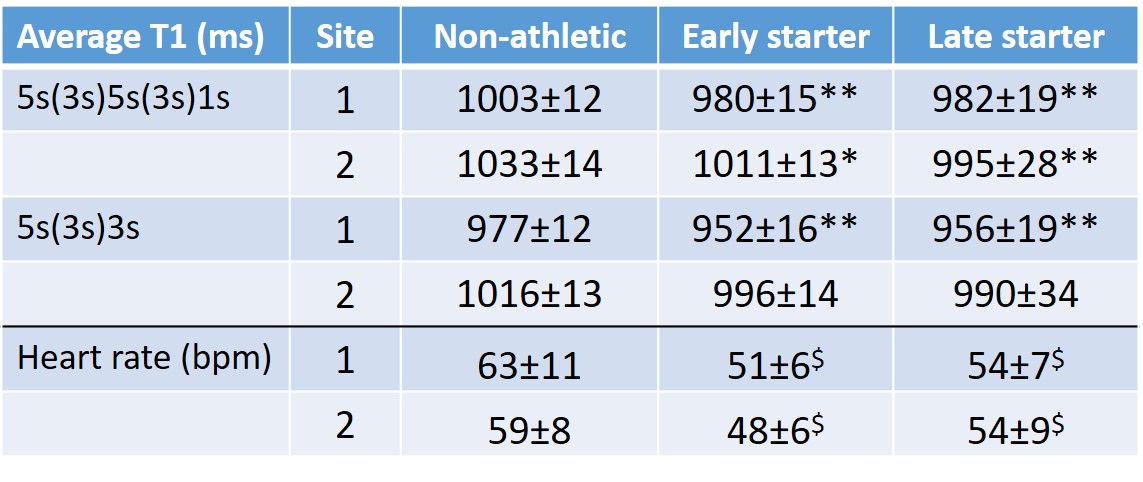
Table 1: Average T1 (ms) for the three groups (non-athletic, early or late starter in life with endurance training) based on subjects from either center 1 or 2 and derived from the extended MOLLI scheme 5s(3s)5s(3s)1s or the standard MOLLI 5s(3s)3s. Heart rate during T1 mapping data acquisition. (*:p<0.05, ** p<0.01 vs non-athletic; $:p<0.001 vs. non-atheltic)
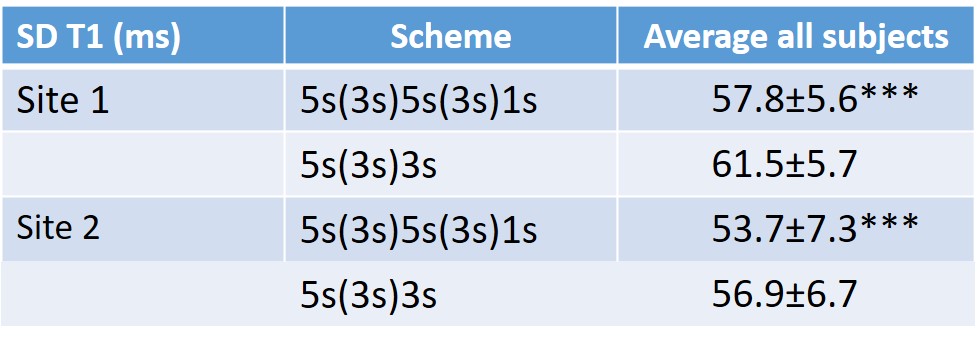
Table 2: Average variability in T1 (ms) across the full myocardium based on either the 5s(3s)5s(3s)1s or 5s(3s)3s MOLLI scheme. The average SD across the myocardium is significantly lower (for both sites) for the extended scheme reflecting the improved precision albeit that a considerable variability remains across the myocardium. (*** = p< 0.001; paired t-test)