0984
Towards Clinical Application of the T2* quantification in the 7T Cardiac MRI: Reproducibility Study in Healthy Volunteers.1Chair of Molecular and Cellular Imaging, University Hospital Würzburg, Comprehensive Heart Failure Center, Wuerzburg, Germany, 2Department of Internal Medicine I, Cardiology, University Hospital Würzburg, Wuerzburg, Germany
Synopsis
7T cardiac MRI is an emerging technique with the potential to increase the spatial resolution and functional informativity of the cardiac images. T2*-quantification becomes a more sensitive MRI method at 7T compared to the lower B0-fields and may provide valuable information on cardiac tissue remodeling. However, in practice, the value of T2* at 7T as a marker of tissue alterations can be diminished by the suboptimal B0-shimming and problems of acquisition and analysis. We present the results of the reproducibility and quality assurance study with 10 healthy volunteers for the optimization of T2*-measurement protocol for a future clinical application.
Introduction
7T cardiac MRI (CMR) is an emerging methodology with the potential to increase the spatial resolution and functional informativity of the cardiac images. In particular, at 7T a T2*-quantification becomes essentially more sensitive compared to clinical B0-fields (1.5/3T) and may provide valuable information on cardiac tissue structure remodeling both in acute and chronic cases. However, in practice, at 7T the value of T2* as a marker of tissue alterations can be diminished by the suboptimal B0-shimming and problems of acquisition and analysis. The regions suffered from B0-inhomogeneity may show a significant variation in T2*-maps reconstructed on pixel-basis even when data were acquired from the same subject in different breath-holds. Elaborating the robust methodology of acquisition and analysis being able to ensure reproducible T2*-values and to correct for B0-shimming imperfections is a prerequisite of using T2*-contrast-based techniques in clinical routine 7T cMRI. In this study, we present results of the reproducibility and quality assurance study with healthy volunteers for the optimization of T2*-measurement protocol for a future clinical application.Materials and Methods
All measurements have been done with the approval of the Local Ethics Committee using Magnetom™ “Terra” 7T MR-scanner (Siemens Healthineers, Erlangen) 8Tx/16Rx cardiac array with the B1+-shim-presets adjusted to the subjects cohorts was used [1]. T2*-measurements were performed using cardiac triggered mGRE with 9 TE-times distributed in the range [1.1..14.6]ms. Image matrix was 256x205 at FOV=300x300mm. B0-shimming was performed using the integrated system including coils up to III-d order [2]. The shimming adjustment volume covering the whole heart was used. Repetitive T2*-scans (5 to 7) were performed with each of the 10 healthy volunteers (m/f) with varying parallel imaging acceleration factor (R=2,3), triggering methods (acoustic system and ECG), and trigger delay. Magnitude images were used for T2* quantification and phase images for the B0-map reconstruction. Segmenting of the left ventricle was performed by an experienced MR-cardiologists. Comparison of the reproducibility of T2*-curves fitting was done for two evaluation methods: pixel-based and ROI-based. Coefficient of determination and confidence bounds were used to evaluate the goodness of T2*-curves fitting. Phase unwrapping and reconstruction of B0-maps were done using ROMEO algorithm [3]. One of the examples of the volunteer's scans which revealed the strong influence of B0-inhomogeneity on T2* in the posterior wall area was chosen for demonstration in this work.Results
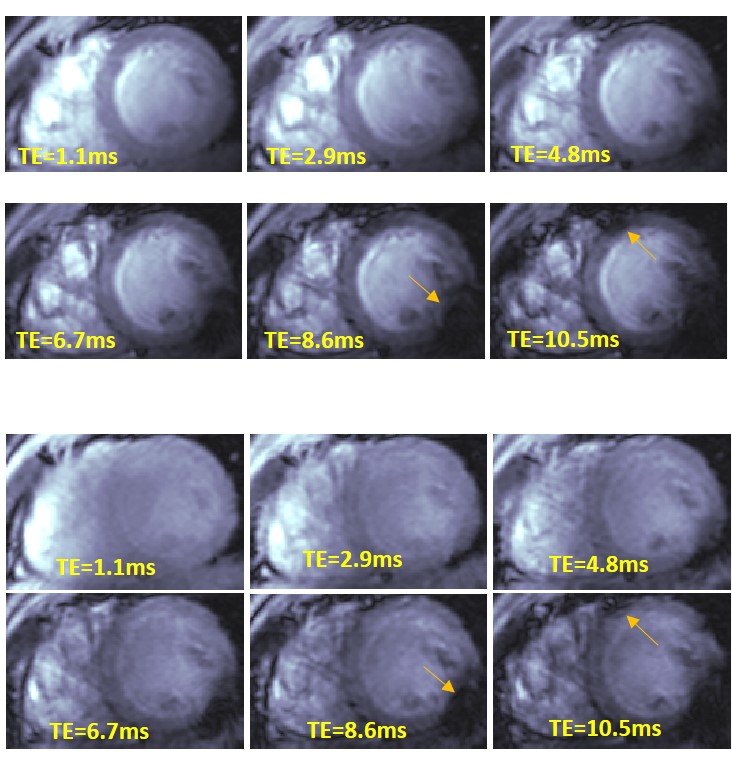
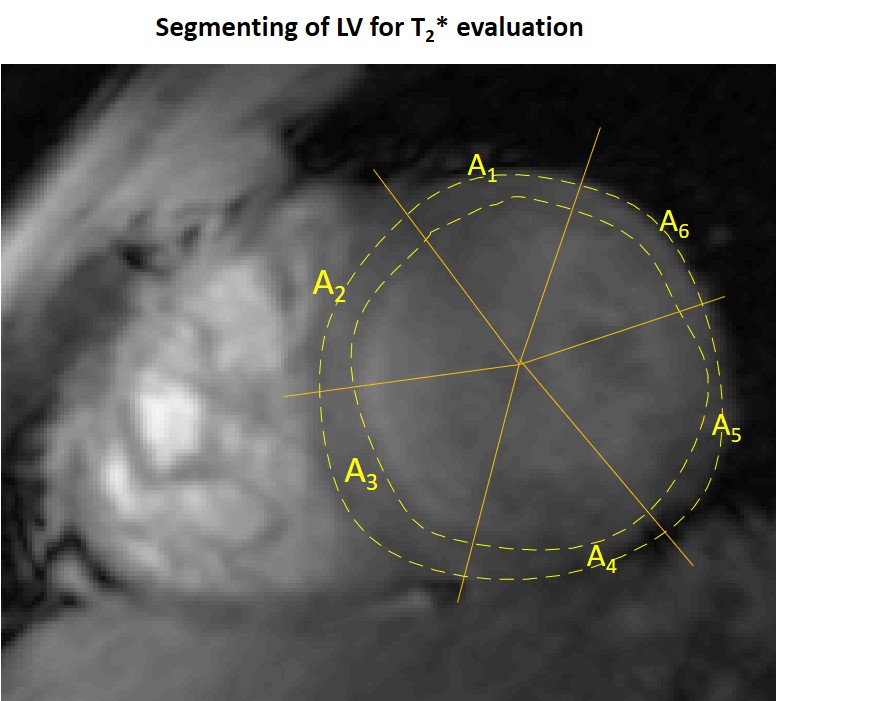
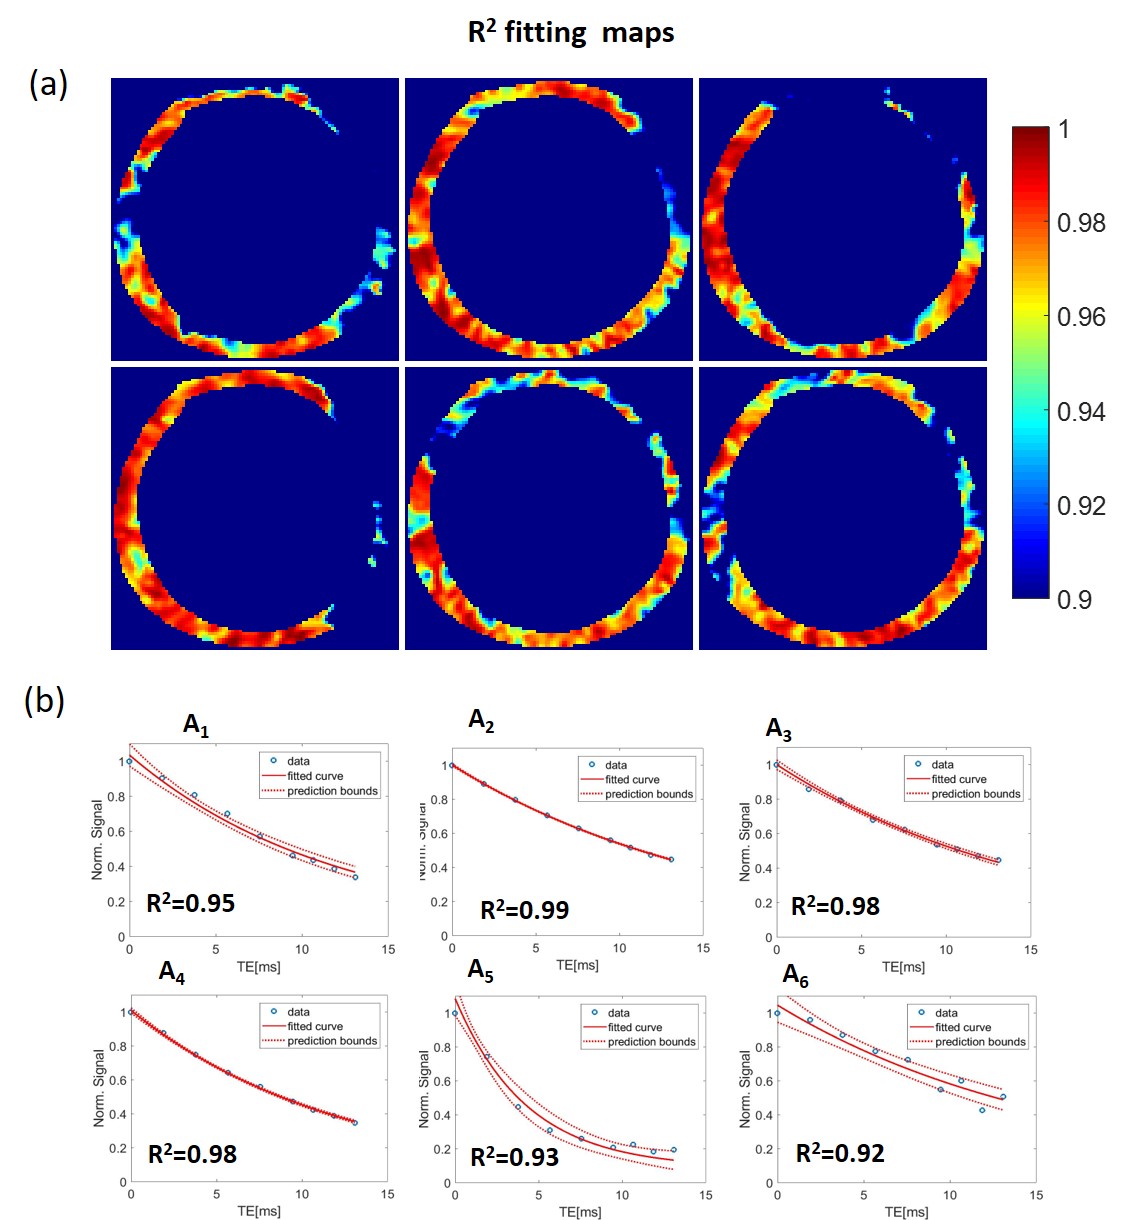
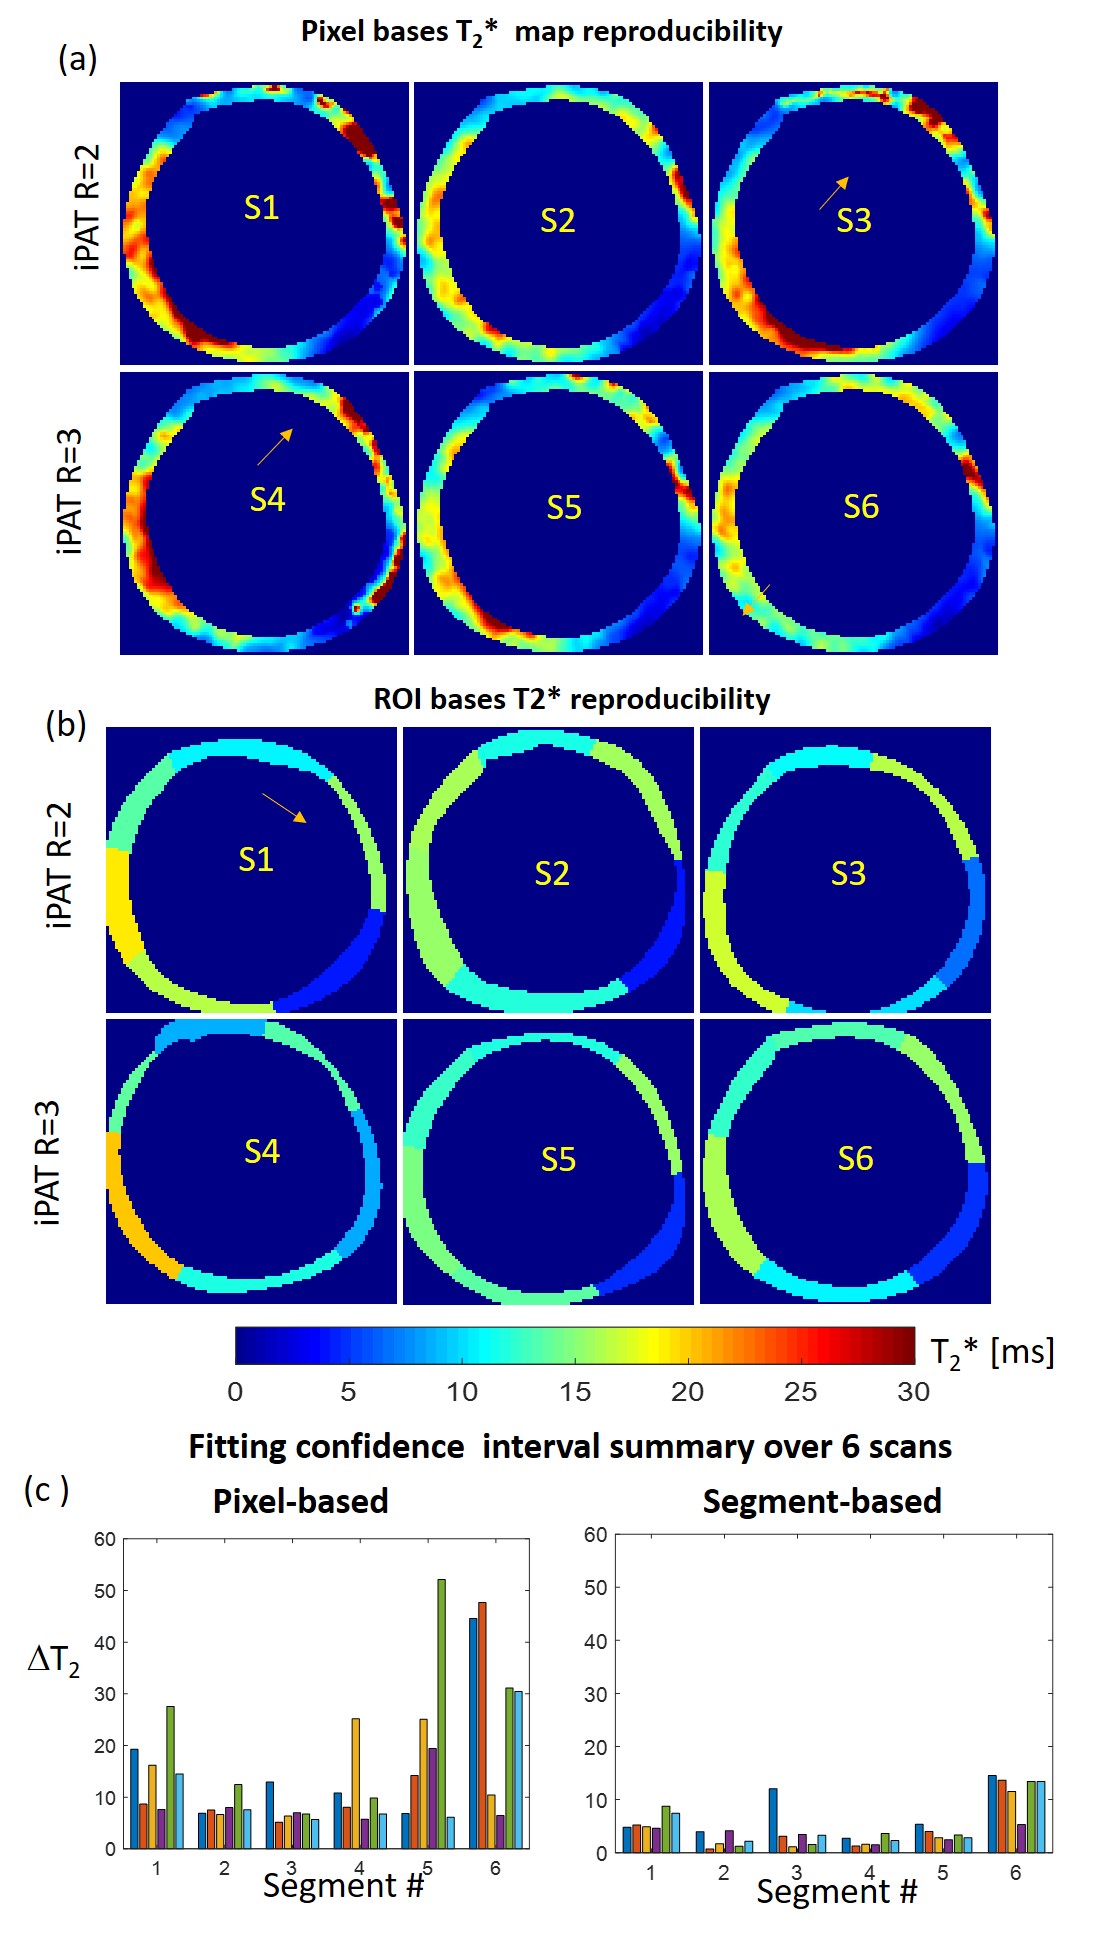
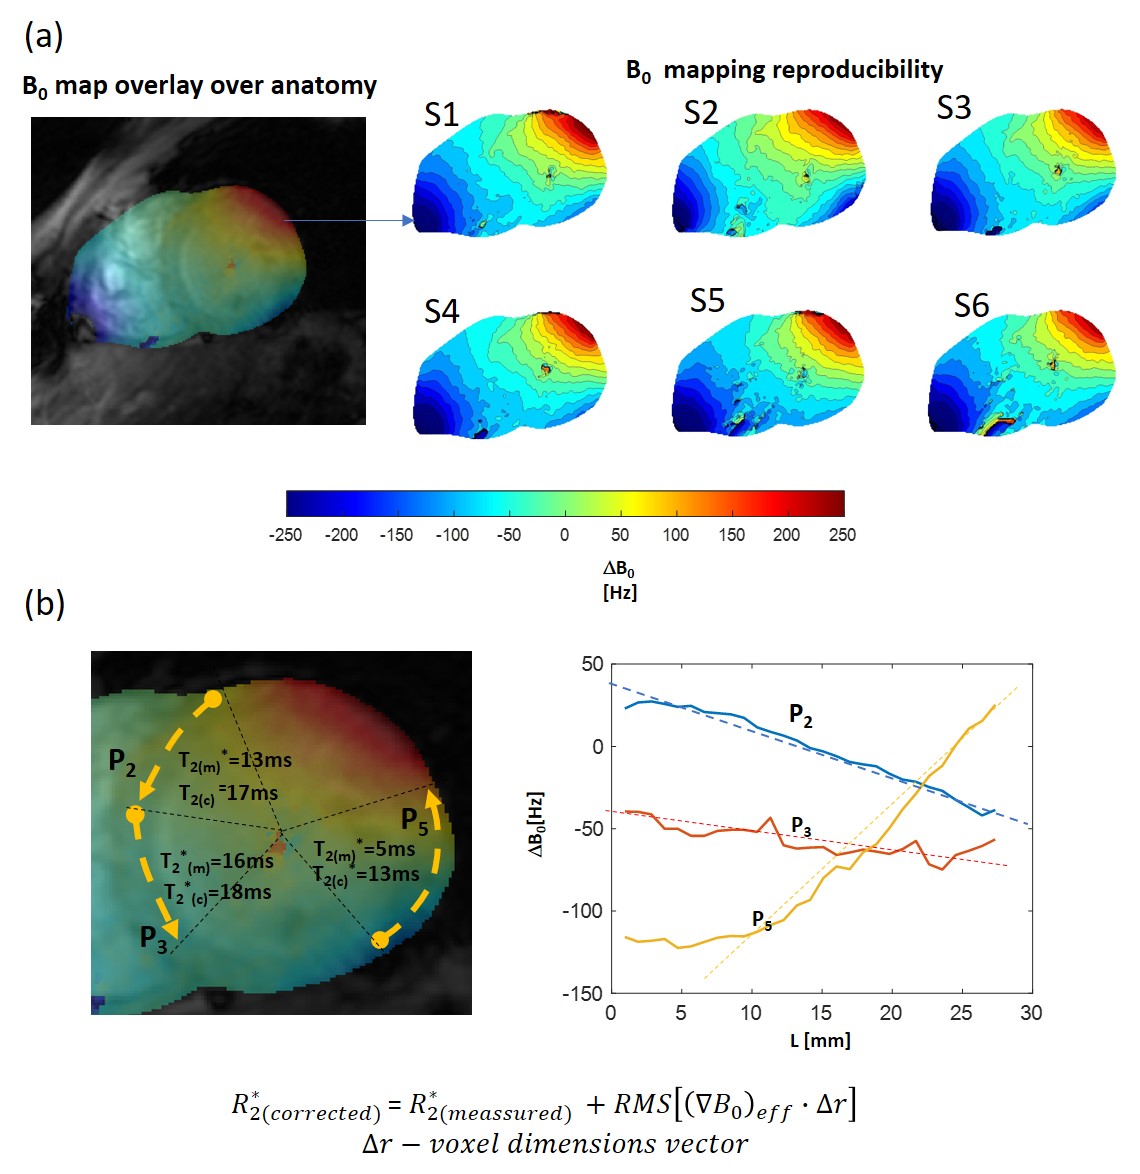
Figure 1 shows frames of two echo trains acquired in subsequent scans and used for T2*-analysis. Local B0-inhomogeneities can lead to artifacts in pixel-based T2*-maps varied from scan to scan for the same subject. Figure 2 shows an example of a segmentation of the LV-myocardium used for the validation of T2*-analysis reproducibility. Allocation of segments A1-A6 was performed according to AHA-scheme. Figure 3 shows an example of „goodness-of-fit“ analysis for pixel and ROI-based fitting of T2*-curves. The maps of the pixel-based coefficient of determination (R2) show areas with R2<0.9 values in up to 40% of all pixels. Segment-based analysis ensures R2>0.9 even for a fitting of drastically shortened and presumably non-mono-exponential T2*-curves in the areas with strongly inhomogeneous B0. Figure 4 (a,b) shows T2*-maps done on pixel- and segment-basis for the six repetitive scans of the same volunteer. Examples of susceptibility artifacts strongly influencing T2* values in pixel maps and leading to data misinterpretation are labeled. Panel (c) summarizes the confidence bounds for T2* in each segment determined over 6 scans. Figure 5(a) shows the reproducibility of the B0-map reconstruction from the unwrapped phase maps acquired during T2* measurements scans. Panel (b) demonstrates the gradient of B0 in the myocardium segments contributing additively to the measured relaxation rate (R2*=1/T2*) and significantly changing in the posterior wall compared to the typical T2* of healthy tissue (15-20ms) measured in the septum region.Discussion
The reproducibility analysis shows that in typical conditions of 7T CMR in terms of B0 and B1-heterogeneities the pixel-based T2*-curve fitting procedure may produce both small and large scale artifacts not related to tissue property, thus, misleading the data interpretation. The segment-based fitting provides essentially more reproducible confidence bounds of T2* values compared to the confidence bounds for the same segments averaged from pixel-based maps. The analysis confirms that inhomogeneous B0 conditions of the 7T CMR may essentially influence the reliability of T2* as the marker of myocardial tissue malformations. The significant susceptibility-induced B0-gradients still persists in the myocardium after the shimming performed using adjustment volume allocated to cover the whole heart. The effective B0 gradient computed from 2D B0–maps allows to explain a significant part of the increased relaxation rate (R2*) due to B0-heterogeneity (even for an extreme reduction of T2* in the posterior/lateral wall segments as in the shown data). The refinement introduced by the T2* values correction procedure should be based on the 3D B0 -maps data to take into account the gradient of B0 in the direction transversal to the slice plane. This will be provided by acquiring a 3D contiguous stack of T2*-data with individually set B0-shimming volume for each slice.Conclusion
The acquired experience of measurements and preliminary analysis of the volunteer's data allows for a comprehensive approach towards T2* measurements in patients to assess alterations of the myocardial microstructure.Acknowledgements
Financial support: German Ministry of Education and Research (BMBF, grants: 01EO1004, 01E1O1504).References
[1]Terekhov, M, Elabyad, I, Kögler, C, et al. „Customized B1+-Shaping using multi-Channel transceiver array prototype for 7 T cardiac MRI with central elements symmetry“. Proc 28th Intl. Soc. Mag. Reson. Med. (Virtual meeting, 2020)
[2] Hock, M, Terekhov, M, Stefanescu, MR, et al. B0 shimming of the human heart at 7T. Magn Reson Med. 2020; 85: 182– 196. https://doi.org/10.1002/mrm.28423
[3] Dymerska, B, Eckstein, K, Bachrata, B, et al. Phase unwrapping with a rapid opensource minimum spanning tree algorithm. Magn Reson. Med. 2020; 00: 1– 15. doi: 10.1002/mrm.28563
Figures