0981
Cardiovascular magnetic resonance T1ρ endogenous contrast can detect early myocardial fibrosis in hypertrophic cardiomyopathy1MRI, 1st Affiliated Hospital of Zhengzhou University, Zhengzhou, China, 21st Affiliated Hospital of Zhengzhou University, Zhengzhou, China, 3Icahn School of Medicine at Mount Sinai, New York, NY, United States, 4Mallinckrodt Institute of Radiology, Washington University in St, Washington, WA, United States
Synopsis
The study is to determine clinical utility of T1ρ to detect myocardial fibrosis in patients with hypertrophic cardiomyopathy (HCM) at different subtypes. The results showed that absolute T1ρ (ms) increased progressively and significantly from volunteer to HCM-N and then to HCM-H. ECV has the same trend as T1ρ. There was a strong positive correlation between ECV and T1ρ. If selecting T1ρ relaxation times of 36.5ms as the cutoff value for normal myocardial fibrosis, the sensitivity, specificity and AUC to detect myocardial fibrosis were 83.7%, 91.3%, and 0.937, respectively.T1ρ is able to detect early diffuse fibrosis in HCM and two subtypes.
Purpose
The aim of the current study is to determine clinical utility of T1ρ-mapping to detect myocardial fibrosis in patients with hypertrophic cardiomyopathy (HCM) at different subtypes.Methods
We prospectively recruited 32 adult patients with HCM and 8 volunteers. HCM patients were then divided into HCM with normal myocardial thickness (HCM-N) and HCM with hypertrophy myocardium (HCM-H) subgroups. All subjects were scanned at a 3T Skyra system (Siemens Healthcare, Erlangen, Germany). All the patients and volunteers underwent 2D cine and T1ρ-mapping at 298 Hz with three times of spin-locking (30, 44, and 54 ms). This T1ρ sequence was designed specifically for imaging at 3T to minimize local field inhomogeneity. Each slice of T1ρ-mapping imaging can be obtained with one breath-holding (~ 6 sec). In addition, all patients underwent pre-contrast and post-contrast T1-mapping imaging after the administration of 0.1 mmol/kg gadolinium contrast agent for the evaluation of extracellular volume (ECV). Four patients had septal myectomy to confirm myocardial fibrosis. CMR42 (Circle Cardiovascular Imaging, Calgary, Alberta, Canada) was used to obtain global longitudinal strain (GLS) and ECV. T1ρ-mapping were processed in a customer-made software.Results
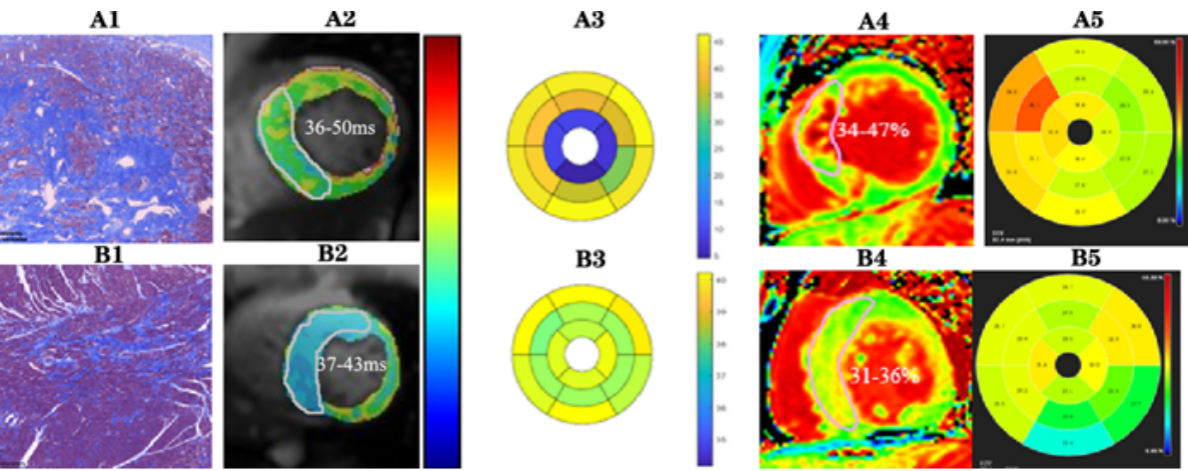
The Table shows MRI results. GLS decreased progressively from volunteers to HCM-N and then to HCM-H (-12.8±3.9% vs. -11.4±6.2% vs. -9±4.2%, P < 0.001). The absolute T1ρ (ms) increased progressively and significantly from volunteer to HCM-N and then to HCM-H (38.1±4.5 vs. 39.6±5.2 vs. 41.1±5.5, P = 0.001) (Figure 1). Statistical post-hoc tests revealed the significant differences between control and HCM-N (P = 0.008) and between HCM-N and HCM-H (P = 0.009)). ECV values in HCM-N were significantly lower than those of HCM-H (32.9±5.2% vs. 34.5±5.9%, P=0.005). There was a strong positive correlation between ECV and T1ρ (r = 0.74). If selecting ECV value of 25.9% as the cutoff value for normal myocardial fibrosis, the sensitivity, specificity and AUC of T1ρ relaxation times to detect myocardial fibrosis (36.5ms as the cutoff value) were 83.7%, 91.3%, and 0.937, respectively. Figure 2 shows two examples of patient images with histopathology. However, GLS shows no correlation with ECV(r =0.094) or T1ρ (r =0.096).Conclusion
Our findings indicate that T1ρ has the ability in the detection of early diffuse fibrosis in patients with HCM and two subtypes. This has important clinical implications because it has potential to become an alternative approach to assess myocardial diffuse fibrosis in patients who have severe renal insufficience or in juvenile patients with HCM.Acknowledgements
No acknowledgement found.References
No reference found.Figures
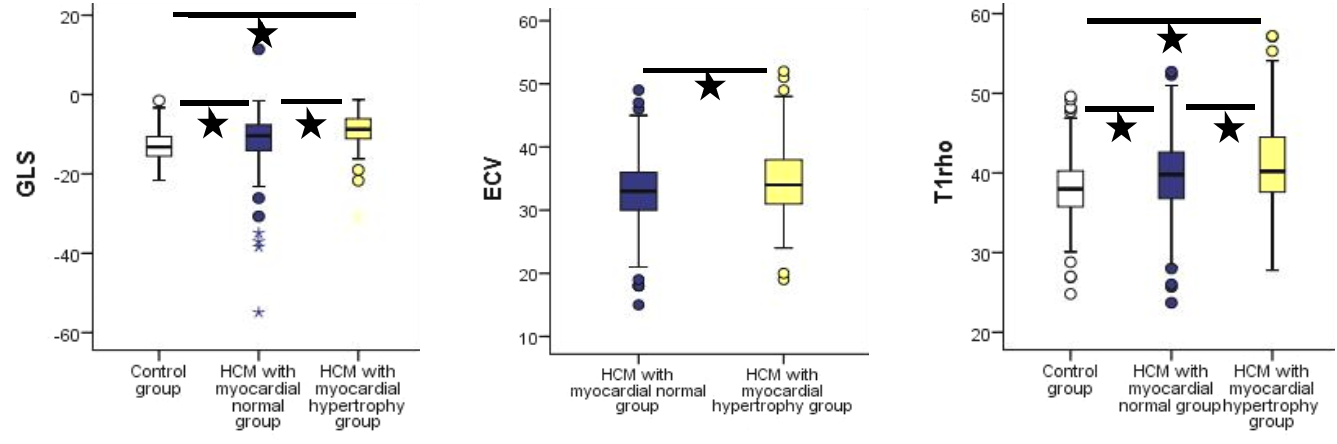
Statistical plots of ECV, T1ρ, and global longitudinal strain in control and hypertrophic cardiomyopathy groups. ✭ P<0.05