0979
Myocardial contractility distinguishes the effect of radiation therapy on different rat models1Medical College of Wisconsin, Milwaukee, WI, United States
Synopsis
Radiation therapy (RT) is used by more than 50% of all cancer patients, where the risk of RT-induced cardiotoxicity reaches 33%. In this study, we investigate the role of cardiac contractility by MRI to differentiate the response of two different rat models to RT. The results showed the value of myocardial strain for early detection of RT-induced cardiotoxicity and exploring the effect of genetic profile and duration post-RT on cardiotoxicity. In conclusion, MRI strain imaging allows for determining spatial distribution and temporal progression of myocardial contractility post-RT, which would allow for determining the effect of genetic profile on cardiotoxicity development.
Introduction
With increased rates of lung cancer survival, cardiovascular toxicity has become a major cause of mortality in lung cancer patients. Radiation therapy (RT) is used by more than 50% of all cancer patients, where the risk of RT-induced cardiotoxicity reaches 33%. Data regarding RT-induced cardiotoxicity in lung cancer is limited due to inherent challenges in addressing the case-by-case variability of incidental cardiac radiation. Also, radiosensitivity is a complex genetic trait, likely resulting from variation in a large number of genes that impact cardiotoxicity on an individualized basis. In this study, we investigate the role of cardiac contractility by MRI to differentiate the response of two different rat models to RT.Methods
To examine cardiotoxicity, adult female rats (15 salt-sensitive (SS) and 14 consomic SS.BN3 (SS rats with chromosome 3 inherited from the Brown Norwayan rats)) received image-guided localized whole-heart RT to 24 Gy using 3 equally-weighted fields. The RT rats were divided into two groups that were imaged at 8 weeks and at 10 weeks post-RT. Sham-treated (non-radiated) rats (7 SS and 6 SS.BN3) were also included in the study. All rats were scanned when they were about the same age on a 9.4T Bruker MRI small-animal scanner using a 4-element surface coil. Both cine and tagged images were acquired in short-axis and long-axis views. The imaging parameters were optimized to maintain decent image quality while minimizing scan time. The cine sequence imaging parameters were: repetition time (TR)=7ms, echo time (TE)=2.1ms, flip angle=15°, matrix=176x176, FOV =40x40 mm2, slice-thickness=1mm, acquisition bandwidth=526Hz/pixel, #averages=2, #cardiac phases=20, and scan time ~2minutes per slice. The tagging sequence imaging parameters were: TR=7ms, TE=2.5 ms, flip angle=15°, matrix=256×256, FOV=40×40mm2, slice-thickness=1mm, acquisition bandwidth=375Hz/pixel, #averages=3, #cardiac phases=20, and scan time ~5minutes per slice. The cine images were analyzed using the cvi42 software to measure EF and myocardial mass. The tagged images were analyzed using the SinMod technique to measure myocardial circumferential (Ecc), radial (Err), and longitudinal (Ell) strains. Statistical t-test was conducted to identify significant measurement differences between different rat groups (P<0.05 considered significant).Results
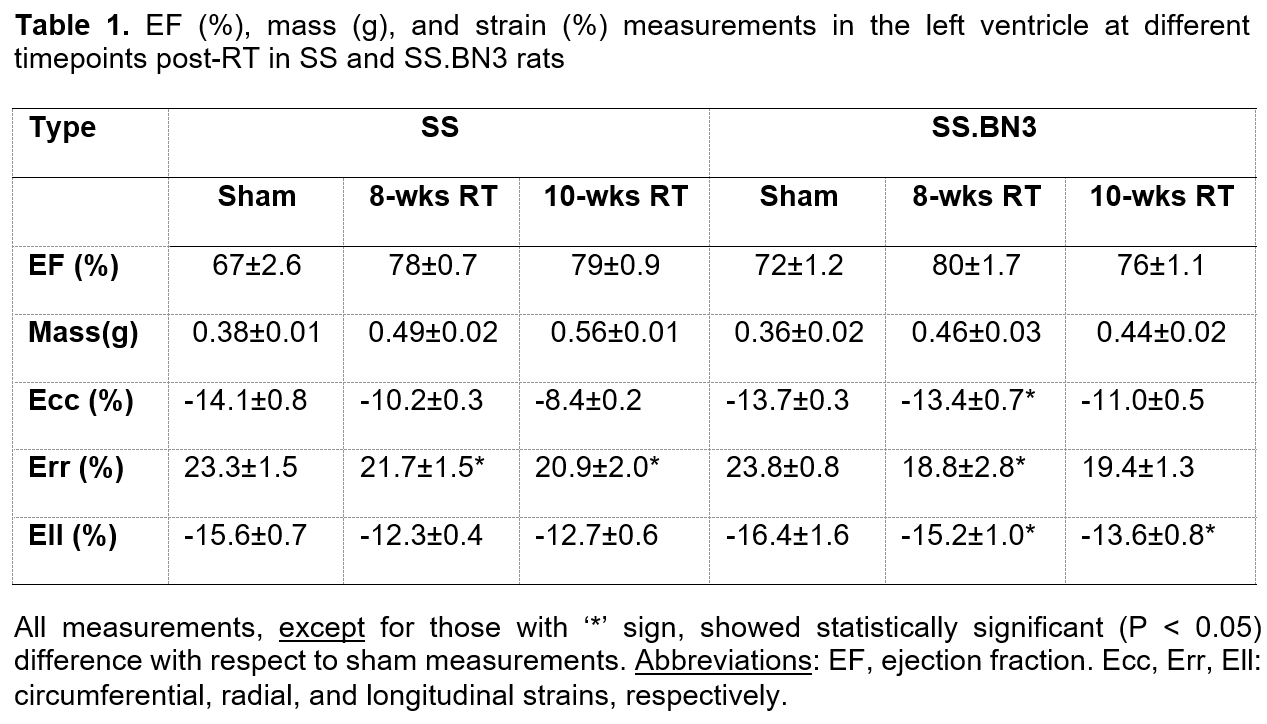
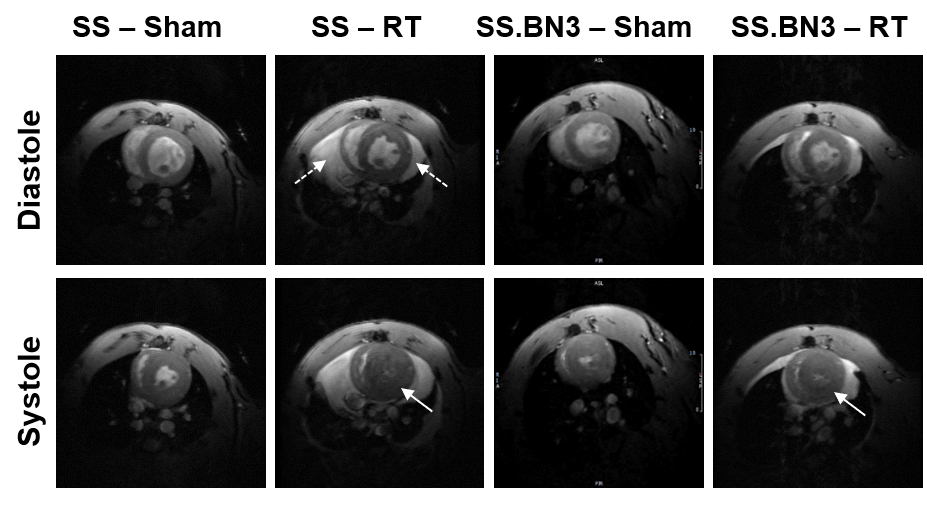
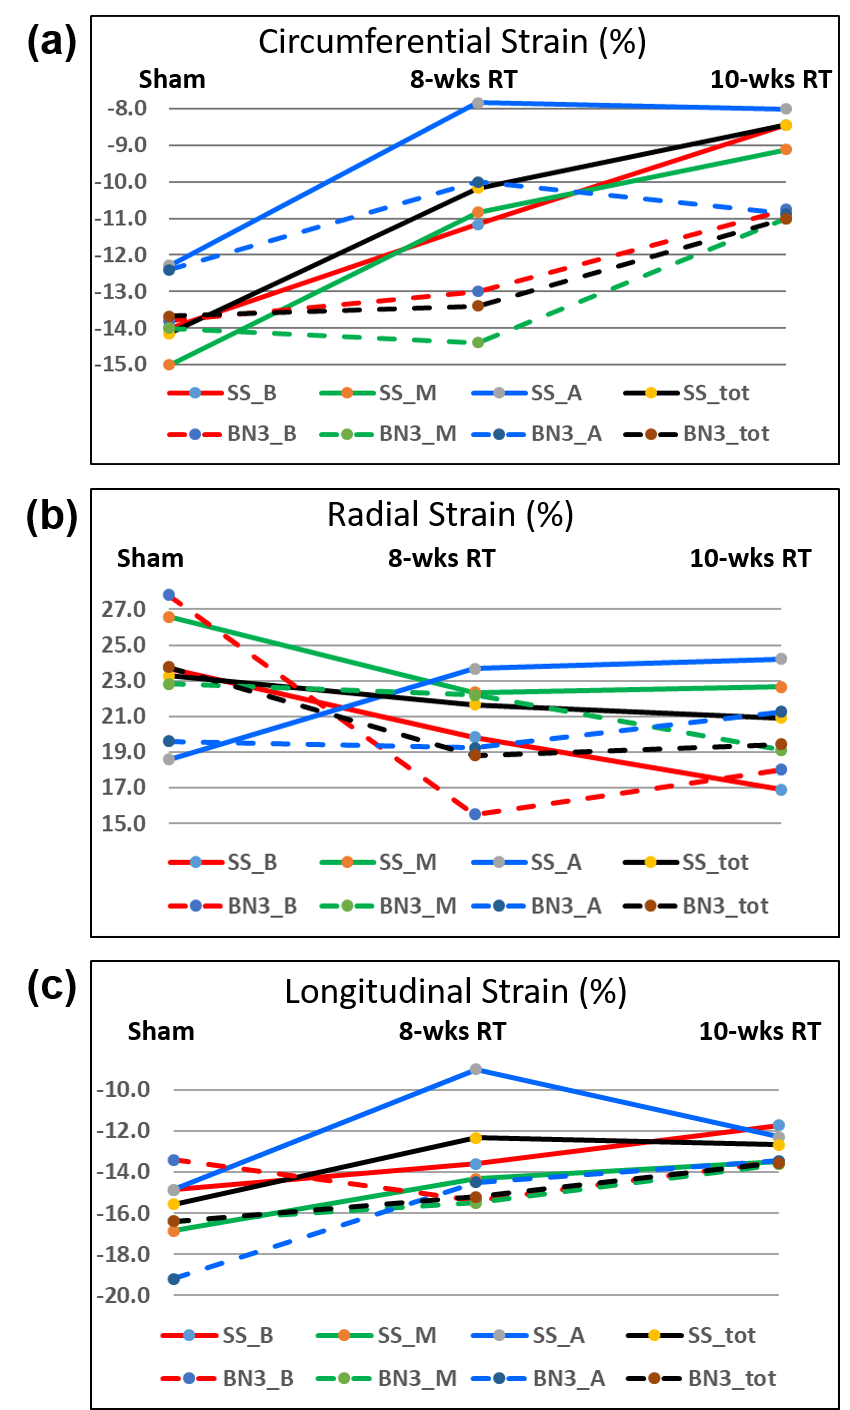
Global cardiac function was normal in all rats, with increased EF and myocardial mass in the RT, especially in the SS rats, compared to sham measurements (Figure 1). Table 1 summarizes measures of global LV cardiac function in the SS and SS.BN3 rats. The results showed significant increase in EF in both rat types at 8-weeks post-RT compared to sham measurements, which was maintained in the SS rats and slightly decreased in the SS.BN3 rats at 10-weeks post-RT. LV myocardium mass significantly increased in both rat types at 8-weeks post-RT, which was maintained in the SS.BN3 rats, while continued to increases in the SS rats at 10-weeks post-RT. Despite normal global function, strain measurements showed reduced (absolute) values in the RT rats compared to sham measurements. Figure 2 shows strain measurements in both rat types at different timepoints. In general, the strain measurements showed larger changes between sham and 8-weeks post-RT rats compared to the changes between 8-weeks and 10-weeks post-RT rats, and Err showed larger range of values, especially at the basal and apical sites, compared to Ecc and Ell ranges of values. SS and SS.BN3 rats showed different patterns of strain changes at different time points and for strain components. On a regional basis, strain changes showed different patterns between basal, mid-ventricular, and apical slices, as illustrated in Figure 2.Discussion and Conclusions
This study illustrates the value of MRI-derived regional cardiac function parameters, especially myocardial strain, for early detection of RT-induced cardiac dysfunction and exploring the effect of genetic profile and duration post-RT on cardiotoxicity. Despite normal EF, the cine images showed ventricular hypertrophy and remodeling in the RT rats (both types), especially at 10-weeks post-RT and in SS rats. Regarding strain measurements, strain values were in general larger in SS compared to SS.BN3 rats, and between sham and 8-weeks post-RT rats compared to changes between 8-weeks and 10-weeks post-RT in both rat types. Both rat types started to show noticeable segmental heterogeneity in all strain measurements at 10-weeks post-RT. Ecc showed clear distinction between cardiac dysfunction development based on genetic profile. While Ecc significantly reduced at 8-weeks post-RT, compared to sham rats, and then kept reducing at 10-weeks post-RT, in SS rats. However, this was not the case in SS.BN3 rats, where Ecc was mostly maintained until 8-weeks post-RT, and then started to reduce afterwards. Err showed reduction, more pronounced in the SS.BN3 than in the SS rats, at 8-weeks post RT, then was maintained in both rat types between 8-weeks and 10-weeks post-RT. On the other hand, Ell showed reduction, this time more pronounced in the SS than in the SS.BN3 rats, at 8-weeks post RT, and then was maintained in both rat types between 8-weeks and 10-weeks post-RT. In conclusion, myocardial strain analysis by MRI allows for determining spatial distribution and temporal progression of the heart contractility pattern in RT-induced cardiotoxicity, which would allow not only for early detection of subclinical cardiac dysfunction but also for determining the effect of genetic profile on cardiotoxicity development.Acknowledgements
Funding from Daniel M. Soref Charitable Trust, MCW, USAReferences
1. Flister et al, Breast Cancer Research Treat, 165:53-64
2. Schlaak et al, J Physiol Heart Circ Physiol, 316:H1267-H80
3. Ibrahim, Heart Mechanics MRI. CRC Press, 2017
4. Said et al, Ann Onc, 25:276-282
Figures