0969
Mapping electric bulk conductivity in the human heart1Philips Research Europe, Hamburg, Germany
Synopsis
In addition to electro-physiological examinations, mapping the passive bulk conductivity would complete a comprehensive characterization of myocardial tissue. The technique to measure this conductivity with MRI, called “Electrical Properties Tomography” (EPT), has been developed some time ago, but not yet explored for the human heart. This study investigated and confirmed two basal goals of cardiac EPT: (a) that cardiac EPT is technically feasible, (b) that quantitative conductivity values of myocardium and blood, obtained from a small group of volunteers, are in line with expectations from literature.
Introduction
In addition to electro-physiological examinations, mapping the passive bulk conductivity would complete a comprehensive characterization of myocardial tissue. The technique to measure this conductivity with MRI, called “Electrical Properties Tomography” (EPT), has been developed some time ago,1 but except an early animal study2 not further explored for the heart. This study investigates cardiac EPT with two goals: (a) to explore the technical feasibility of EPT for the heart, (b) to determine conductivity values of myocardium and blood from a small group of volunteers.Theory
According to Maxwell’s equations, the electric conductivity σ is in first order related to the MR image phase φ byσ=(d²φ/dx²+d²φ/dy²+d²φ/dz²)/(2μ0ω)
with Larmor frequency ω and vacuum permeability μ0. Hence, σ is proportional to the curvature of φ as expressed by the second derivatives. Care has to be taken that φ is only produced by B1 (i.e. RF transmission and reception) and not by B0 inhomogeneities (i.e. off-resonance effects).1 Such a φ can be found in spin-echo based sequences or in field-echo based sequences with balanced gradients (“steady-state free-precession” (SSFP) sequences),3 which typically show a higher SNR efficiency per scan time than spin-echo based sequences. Since the second derivatives in all three spatial directions are required to calculate σ, a 3D MR image is required for standard EPT. If only 2D images are available, e.g. to enable real-time imaging, an estimated conductivity σ’ can be derived using
σ'=(d²φ/dx²+d²φ/dy²)/(2μ0ω)
with x and y as directions defining the available image plane. The assumption σ=1.5σ’ (i.e. all three spatial derivatives contribute equally to σ) is valid for symmetric objects and increasingly violated with increasing asymmetry of the object. The concept of σ’ has been successfully applied to enable EPT for liver4 and lung tumors5 during breath-hold. After reconstruction, a bilateral median filter has been applied to counterbalance the noise enhancing effect of numerical differentiation.1 Both steps, numerical differentiation and denoising, cannot be performed on single voxels but require a certain area (“kernel”) around the respective target voxel. Since reconstruction reliability increases with size of this kernel, the investigation of not too small tissue compartments is recommended for EPT.
Methods
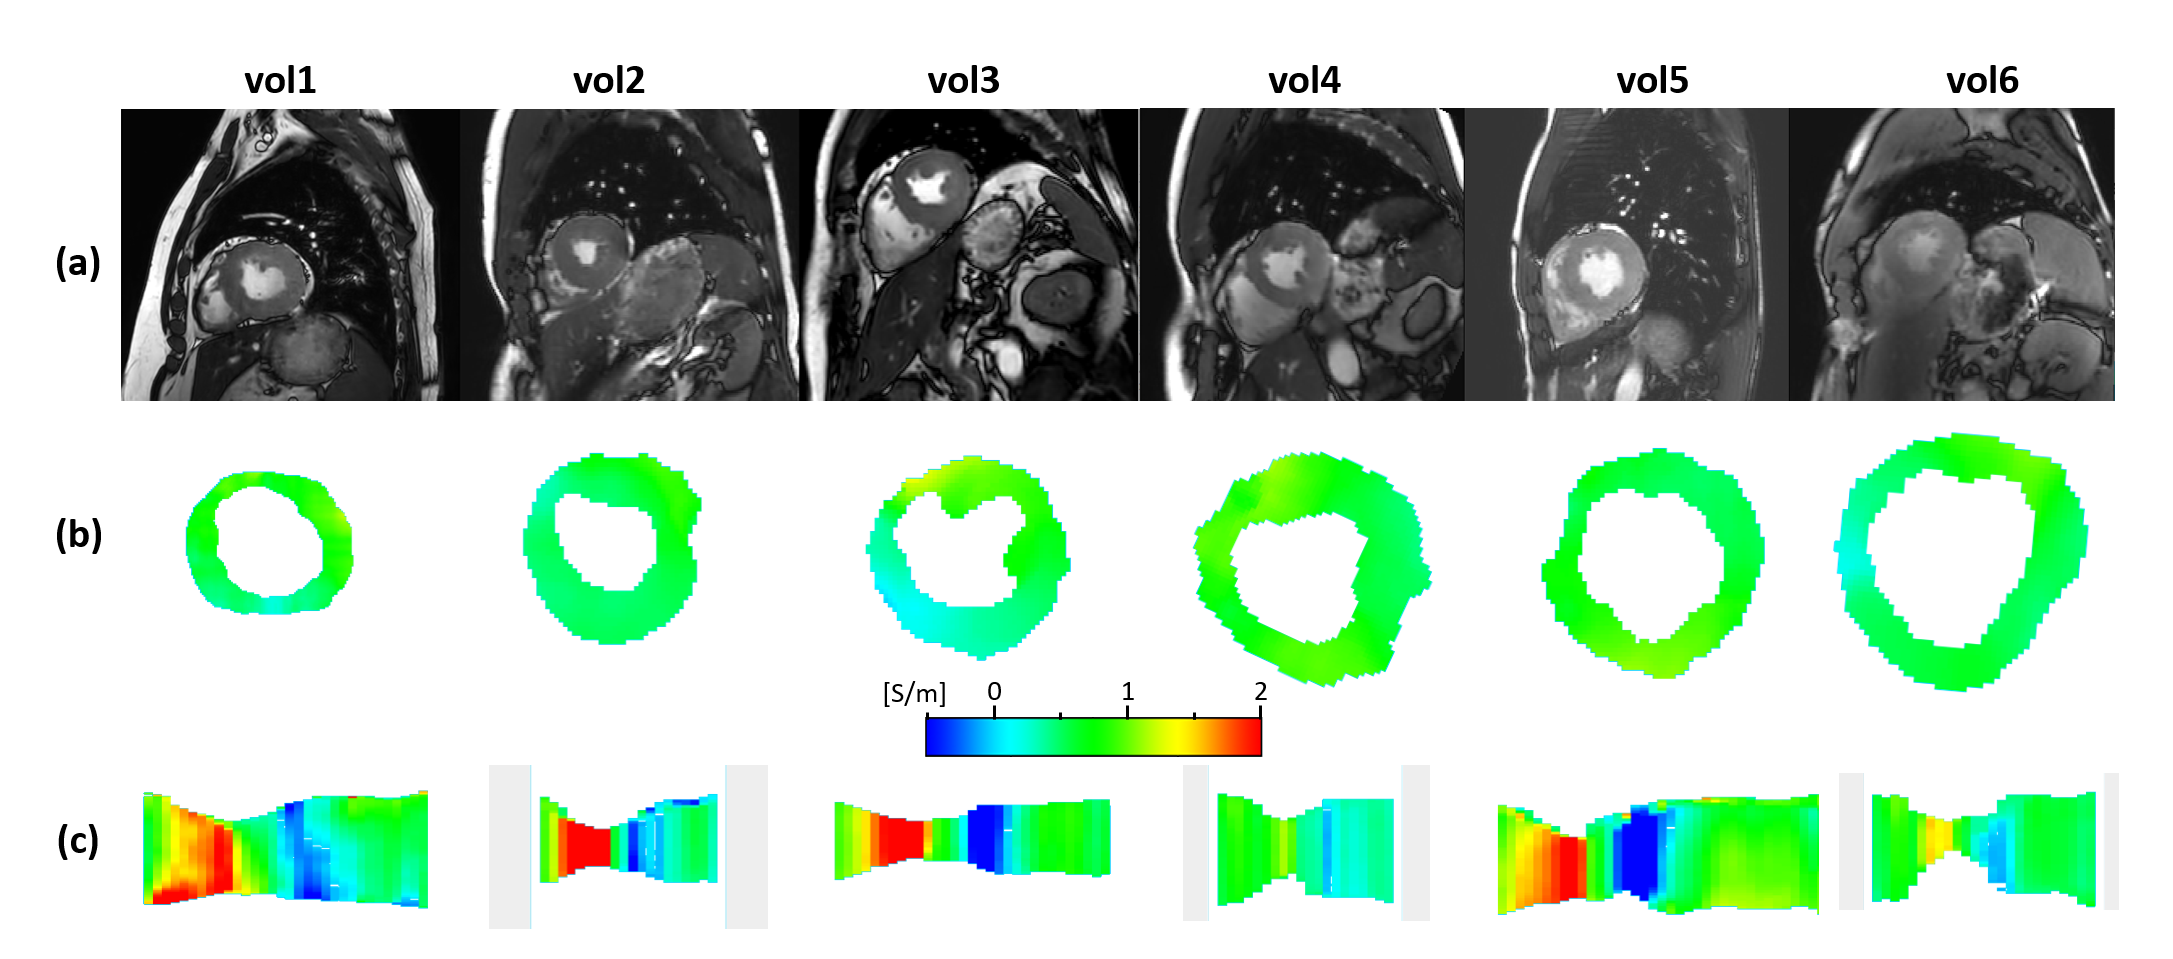
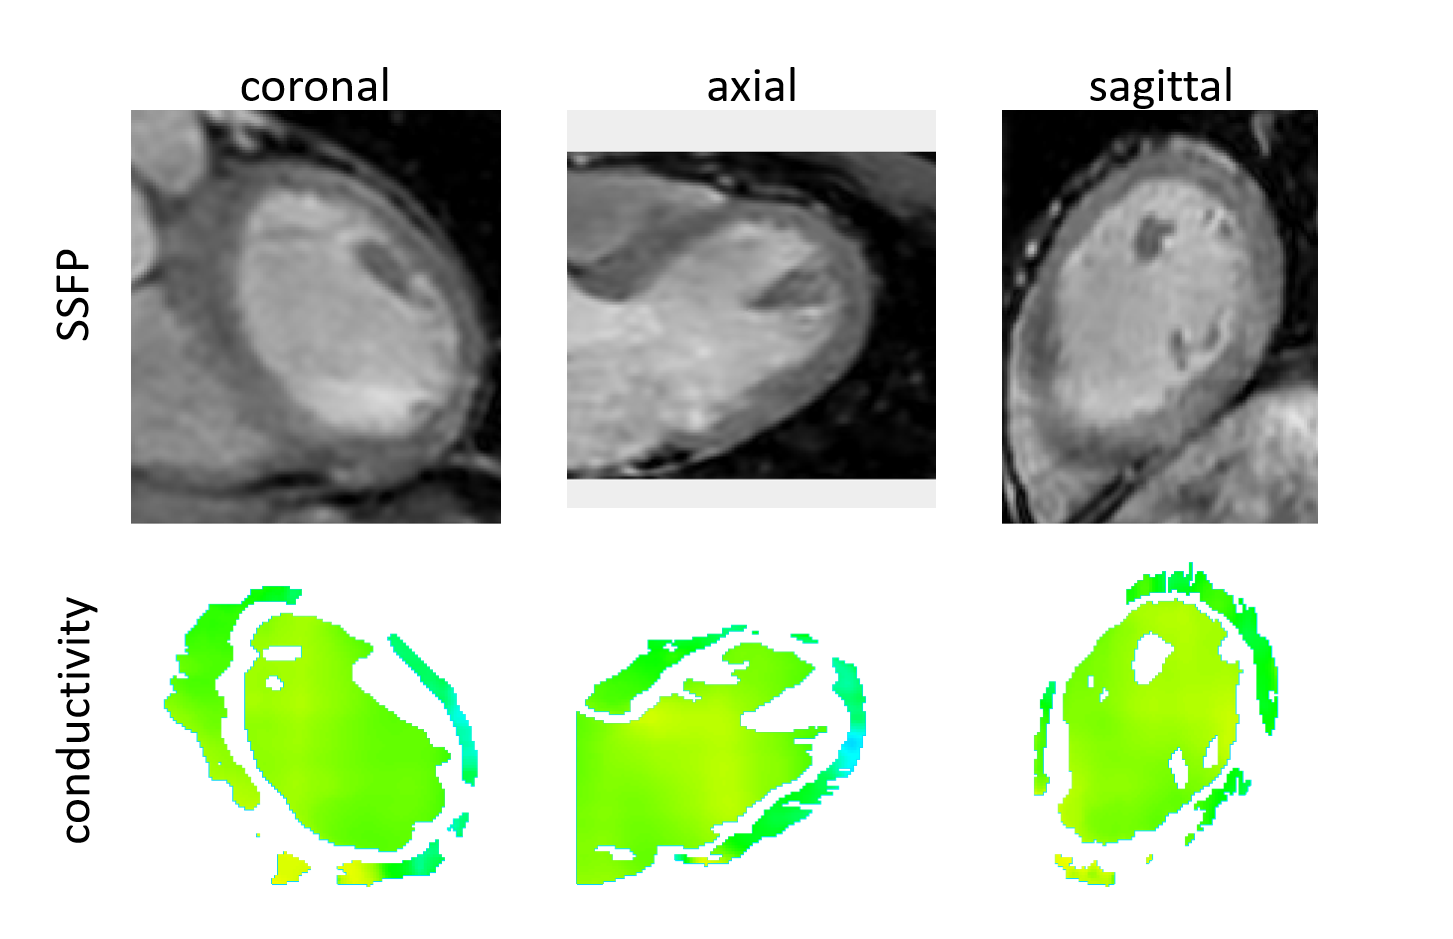
Using a 3T MR system (Ingenia, Philips Healthcare, Best, Netherlands) with an anterior/posterior coil array, 6 healthy male volunteers (mean age 49±8) were measured after obtaining informed written consent according to local Institutional Review Board. For all volunteers, a time-resolved 2D sequence over the cardiac cycle was applied (ECG-triggered SSFP acquired in breath-hold, resolution 2x1.7x8mm3x45ms, flip 45°). For additional evaluation purposes, a static 3D sequence (ECG-triggered and respiratory-gated SSFP 3D whole-heart acquisition in end-diastole, 2mm isotropic resolution, flip 70°) as well as a Q-flow sequence (resolution 2.5x2.6x8mm3x45ms with phase-contrast, flip 10°) have been applied for one of the volunteers. According to the equations above, σ has been derived from the static 3D sequence and σ’ from the time-resolved 2D sequence. Myocardium and blood volume of left ventricle (LV) were segmented semi-automatically and reconstructed conductivity averaged over these two ROIs. For σ', the blood volume was investigated for all time steps across the acquired RR interval to study corresponding flow effects. The myocardium was investigated only for the time point of maximum contraction, i.e., where myocardial volume has its maximum, thus yielding highest reconstruction reliability as discussed above.Results
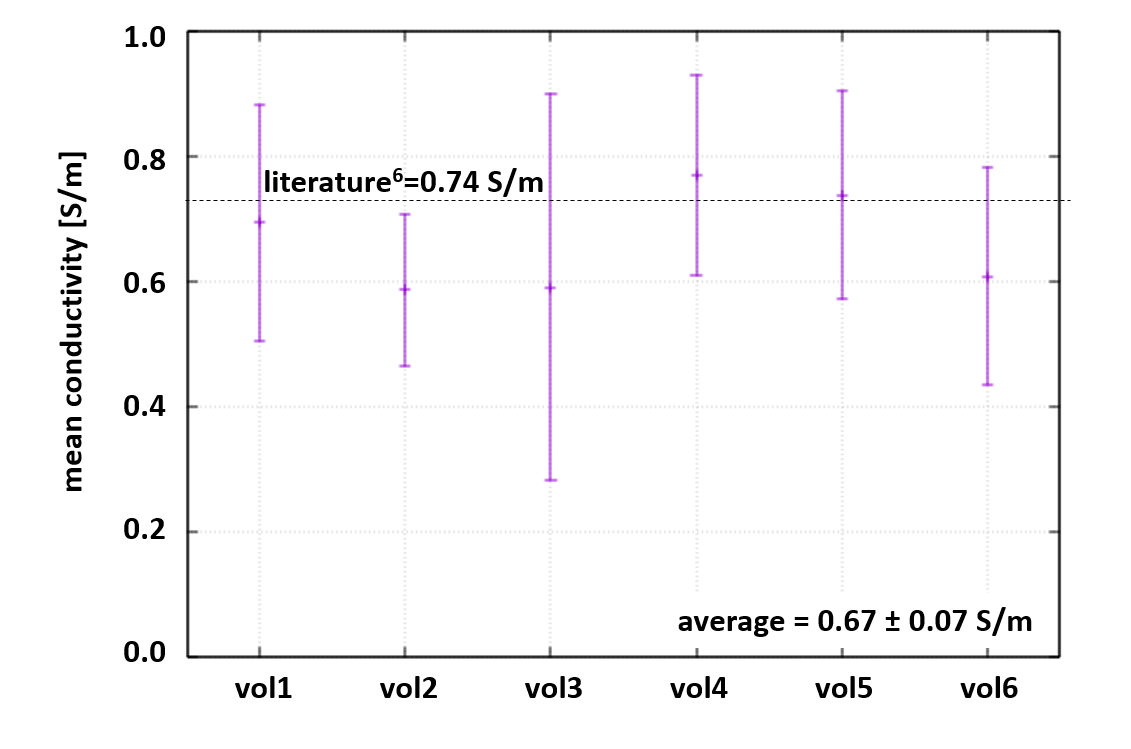
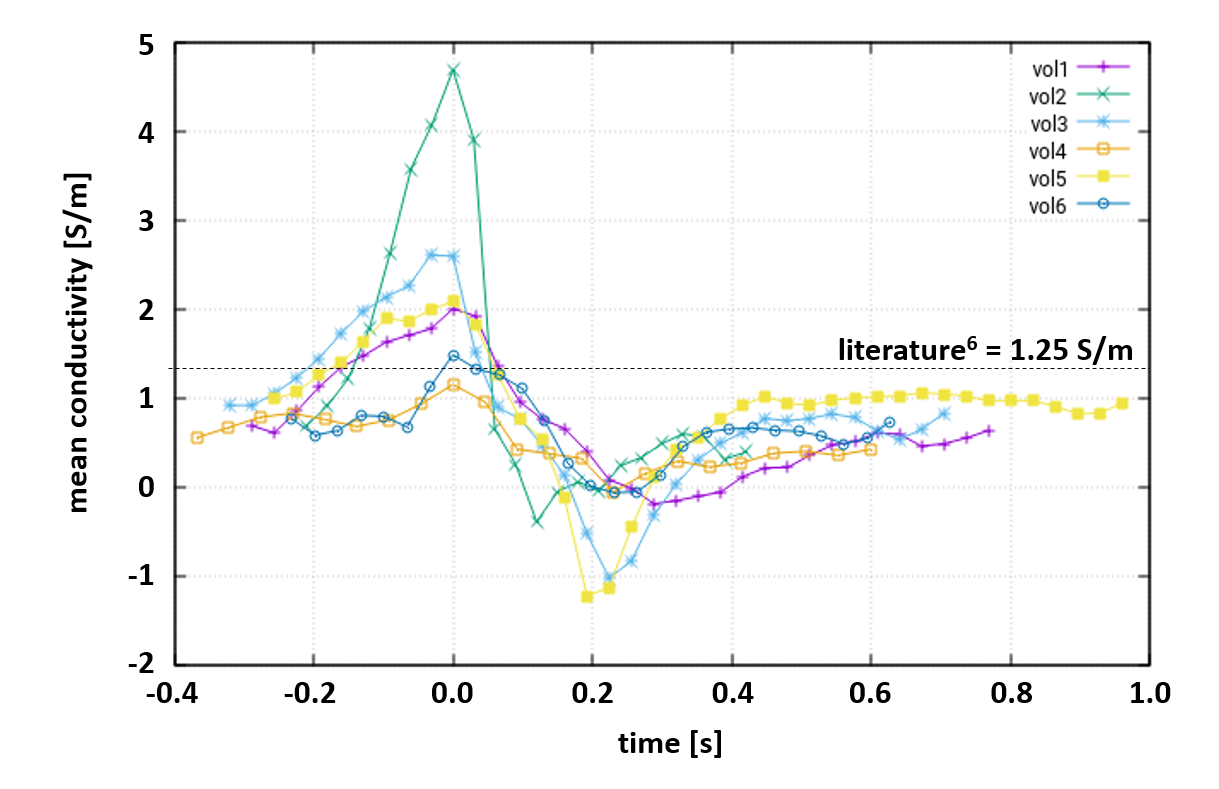
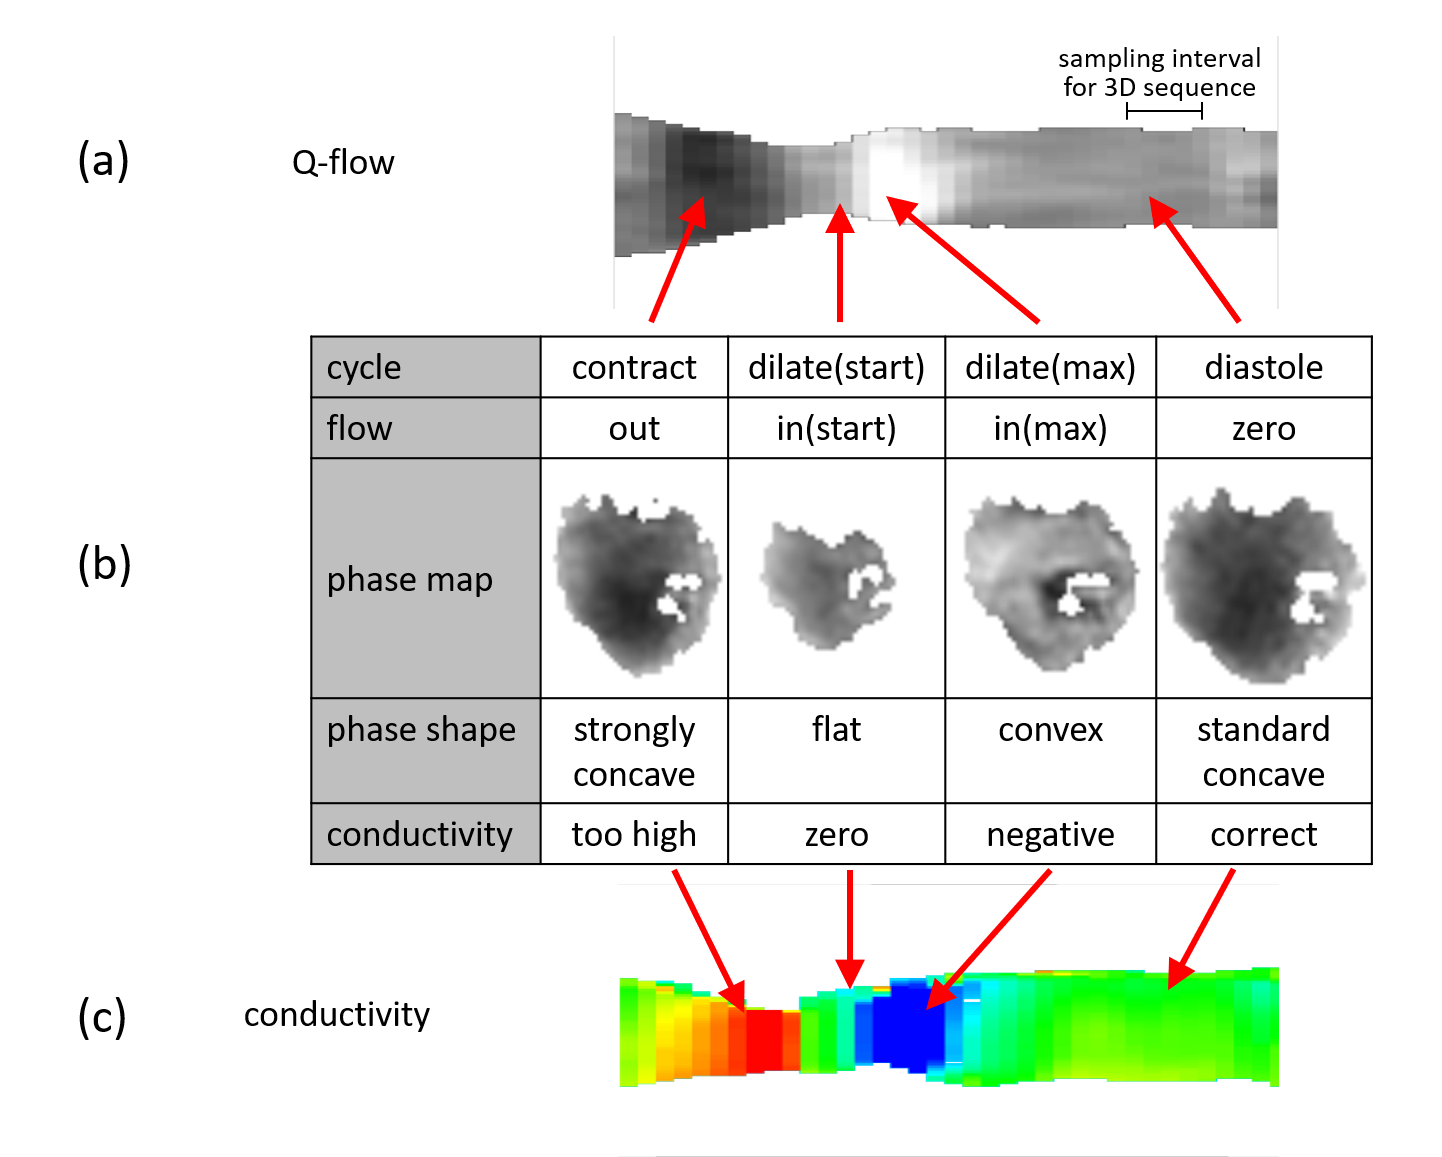
For all volunteers, SSFP images (Fig.1a) and corresponding myocardial conductivity (Fig.1b) of the myocardium for the time point of maximum contraction are shown (short axis view). The mean myocardial conductivity, averaged over all volunteers, is <σ’>=0.67±0.07S/m (Fig.2, literature value=0.74S/m6). Conductivity of LV blood volume is shown in Fig.1c as profile through center of LV for all time steps acquired over the cardiac cycle. The corresponding time curves of the mean blood conductivity are shown in Fig.3. They all show a pronounced maximum during LV contraction (i.e. where blood is leaving LV) and a pronounced minimum during LV dilation (i.e. where blood is entering LV). Blood flow induces a concave/convex curvature of the phase across the LV, yielding the artificially increased/decreased conductivity observed (Fig.4). Figure 5 shows results from the 3D scan of volunteer #3, yielding myocardial conductivity <σ>=0.83±0.29S/m (i.e. <σ>=1.39<σ’>) and blood conductivity <σ>=1.09±0.09S/m (i.e. <σ>=1.52<σ’>).Discussion
The study showed that it is technically feasible to determine passive bulk conductivity of LV myocardium and LV blood. Quantitative conductivity values are in line with expectations, and so is the ratio of σ and σ’ (i.e. conductivity derived from 3D and 2D images). The variation of apparent blood conductivity across the cardiac cycle (consistent over all volunteers) was shown to be caused by blood flow.Acknowledgements
No acknowledgement found.References
1. Katscher U et al., Electric Properties Tomography: Biochemical, physical and technical background, evaluation and clinical applications. NMR Biomed. 2017;30:e3729
2. Voigt T et al., Conductivity imaging of an ischemic pig heart model using electric properties tomography. ISMRM 2012; 20: 3483
3. Stehning C et al., Real-Time Conductivity Mapping using Balanced SSFP and Phase-Based Reconstruction. ISMRM 2011; 19: 128
4. Tha KK et al., Noninvasive Assessment of Electrical Conductivity Characteristics of Normal and Diseased Liver Using Electric Properties Tomography. ISMRM 2018; 26: 5085
5. Tha KK et al., Noninvasive Assessment of Electrical Conductivity of Lung and Mediastinal Mass Lesions: Feasibility and Potential Clinical Value. ISMRM 2020; 28: 434
6. Gabriel S et al., The dielectric properties of biological tissues: II. Measurements in the frequency range 10 Hz to 20 GHz. Phys Med Biol. 1996;41: 2251
Figures