0960
Ultrahigh Field Cardiac MRI in a Large Animal Model of Acute and Chronic Infarction1Chair of Molecular and Cellular Imaging, Comprehensive Heart Failure Center (CHFC), University Hospital Würzburg, Würzburg, Germany, 2Department of Internal Medicine I, University Hospital Würzburg, Würzburg, Germany
Synopsis
Ultrahigh field cardiac MRI in a large animal model with acute and chronic infarction is feasible and enables high resolution functional imaging with 4- to 16-fold higher in-plane resolution compared to clinical systems. Blood-tissue contrast enabled clear identification of tissue boundaries, papillary muscle and the valves. Apical slices were akinetic. Mean values for ejection fraction [%] at baseline and 3-4, 10-14, and 60 days post MI were: 66±5, 45±7, 49±10, 50±5, respectively. Coefficients of variation for intra- and inter-observer variability in ejection fraction were 1.5% and 6.2%. T2*-weighted images and LGE enabled visualization of the infarct area.
Introduction
Large animals are important in translation of preclinical research and imaging findings into the clinical arena. Ultrahigh field (7T) MRI of the heart has been performed only in rare cases, but promises improved image quality and innovative image contrasts for this application when compared with large animal MRI at clinical field strength. Moreover, large animal 7T cardiac MRI is an ideal testbed for method development and feasibility testing for cardiac MRI in humans. We present preliminary data of a study establishing large animal 7T cardiac MRI in a pig model of acute and chronic myocardial infarction.Methods
All experiments were approved by the local animal welfare committee. Seven female German Landrace pigs of the planned infarct group were examined. All MRI measurements are performed using a 7T MAGNETOM™ Terra system (Siemens Healthineers, Erlangen) and in-house built 8Tx/16Rx cardiac transceiver arrays[1] optimized to fit varying thorax dimensions (weight range: 25-90kg). Cardiac gating was performed using an acoustic external triggering device (EasyACT, MRI Tools, Berlin). Anesthesia, breathing, and breath holds for imaging are controlled using a ventilator (Julius, Dräger, Lübeck) and a dedicated capnography device. Contrast agent is applied with a flow rate of 4ml/s using an injection system (MEDRAD® Spectris Solaris EP, Bayer AG, Leverkusen). The study protocol consists of: a baseline MRI; infarct induction via 90min balloon catheter occlusion of the LAD, followed by reperfusion; follow-up MRIs 3-4, 10-14, and ~60 days post MI. After the last measurement animals are euthanized and the heart excised. TTC staining is applied to short axis cuts to determine infarct size. The MRI measurement protocol includes a short axis stack with identical slice positioning for cine (30 cardiac phases), high resolution cine, T2*-weighted images, and LGE. In addition, we acquire first pass perfusion data in two short axis slices (basal and apical) over 40 consecutive hearts. High resolution LGE is also performed post mortem on the last examination day. In-plane resolutions [mm] for cine, high resolution cine, T2*, first pass perfusion, and in vivo LGE were 0.6x0.6, 0.4x0.4, 2.2x2.5, 0.95x1.4, and 1.2x1.2, respectively. The slice thickness was 6mm in all measurements. Data evaluation of cine data was performed using Medis Suite MR (Medis, Leiden) and Matlab (Mathworks, Natick).Results
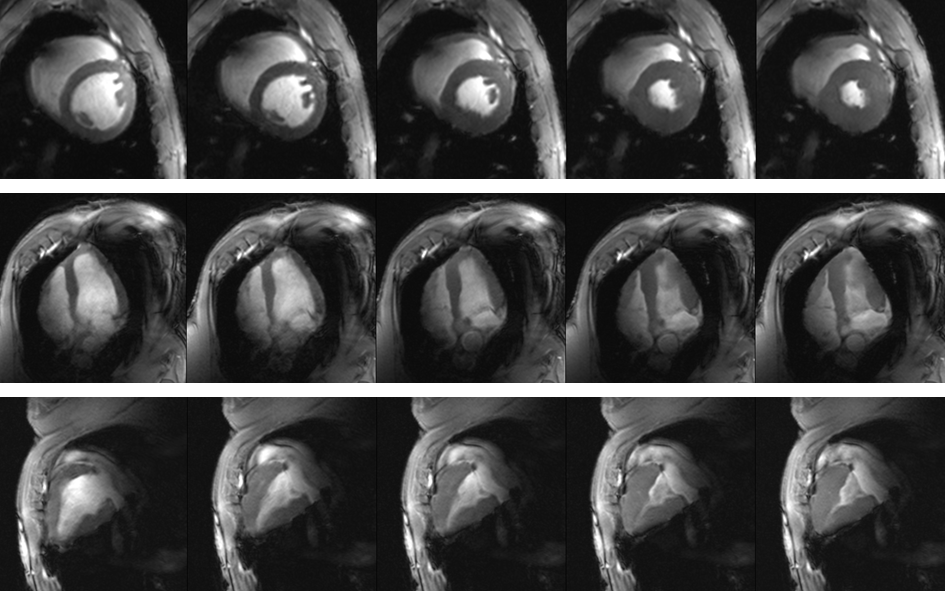
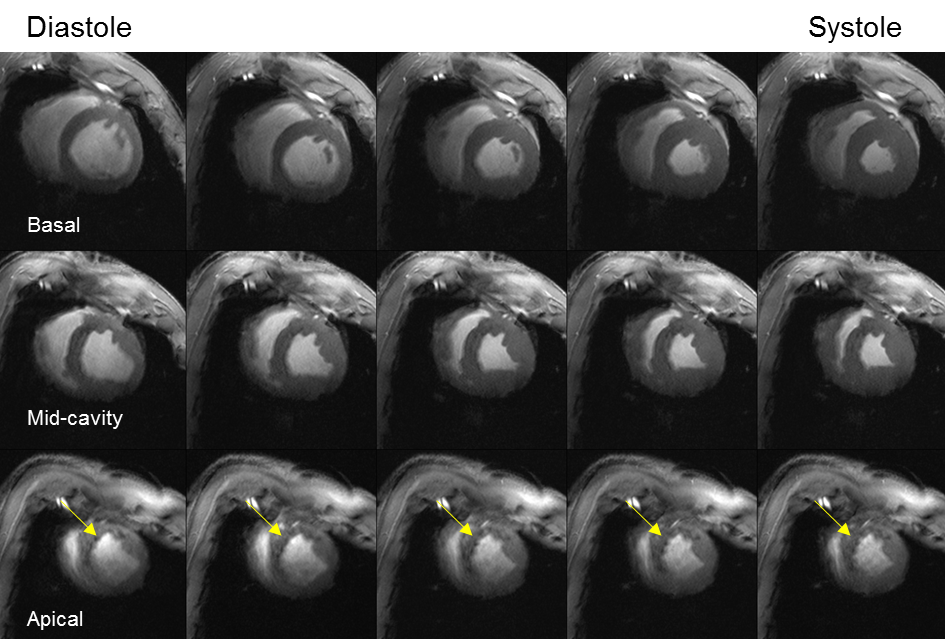
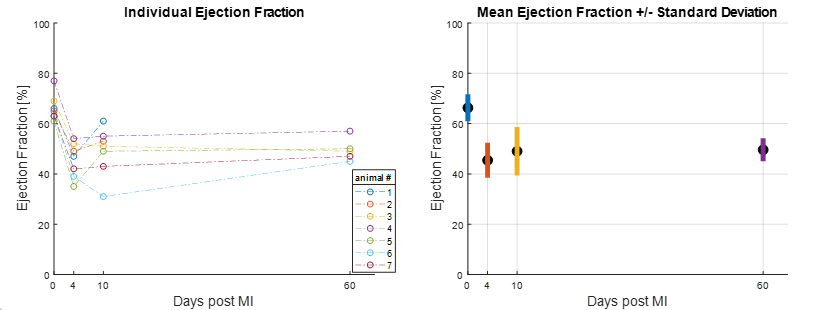
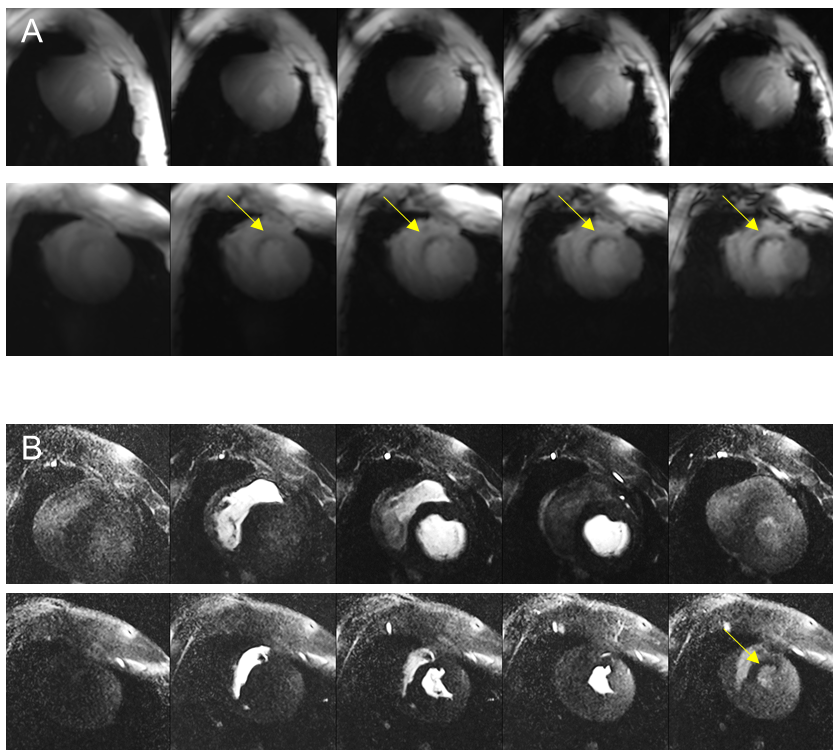
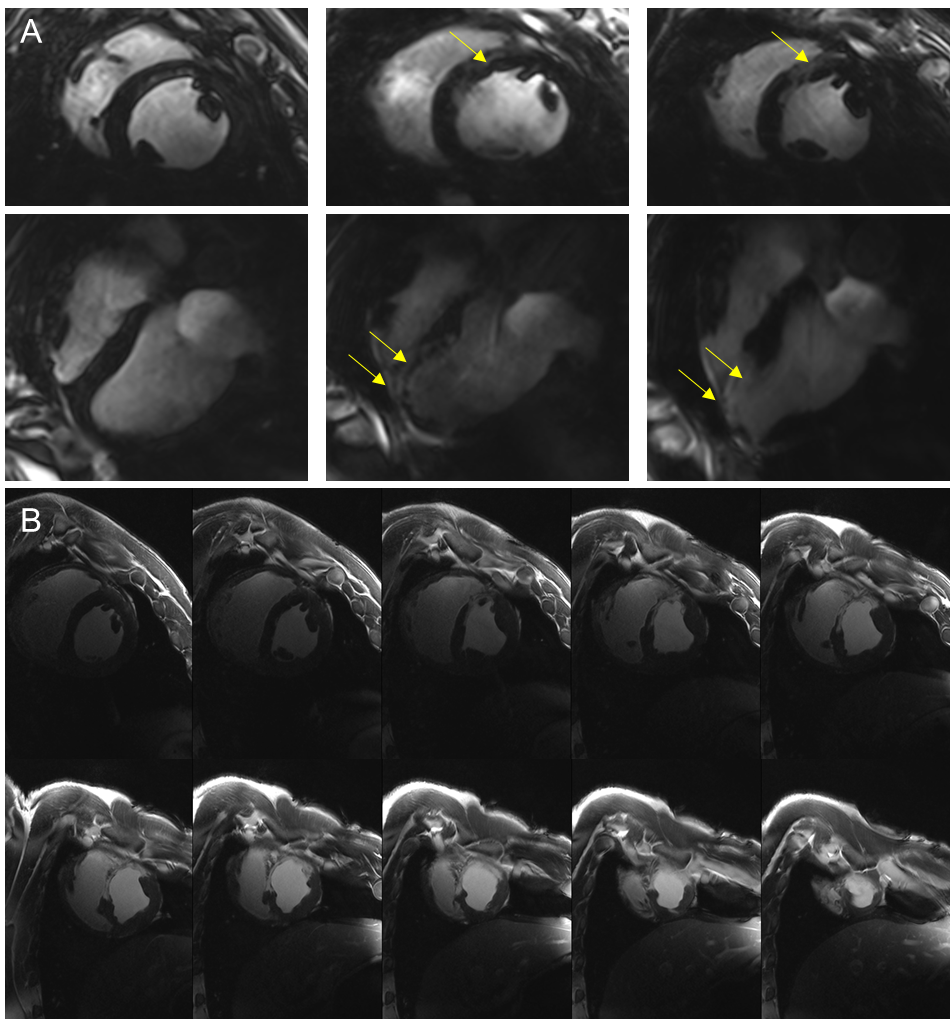
Average animal weights [kg] and average end-diastolic left ventricular mass [g] at baseline, and 3-4,10-14, and 60 days post MI were 37±5, 42±5, 46±5, 75±6, and 81±9, 105±9, 114±7, 167±14, respectively. Figure 1 shows representative cine images prior to infarct induction. The blood-tissue contrast enables clear identification of tissue boundaries, allowing the assessment of cardiac function. Figure 2 depicts a representative basal, mid-cavity, and apical short axis cine images at 5 different time points of the cardiac cycle ten days post MI. While myocardial wall thickening during contraction is unaffected in the basal and mid-cavity slices, the LV is akinetic in apical slices. Areas of susceptibility-induced signal loss in the septum (yellow arrows) are common in apical post-MI cine images. Mean values for ejection fraction [%] at baseline and the three time points post MI were: 66±5, 45±7, 49±10, 50±5, respectively. The development of ejection fraction for individual animals is plotted in figure 3. Coefficients of variation (SD of difference divided by mean) for intra- and inter-observer variability were 1.5% and 6.2%. Representative T2*-weighted images of healthy and infarcted myocardial tissue are displayed in figure 4A. For long TEs susceptibility induced signal loss in infarct area is higher compared to cine acquisitions. Evaluations of T2*-weighted images showed no sign of infarcted tissue in basal slices. Qualitative perfusion measurements (figure 4B) in basal slices depict no perfusion deficit. Interestingly, distinct perfusion deficits in areas correlating with contrast alterations in T2* and LGE are seen in apical slices (figure 5).Discussion
In this study we establish the first setup for large animal 7T cardiac MRI that supports serial measurements over a weight range of 25-90kg and thus, the longitudinal assessment of a large animal model of acute and chronic MI. Baseline EF fraction in our model is comparable to values observed in humans (67±4.6%).[2] Since body size and weight of farm pigs increase rapidly, Lopez et al. performed their longitudinal evaluation of a chronic MI model (90 min occlusion of the LAD) in Yucatan mini-pigs.[3] Reported EF [%] at baseline and 2, 30, and 60 days post MI were 64±8, 53±8, 50±8, 53±5, respectively. This is comparable to our observations. Lopez et al assessed cardiac function at 1.5T with an in-plane resolution of 1.3x1.3mm, which is 4 times lower than our baseline resolution and 16 times lower than our high resolution cine. In our study EF values improve after the acute stage, which is similar to observations in patients, where acute MI initially led to left ventricular EF ≤40%.[4] Our preliminary data suggest, that T2*-weighted imaging and LGE provide similar information with respect to infarct size. Moving forward, we aim to provide initial insights, whether imaging based on susceptibility induced contrast at ultrahigh field strength may become a suitable replacement for LGE.Acknowledgements
Financial support: German Ministry of Education and Research (BMBF, grant: 01E1O1504). We thank K. Körner for excellent support and insightful remarks throughout the study. We thank M.J. Ankenbrand for organizational support and S. Nguyen for support during MR measurements.References
1. Elabyad, I., et al., A Novel Mono-surface Antisymmetric 8Tx/16Rx Coil Array for Parallel Transmit Cardiac MRI in Pigs at 7T. Scientific reports, 2020. p. 3117.
2. Maceira, A.M., et al., Normalized left ventricular systolic and diastolic function by steady state free precession cardiovascular magnetic resonance. J Cardiovasc Magn Reson, 2006. 8.
3. Lopez, D., et al., Multiparametric CMR imaging of infarct remodeling in a percutaneous reperfused Yucatan mini-pig model. NMR in biomedicine, 2017. 30(5): p. 10.1002/nbm.3693.
4.Sjöblom, J., et al., Evolution of left ventricular ejection fraction after acute myocardial infarction: implications for implantable cardioverter-defibrillator eligibility. Circulation, 2014. 130(9): p. 743-8.
Figures