0958
Metabolic profiles of glioma grade and IDH mutation status using high resolution 7T 3D-FID-MRSI: Preliminary results1High-field MR Center, Department of Biomedical Imaging and Image-guided Therapy, Medical University of Vienna, Vienna, Austria, 2Department of Neurosurgery, Medical University of Vienna, Vienna, Austria, 3Division of Neuroradiology and Musculoskeletal Radiology, Department of Biomedical Imaging and Image-guided Therapy, Medical University of Vienna, Vienna, Austria, 4Christian Doppler Laboratory for Clinical Molecular MR Imaging, Vienna, Austria, 5Division of Oncology, Department of Inner Medicine I, Medical University of Vienna, Vienna, Austria, 6Division of Neuropathology and Neurochemistry, Department of Neurology, Medical University of Vienna, Vienna, Austria, 7Division of Medical Imaging and Nuclear Medicine, Medical University of Vienna, Vienna, Austria
Synopsis
We measured 38 HGG and LGG patients with a 15 min MR spectroscopic imaging sequence with an isotropic voxel size of 3.4 mm, covering a 64×64×39 matrix. After post-processing the measured spectra were analyzed statistically. Clinically segmented tumor regions showed statistically significant differences in metabolic ratios compared to normal-appearing white matter. Further analysis of metabolic hotspots with respect to tumor grade and IDH mutation status yielded no significant differences beyond myo-Inositol decreasing with tumor grade.
Purpose
We recently demonstrated the application of 7 Tesla (7T) magnetic resonance spectroscopic imaging (MRSI) in high-grade gliomas (HGG) [1], especially with glutamine and glycine as potential biomarkers of interest. Expanding this study by including low-grade gliomas, we focus on the detailed evaluation of metabolite ratios in regions of interest. The application of our method to the classification and delineation of brain tumors benefits from increased spatial and spectral resolution but creates increasing amounts of data beyond reasonable manual evaluation. Therefore, we developed an ROI-based evaluation pipeline for our metabolite images. Our goal is to identify biomarkers with significant differences between glioma grades and neoplastic mutations like isocitrate dehydrogenase 1 (IDH1) compared to wildtypes [2]. Improved preoperative grading could benefit therapeutic choices and a better definition of maximum safe resections leveraging high-resolution metabolic imaging. Our continued analysis will be the next step towards an automated evaluation of cutting edge MRSI for clinical use.Methods
36 Patients with WHO Grade II-IV Gliomas (median age: 51 +-24) and no contraindications for 7T MRI (p.e. claustrophobia or metal implants) were recruited at the Department of Neurosurgery. The HGGs and low-grade gliomas (LGGs) were diagnosed histologically by the Division of Neuropathology and Neurochemistry, according to the WHO 2016 classification [3]. 3D-MRSI with concentric ring trajectory acquisition was acquired in 15 min using a Siemens Magnetom 7T with a 32-channel coil (Nova Medical). The isotropic voxel size was 3.4 mm, with 64×64×39 matrix covering a field of view of 220×220×133 mm [4]. Our protocol included Magnetization Prepared 2 RApid Gradient Echo (MP2RAGE) and fluid attenuated inversion recovery (FLAIR) MRI with an isotropic resolution of 0.8 mm. Voxel spectra were quantified using an in-house designed software pipeline including LCModel. We calculated metabolic ratio maps of total Choline (tCho), n-acetylaspartate (NAA), n-acetylaspartylglutamate (NAAG), myo-inositol (mIns), γ-aminobutyric acid (GABA), glutathione (GSH), glutamate (Glu), glutamine (Gln), glycine (Gly), taurine (Tau) and serine (Ser) all to total creatine (tCr). A neuroradiologist provided tumor segmentation based on routine imaging. We conducted a statistical analysis using RStudio. We set specific cutoff values to define hotspots for each metabolite ratio to tCr map within tumor segmentation to obtain regions of interest (ROIs). We tested hotspot ROIs vs. normal appearing white matter (NAWM) control metabolic ratios statistically for differences as well as tumor ROIs for differences in grade (HGG vs. LGG). These regions were also further analyzed for IDH1 mutated gliomas vs. IDH wildtype. We compared the respective regions' median voxel values on boxplots and performed a t-test on a 95% significance level.Results
Our quantification yielded high-resolution metabolic ratio maps in 24 HGG (of which 9 had the IDH1 mutation) and 12 LGG (10 with IDH1) (Fig.1). The metabolic maps showed high signal heterogeneity in the segmented tumor region (see Fig.3). Statistical analysis of the tumor hotspots vs. normal-appearing white matter (NAWM) yielded significantly increased median voxel values in tumor NAAG, Cho, Gln, Gly GABA, Cys, GSH, Tau and Ser (see Fig.2). Our evaluation yielded significantly increased median voxel values of mIns signal in LGG hotspots, compared to HGG. All other ratios showed no significant differences between tumor grade (see Fig. 4). Ratio maps of all tested metabolites showed no significant differences in IDH1 mutated median values of tumor hotspots, compared to IDH wildtype (see Fig.5).Discussion
The significant differences in metabolite ratios between tumor hotspots and NAWM prove that the technology can distinguish tumors from NAWM. We could use the technology potentially for preoperative glioma delineation. Especially if we analyzed the tumor margins and the peritumoral zone in the future. We saw significantly different mIns ratios in HGGs vs. LGGs. A potential application of the technology in preoperative glioma grading needs more research. Improvement of our statistical model is still in progress. None of the metabolite ratios that we analyzed showed significant differences in IDH1 mutated vs. IDH-wildtype gliomas. Maybe further analysis of combined ratios with enhanced methods will enable us to detect differences in the future. As the tumor cell acquires the IDH1 mutation, alternative metabolic pathways get activated to meet the altered demands. Non-invasive IDH mutation status predictions would be of special interest, as IDH1 mutation status will play an even more prominent role in the new 2021 WHO Glioma classification. In the future, a more sophisticated study with a larger patient cohort and improved data analysis might still find significant differences. Our observed differences in tumor regions vs. NAWM and the different mIns signal ratios in HGG vs. LGG patients show some potential for preoperative tumor grading. The application of 7T MRSI to detect other molecular markers, such as 1p19q codeletion or O[6]-methylguanine-DNA methyltransferase MGMT methylation fraction should also be tested in the future. Automated statistical evaluation of larger patient samples may one day enable us to understand tumor heterogeneity better and improve patient outcomes based on radiomics.Acknowledgements
This study was supported by the Austrian Science Fund (FWF) grants KLI-646, P 30701 and P 34198.References
[1] Hangel, G., et al. (2020). "High-resolution metabolic imaging of high-grade gliomas using 7T-CRT-FID-MRSI." NeuroImage: Clinical 28: 102433.
[2] Stadlbauer, A., et al. (2020). "Intratumoral heterogeneity of oxygen metabolism and neovascularization uncovers 2 survival-relevant subgroups of IDH1 wild-type glioblastoma." Neuro-Oncology 20(11): 1536-1546.
[3] Louis, D. N., et al. (2016). "The 2016 World Health Organization Classification of Tumors of the Central Nervous System: a summary." Acta Neuropathologica 131(6): 803-820.
[4] Hingerl, L., et al. (2020). "Clinical High-Resolution 3D-MR Spectroscopic Imaging of the Human Brain at 7 T." Investigative Radiology 55(4): 239-248.
[5] Zhou, W. and D. R. Wahl (2019). "Metabolic Abnormalities in Glioblastoma and Metabolic Strategies to Overcome Treatment Resistance." Cancers 11(9): 1231.
Figures
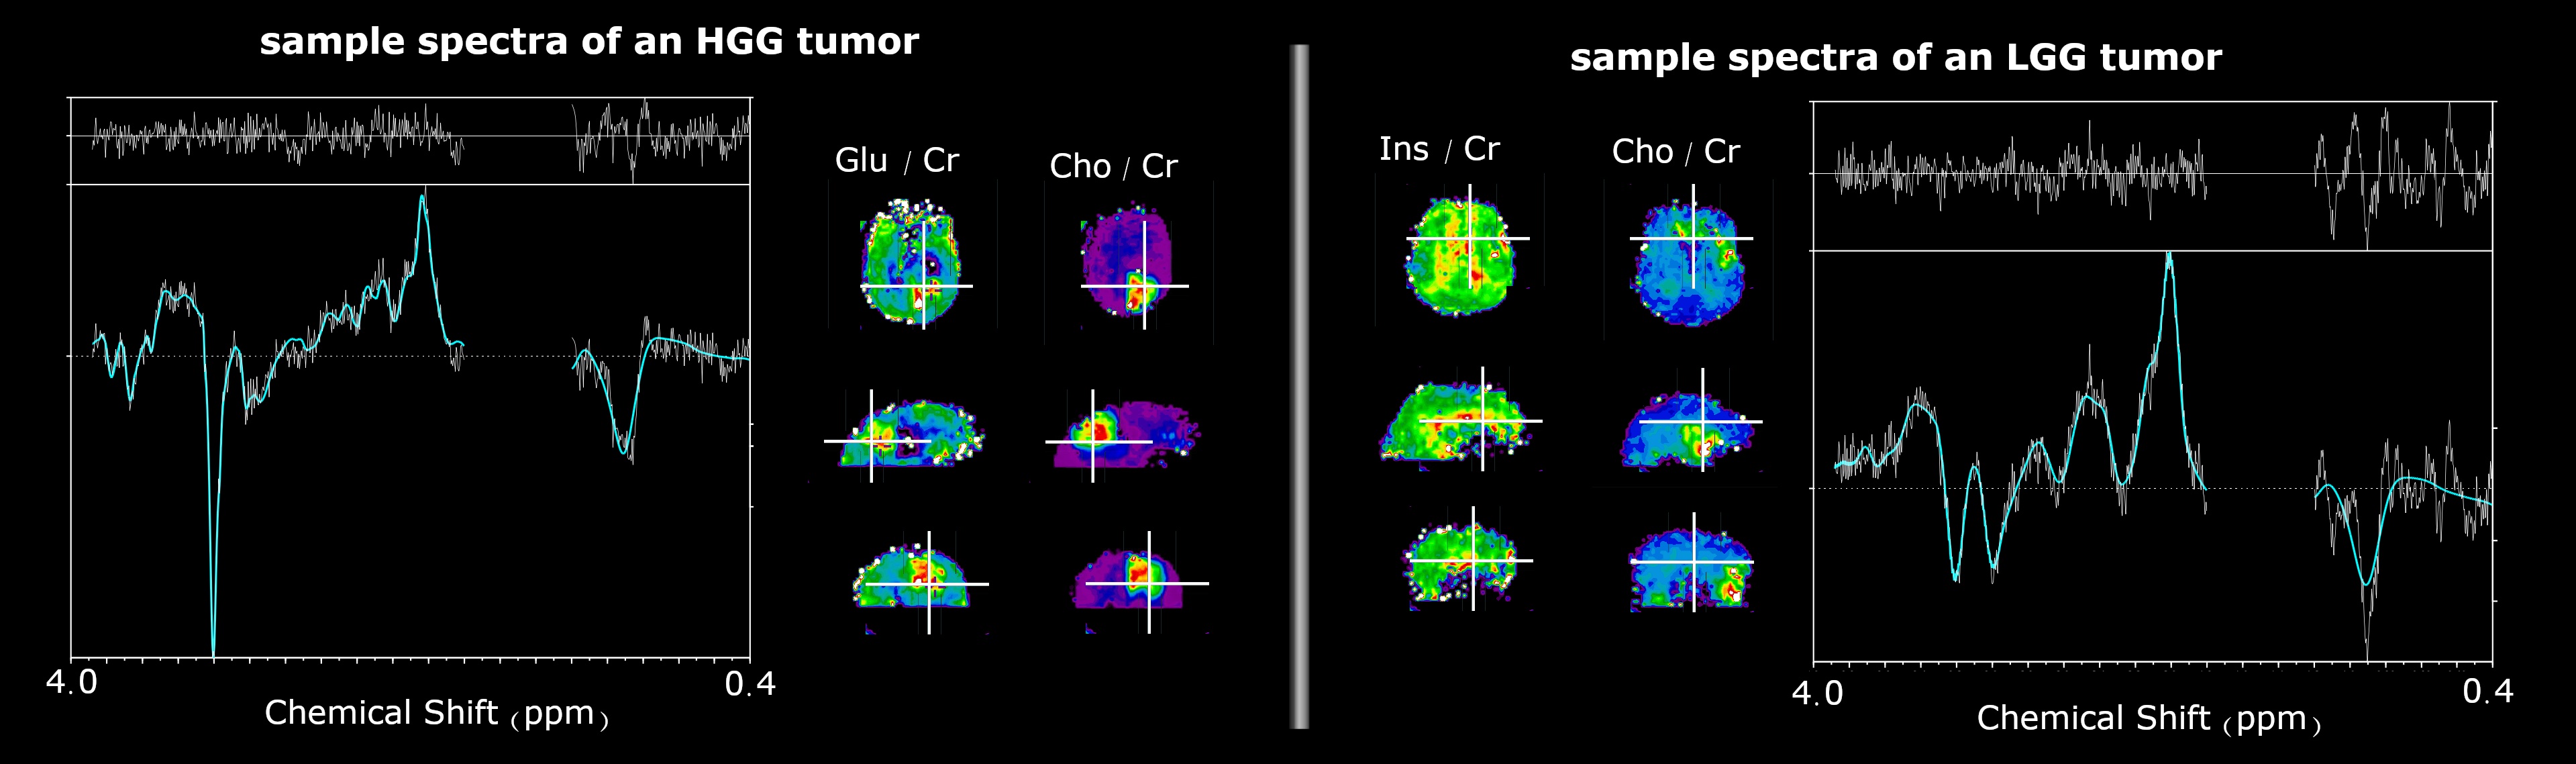
Fig 1 - Comparison of HGG and LGG sample spectra showcasing some of the observed metabolic heterogeneities within gliomas.
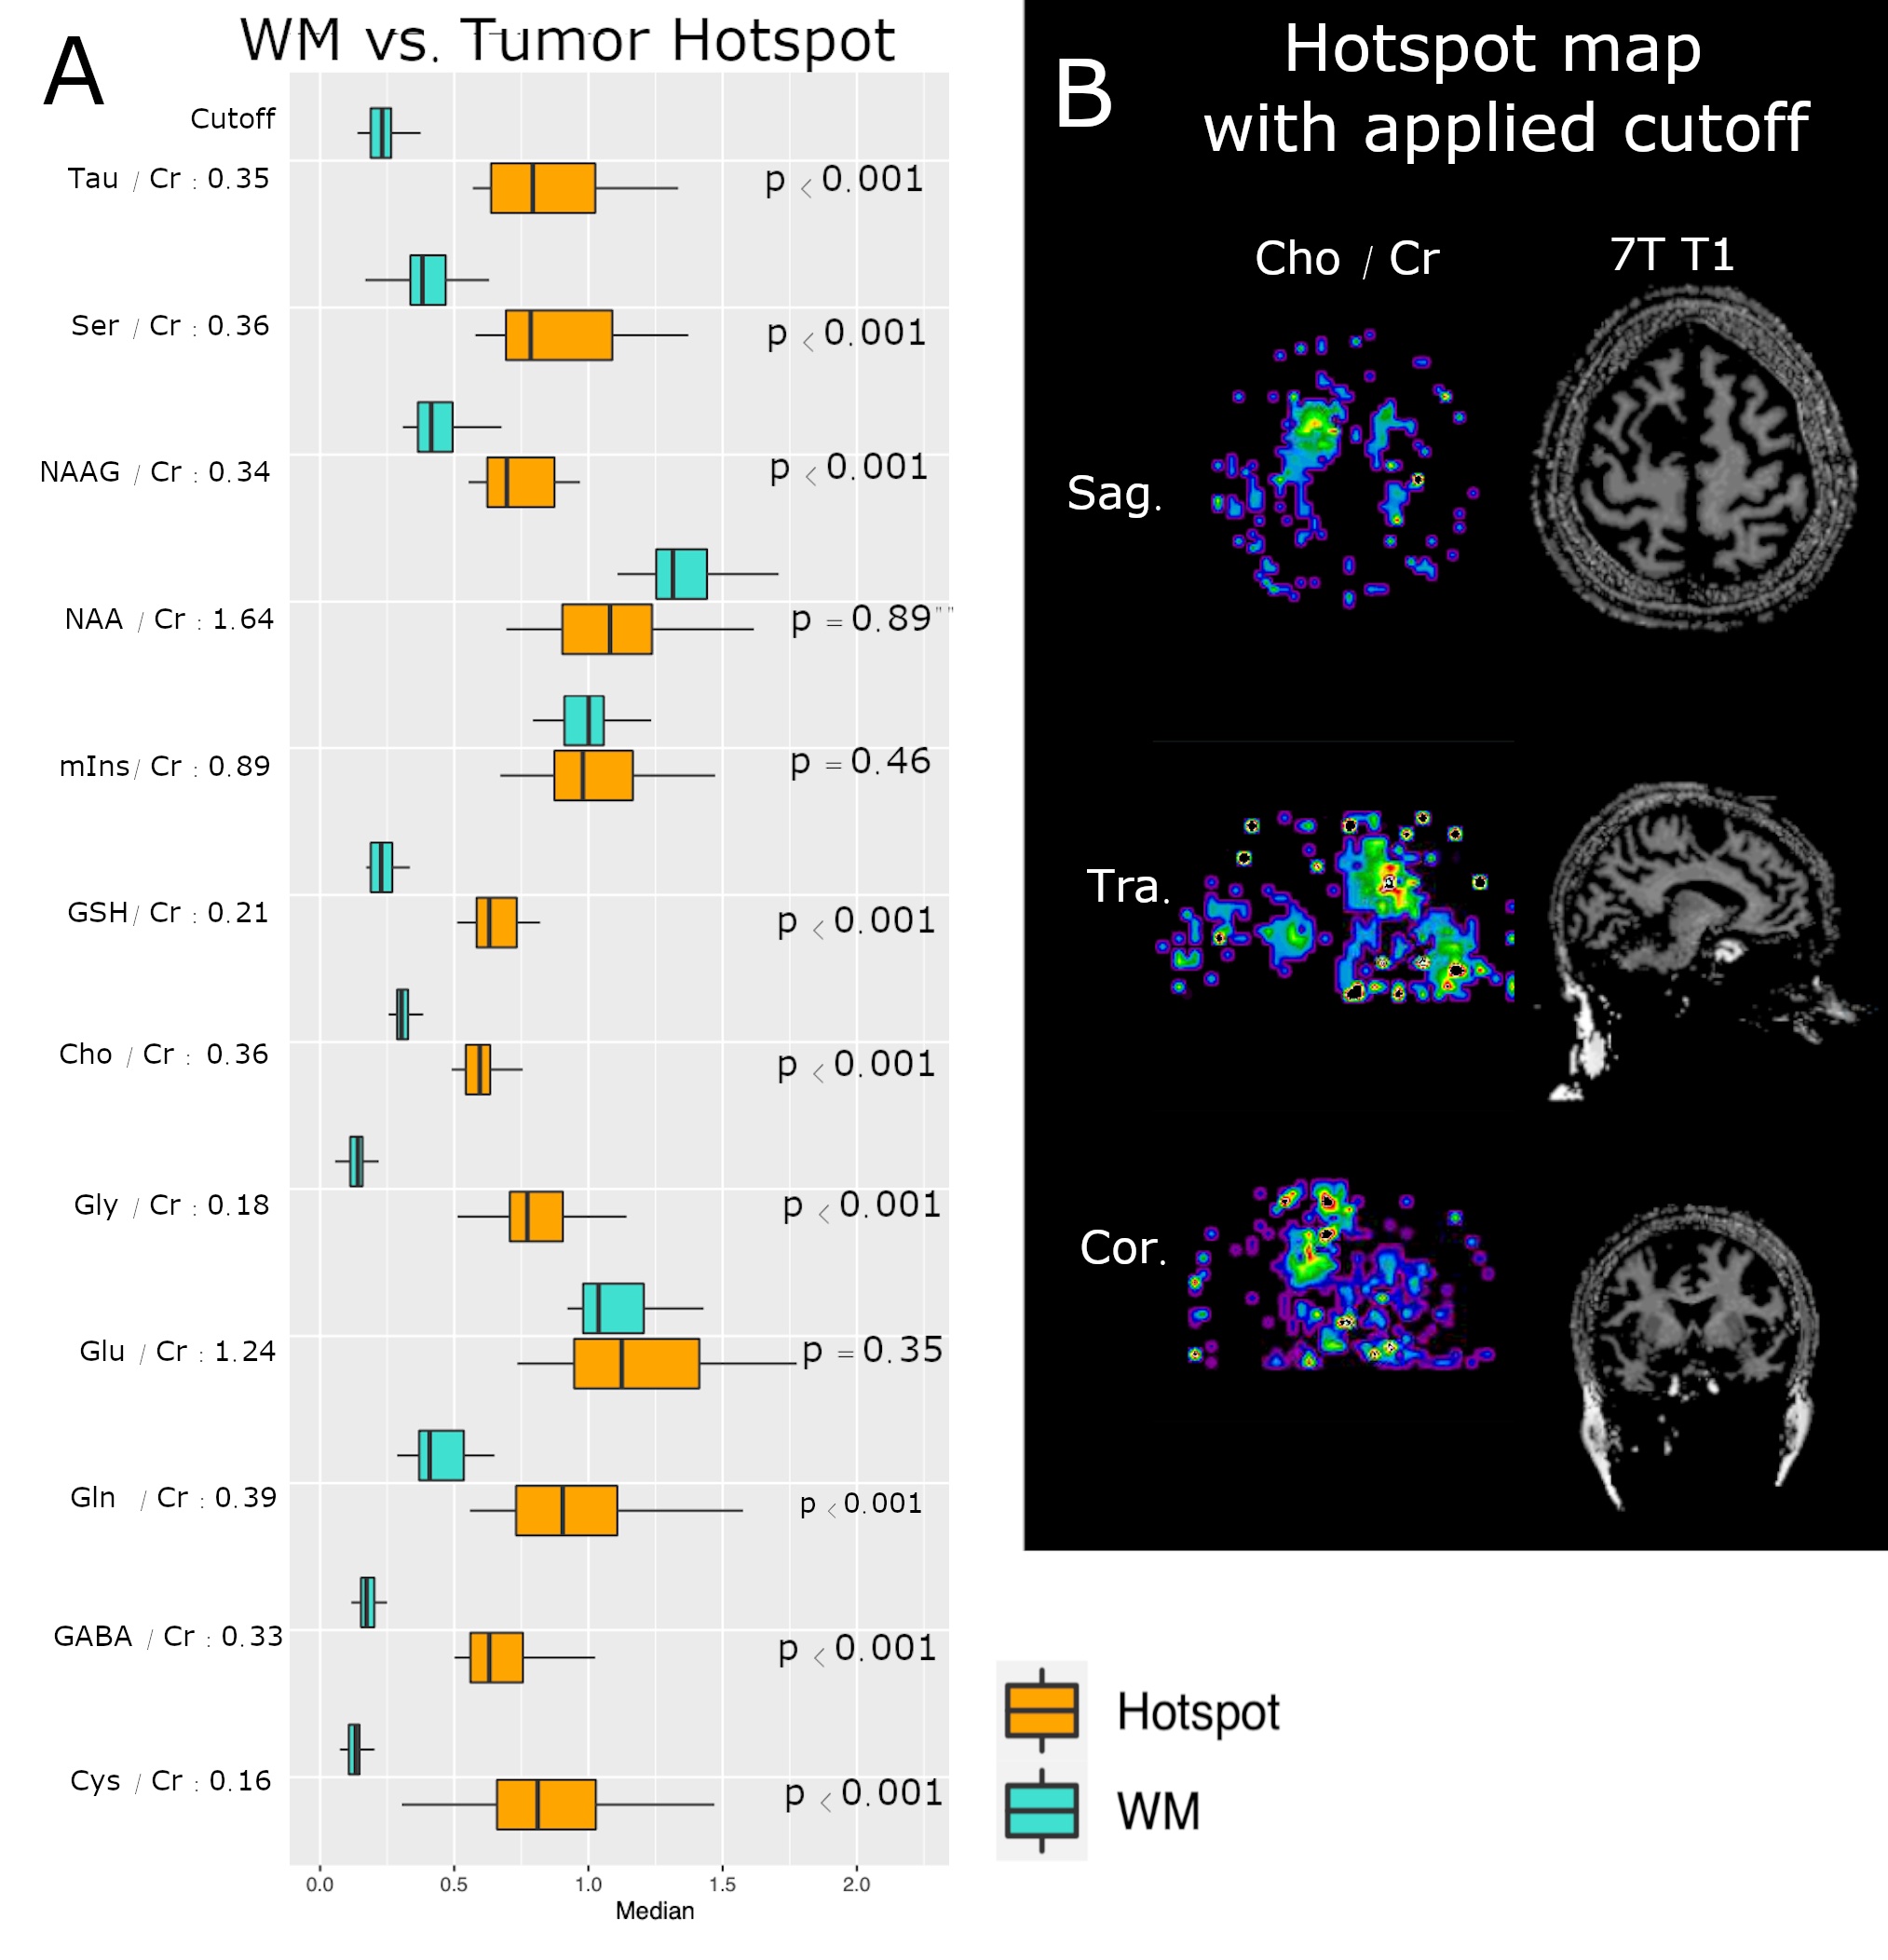
Fig 2 - Boxplots tumor ROI vs WM ROI
Most of the metabolites show significant differences in median voxel values of the tumor hotspot region vs. NAWM (see. A). On the B side, we can see a sample hotspot map of tCho with applied cutoff of 0.36 and the 7T T1 magnitude.
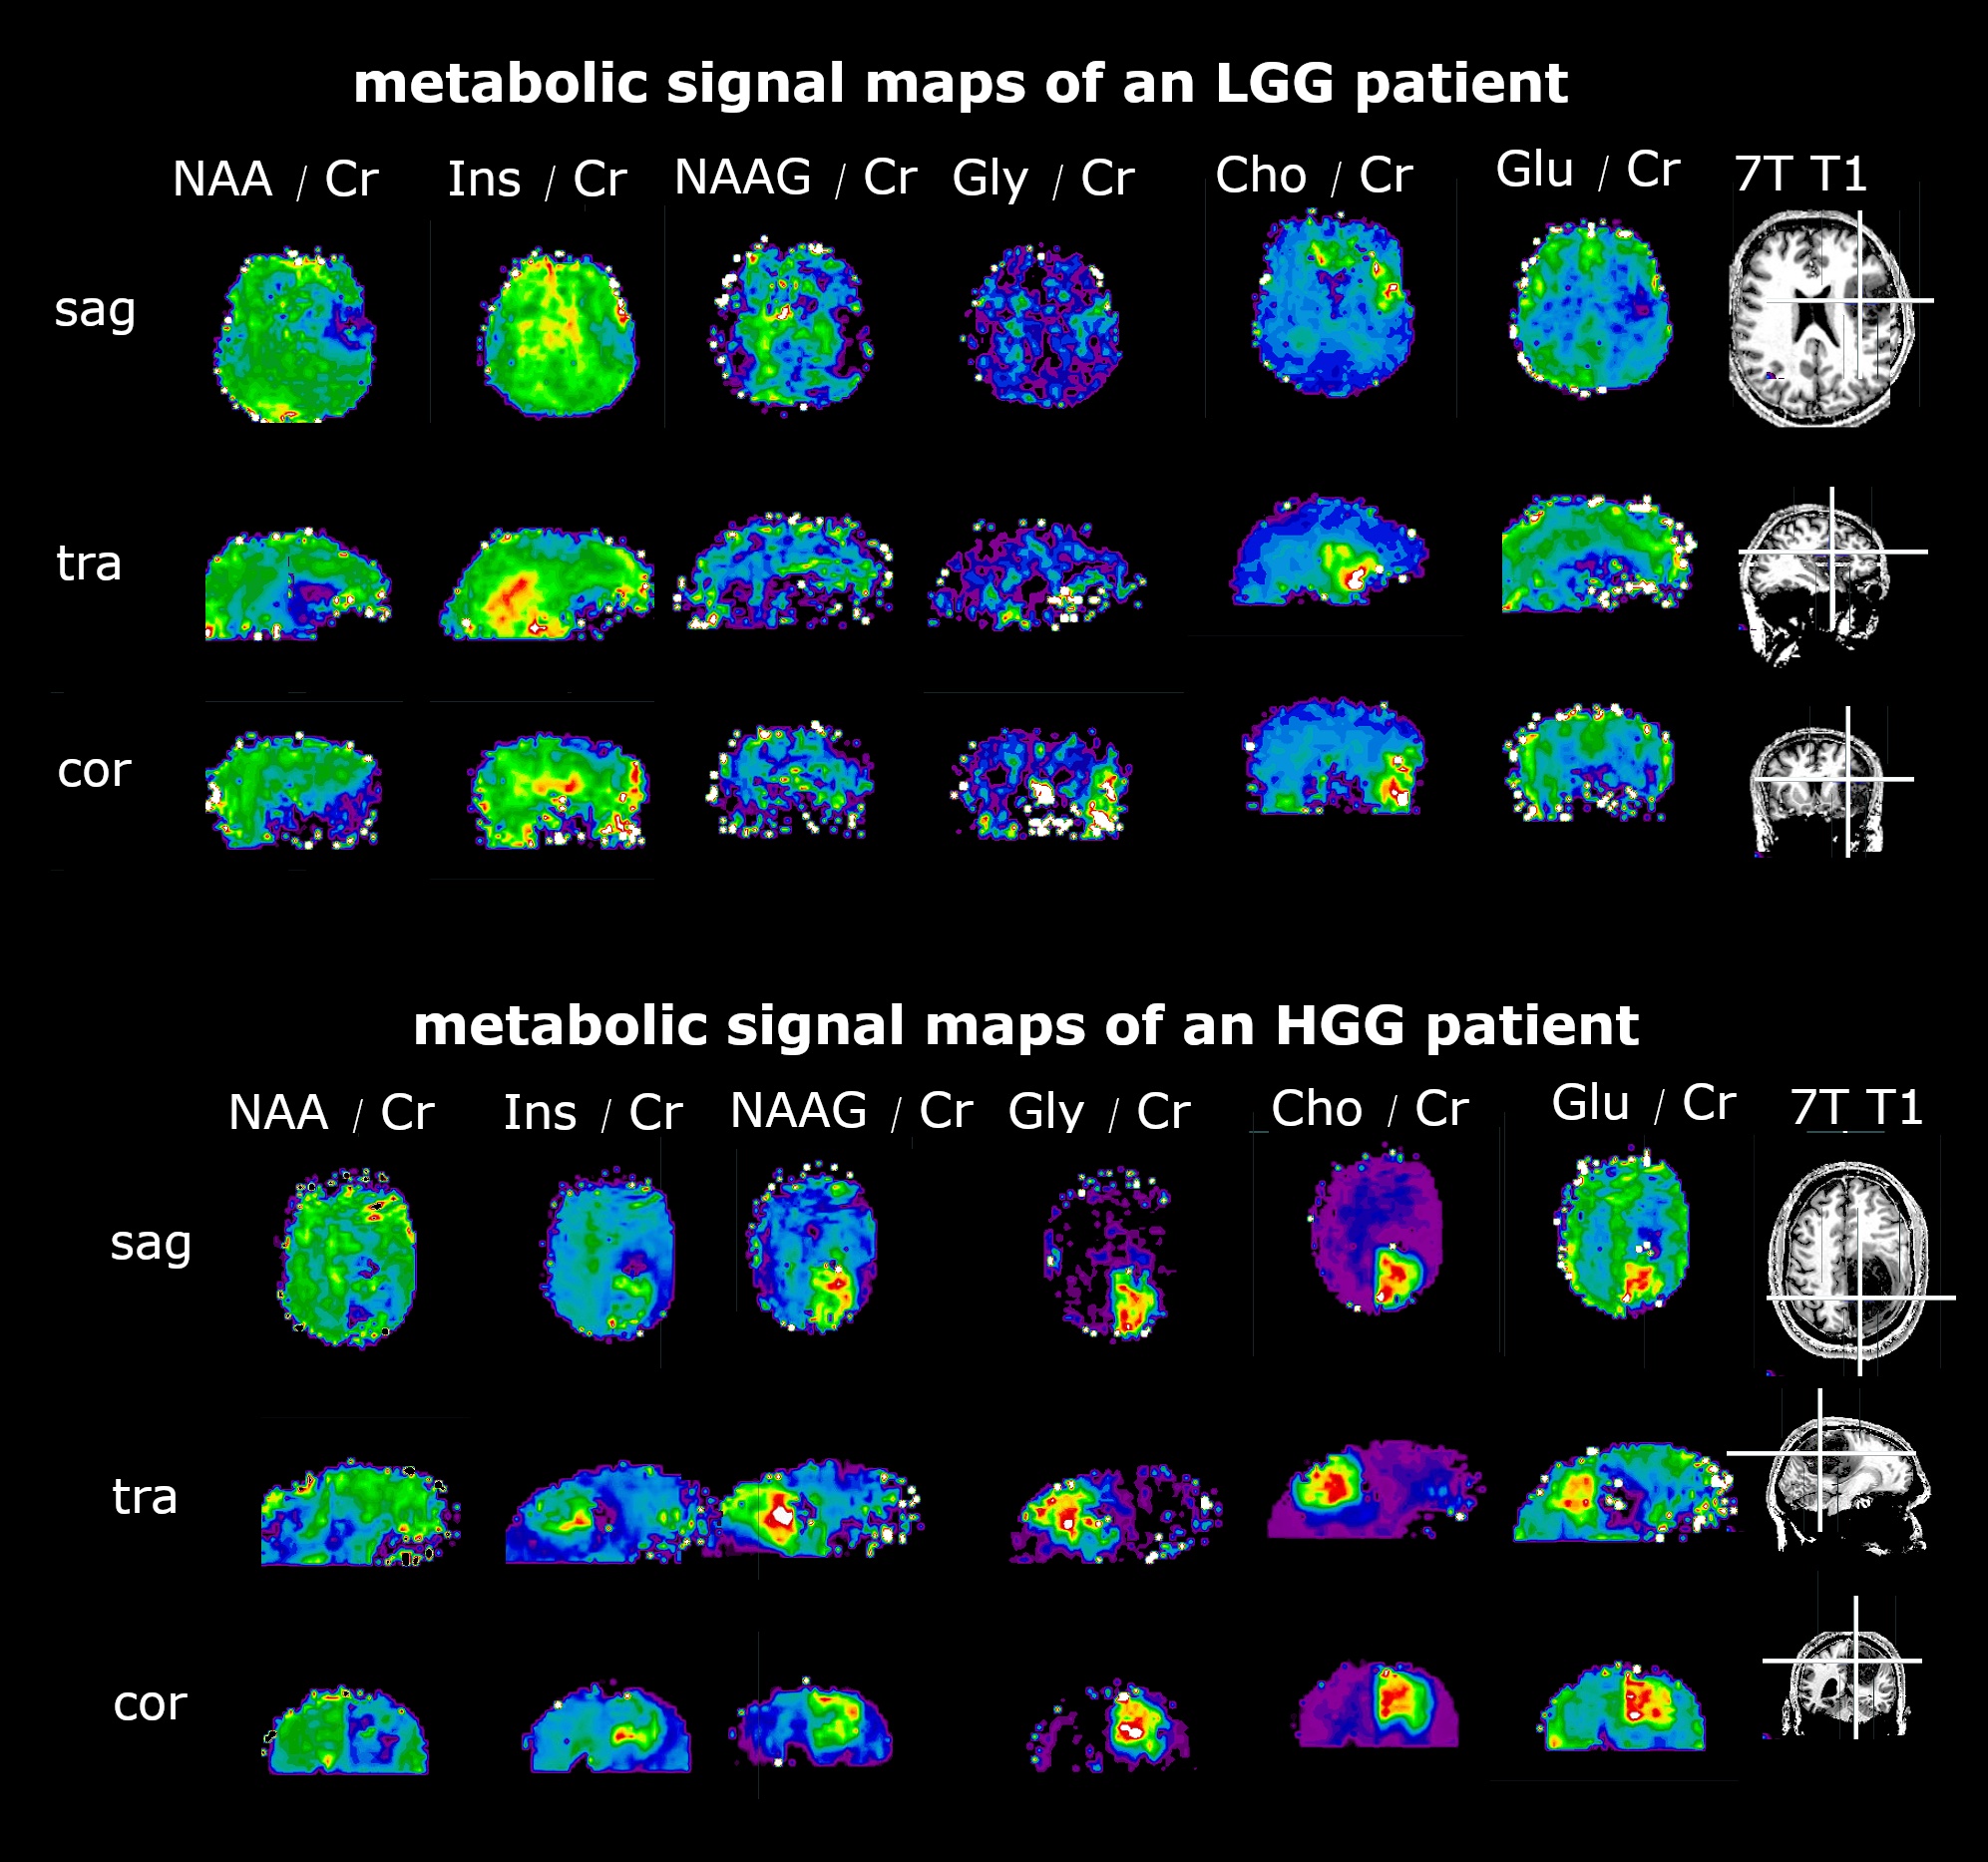
Fig 3 - Direct comparison figure - LGG vs HGG
We can see ratio maps of different metabolites to Creatine ratios and the 3T contrast-enhancing clinical images, as well as the 7T T1 images. The LGG patient on top shows a different metabolite pattern in the region of the contrast-enhancing region, compared to the HGG patient below.
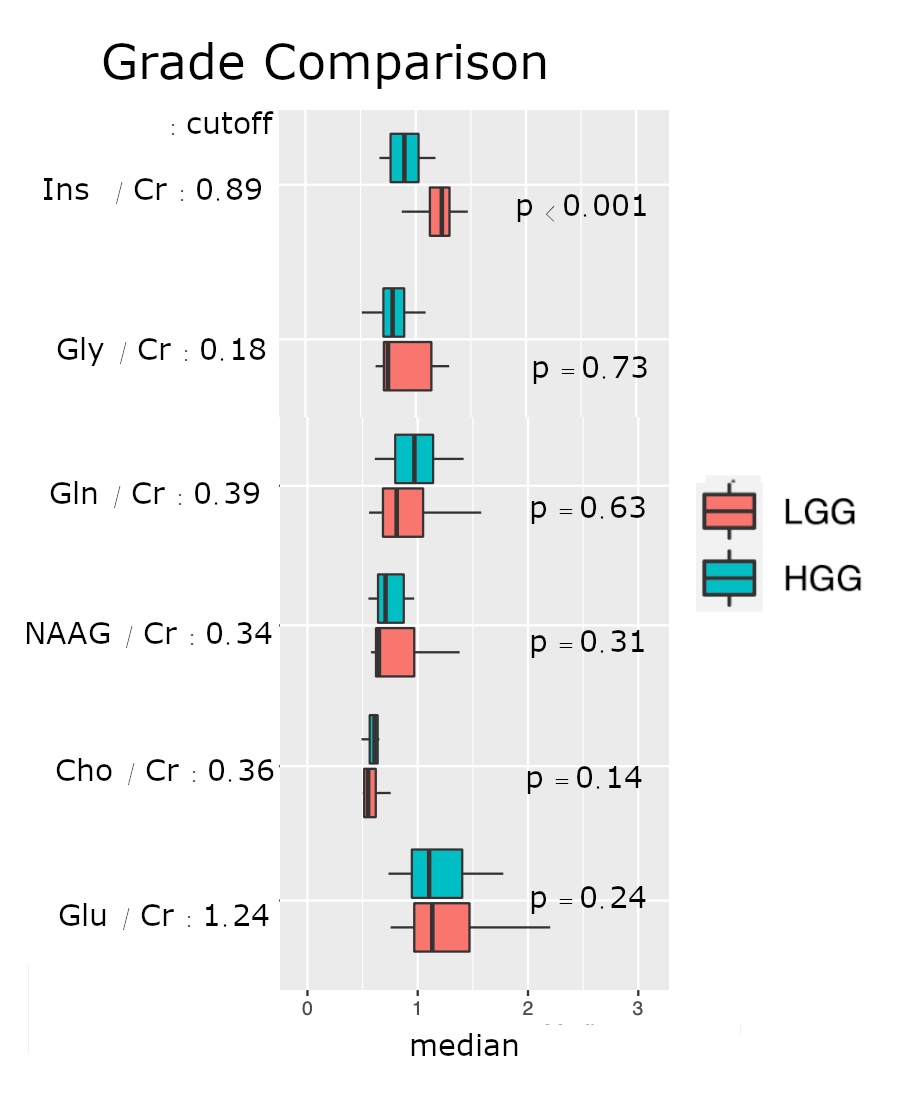
Fig 4 - Boxplots Grading
Boxplots for different metabolite ratios in different glioma grades (HGG vs. LGG) are plotted. LGGs show significantly elevated mIns signal compared to HGG patients. As we can see on the p-values, the other metabolites showed no significant differences in median metabolic ratios.
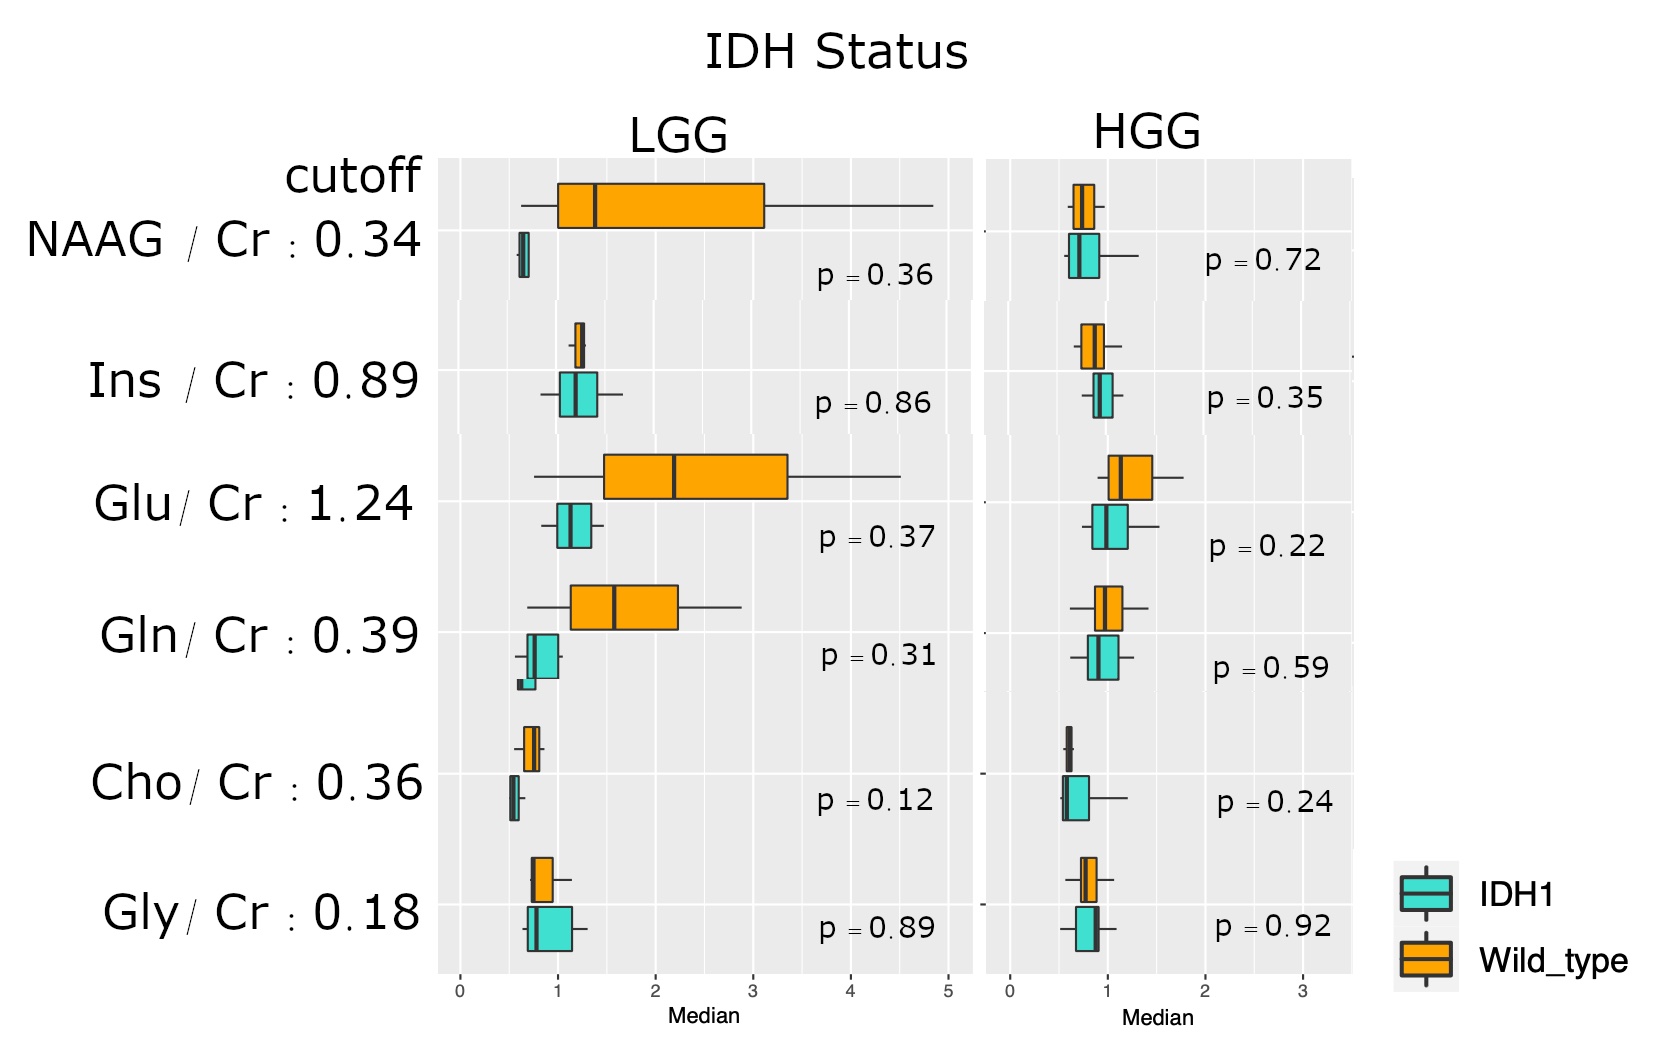
Fig 5 - Boxplots IDH
Metabolic ratios are plotted separately for IDH1 mutated vs. IDH wildtype and further separated according to glioma grade. On the first glance, it seems that there are differences in median metabolic ratios of mutated IDH1 gliomas compared to IDH wildtype. However, none of these differences are statistically significant. Further studies with larger patient cohorts are needed to evaluate for metabolic differences with IDH.