0956
31P spectral profiles in brain tissues of volunteers and glioma patients at 7T1Medical Physics in Radiology, German Cancer Research Center (DKFZ), Heidelberg, Germany, 2Radiology, German Cancer Research Center (DKFZ), Heidelberg, Germany
Synopsis
The low spatial resolution of 31P MRSI of the human brain leads to a weighted mixture of specific spectral profiles from different tissue types in localized 31P spectra of individual voxels. Application of high-resolution 31P MRSI to volunteers and glioma patients at ultra-high B0 yields a possibility to approach brain tissue-specific profiles, which could aid interpretation of observations from 31P MRSI. The presented high-quality 31P brain spectra from individual tissue types obtained at B0 = 7T illustrate clear differences not only between healthy and tumor tissues, but also between different compartments within diseased tissue, i.e. contrast-enhanced regions and edema.
Introduction
Phosphorus magnetic resonance spectroscopic imaging (31P MRSI) enables the noninvasive investigation of energy and phospholipid metabolism in living tissues, and is of interest for studies of brain tumors. The low sensitivity of 31P MRSI translates to low spatial resolutions, so that localized 31P spectra represent rather a weighted mixture of specific 31P profiles from different tissue types, than a unique spectral signature at that spatial position. Recently, we implemented a high-resolution 31P MRSI protocol1 for examinations of the human brain at 7T with effective voxel sizes of about 6 ml, enabling a proper separation between gray and white matter, and also between the compartments of gliomas. Application of this protocol to volunteers and glioma patients yields a possibility to approach tissue-specific 31P profiles, which could aid interpretation of observations from 31P MRSI.The purpose of this study was to obtain high-quality 31P spectra of individual brain tissue types from volunteers and glioma patients, in order to identify differences between their 31P spectral profiles being detectable at B0 = 7T.
Methods
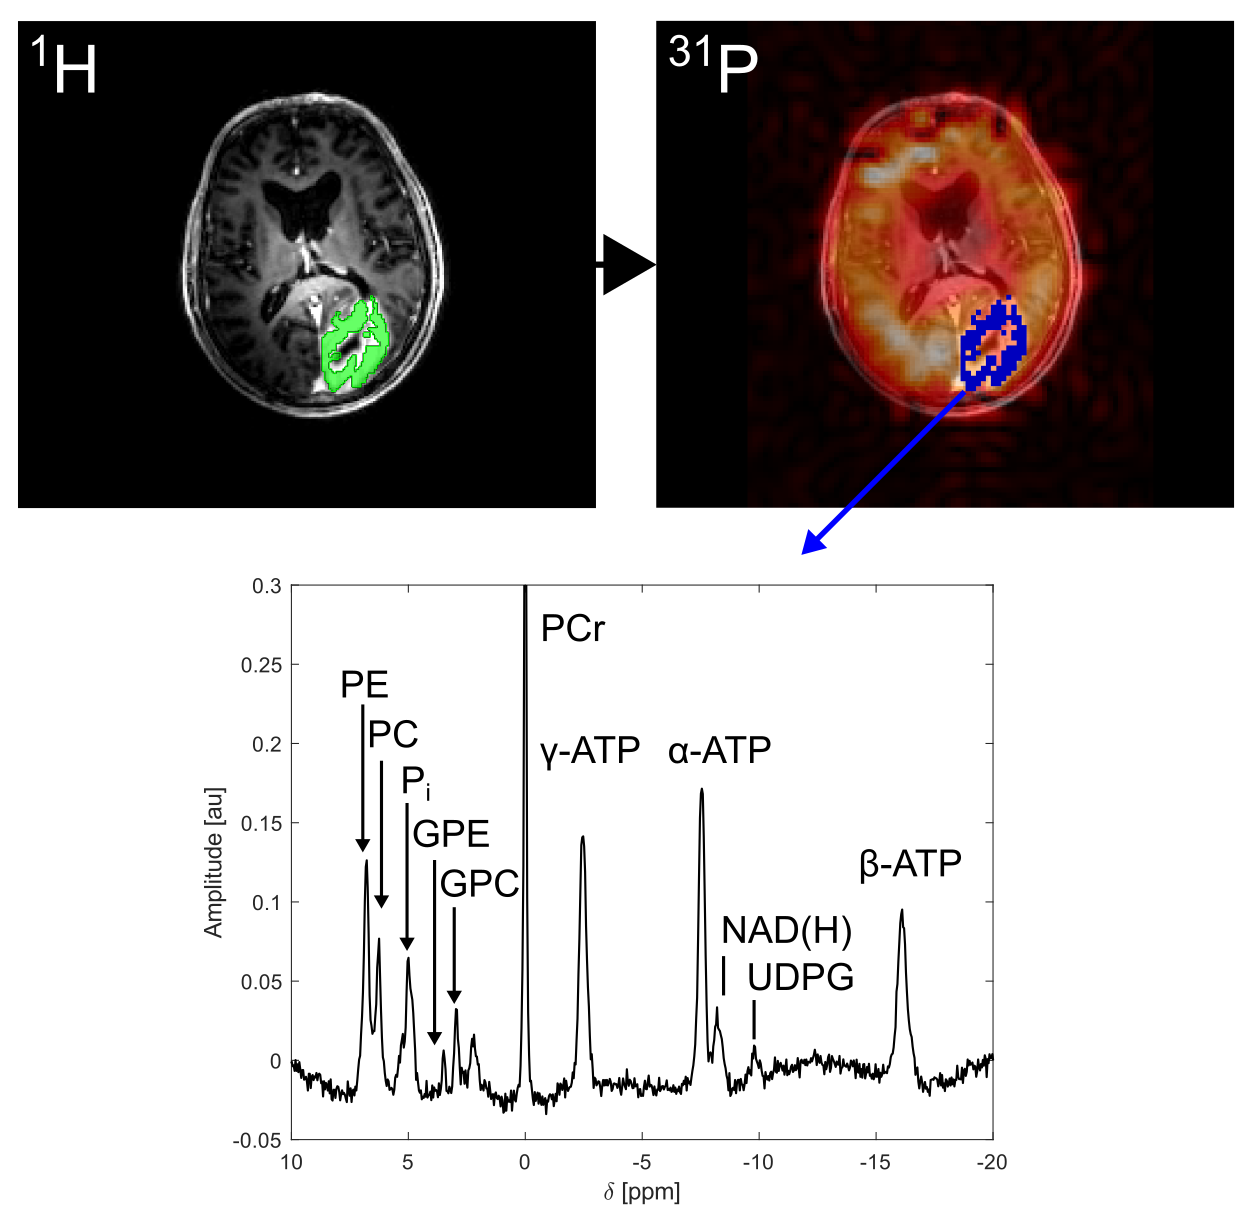
3 healthy volunteers (2m/1f, 25-35y) and 9 patients with glioma (5m/4f, 2x WHO II, 1x WHO III, 6x WHO IV, 23-80y) were examined on a 7-T whole-body MR system (Siemens) with a double-resonant 31P-1H head coil with 32 31P-receiver channels (RAPID Biomedical). The examination protocol consisted of high-resolution 31P MRSI (matrix = 20×24×16; nominal isotropic resolution of (1.25 cm)3; TR = 250 ms; α = 20°; Δf = 5000 Hz; Hamming-weighted k-space averaging; 31P-1H NOE-enhanced) with an acquisition duration of 51 minutes, and morphological 1H imaging as described in 1.Regions-of-Interest (ROI) were defined on 1H images using MITK2. In volunteers, ROIs were defined for white matter (WM) on both hemispheres, and for a region covering occipital gray matter (GM). In patients, ROIs were defined for contralateral WM, and regions showing Gd-contrast enhancement (GDCE), necrosis (NEC), and edema (ED), based on additional 3-T 1H images obtained in clinical examinations.
Coil-combined 31P MRSI datasets were processed only by spatial zerofilling to fourfold matrix size, in order to closer match the matrix size of the 1H images. The original ROIs were mapped onto the interpolated 31P MRSI grid using a linear interpolation algorithm in MITK (Figure 1). Within each of the resulting low-resolution ROIs, spectra were corrected for zero-order phases and B0-related frequency offsets utilizing a home-built Matlab (The Mathworks) implementation of AMARES3. The aligned spectra were summed up, yielding one ROI-averaged 31P spectrum.
Results
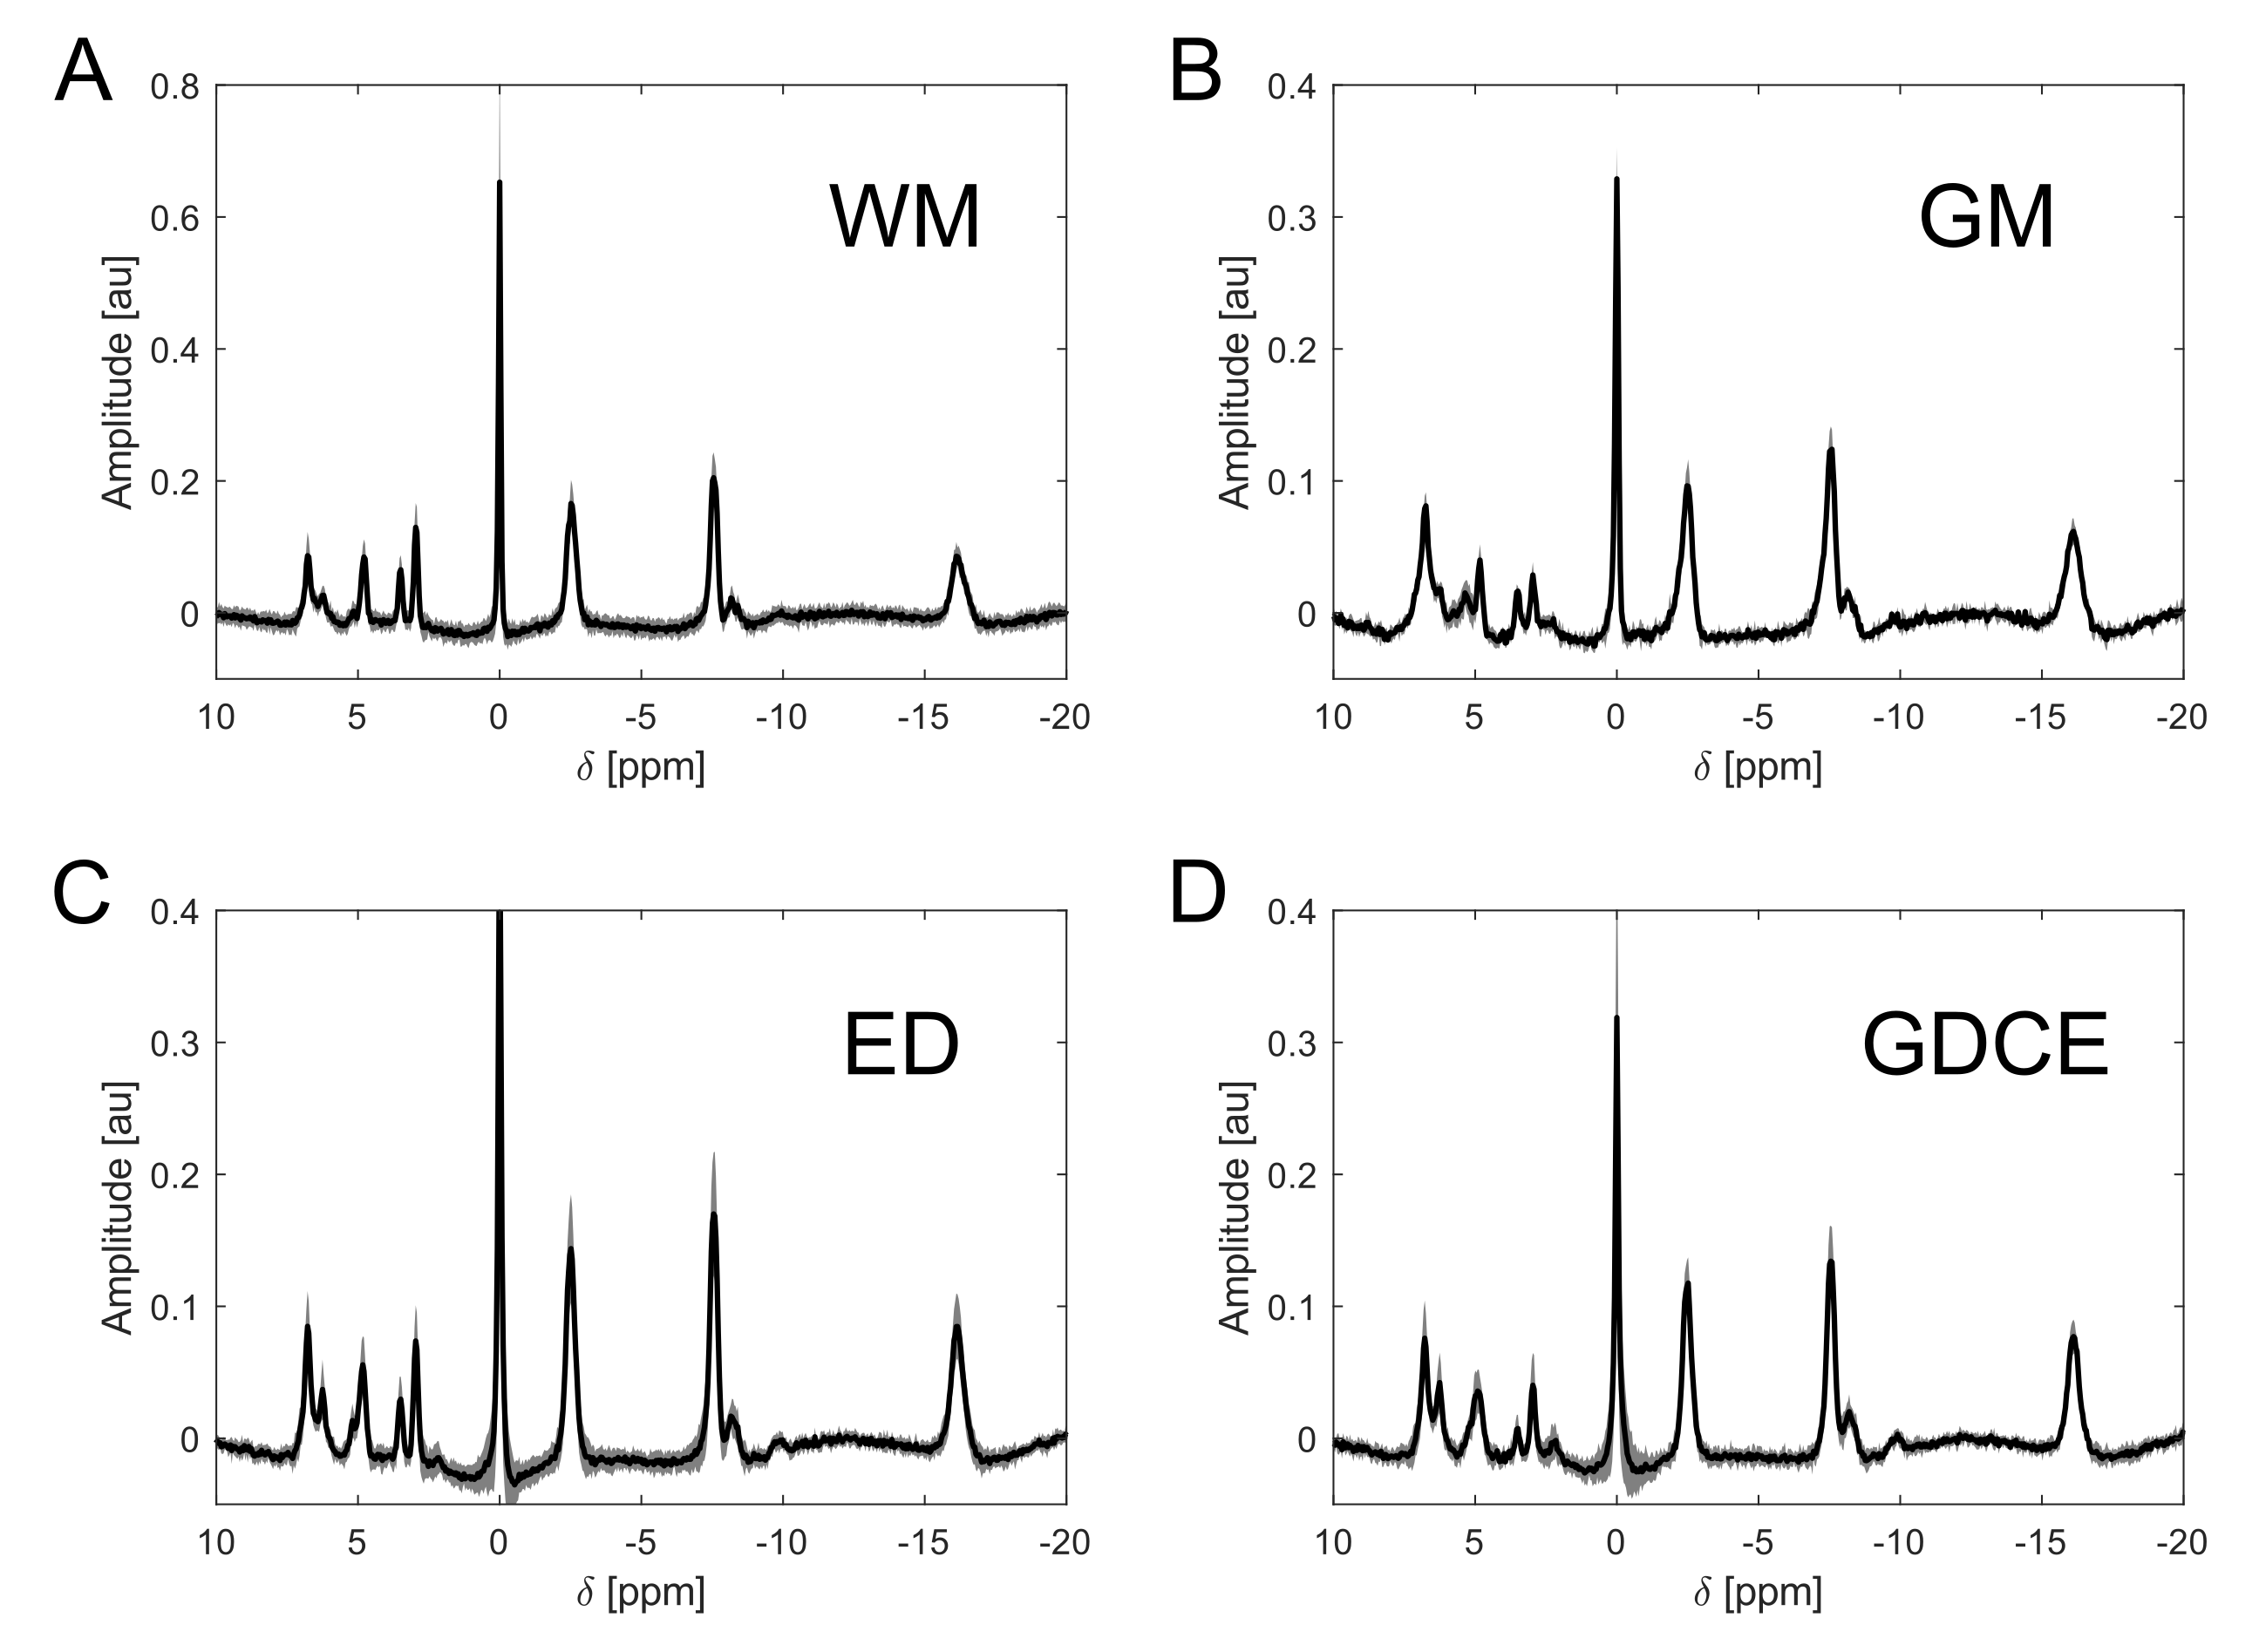
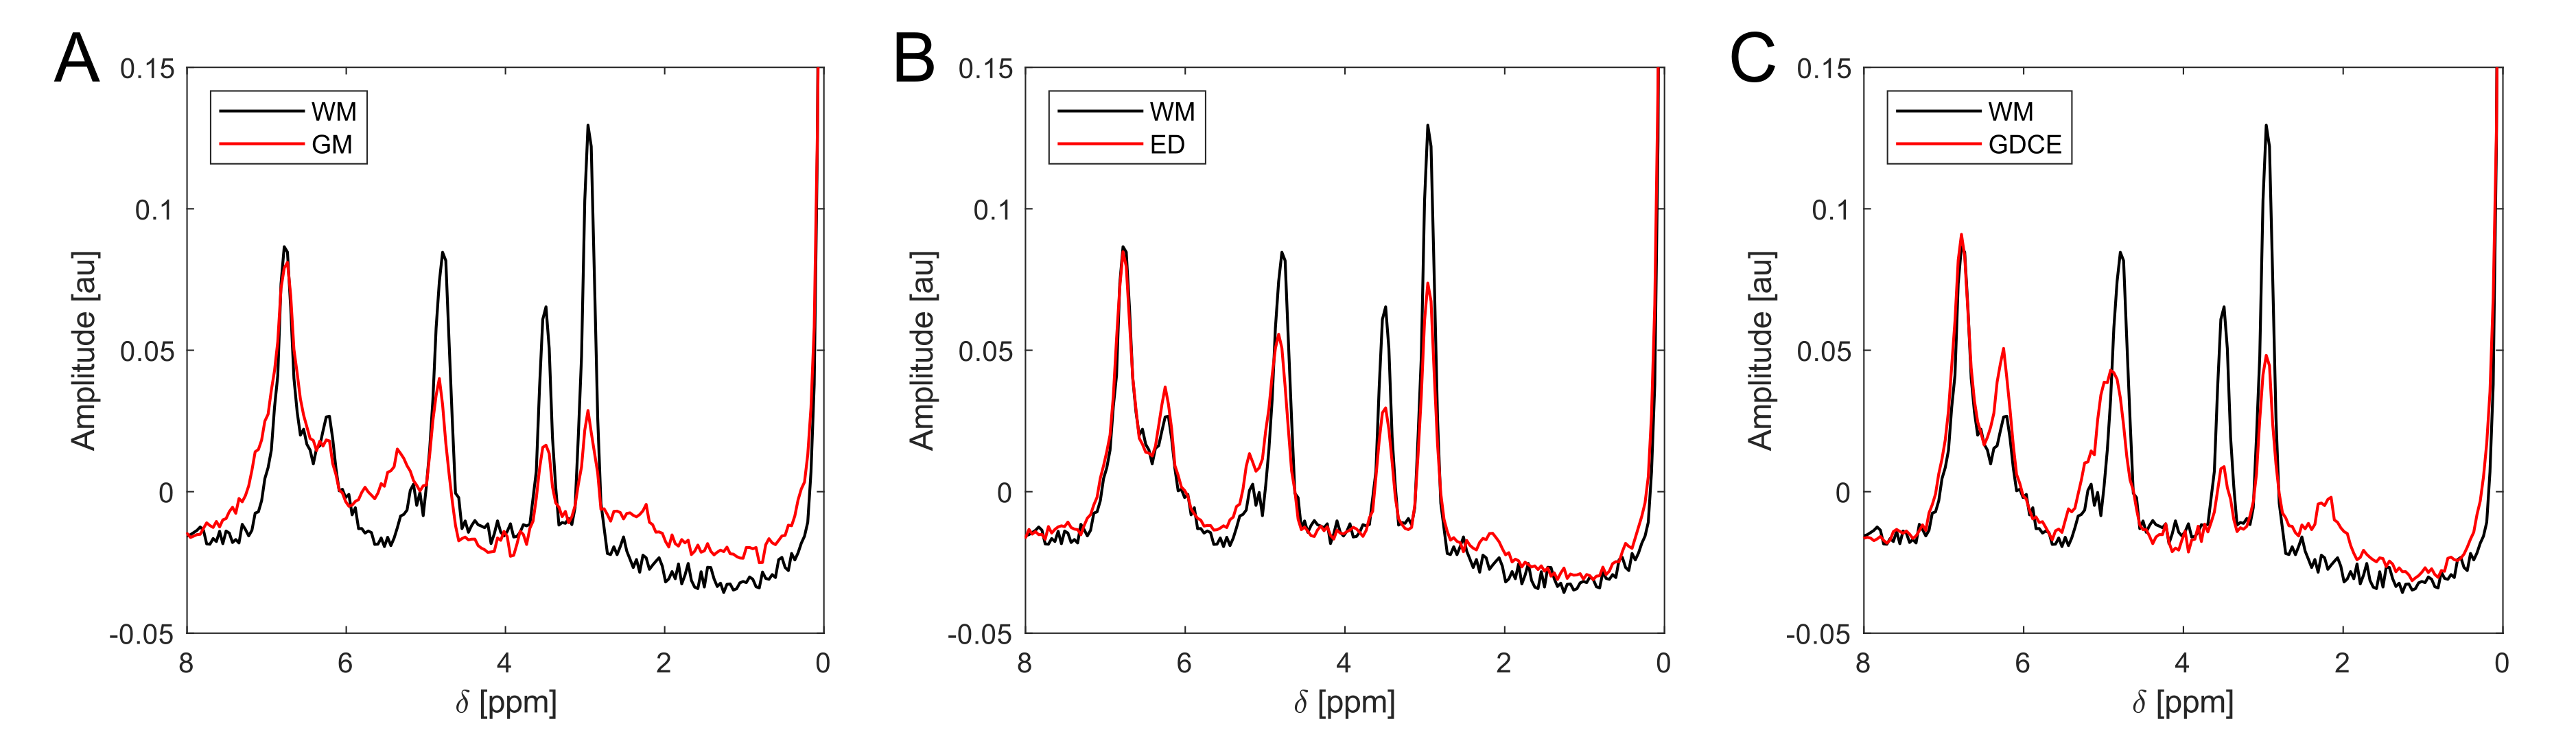
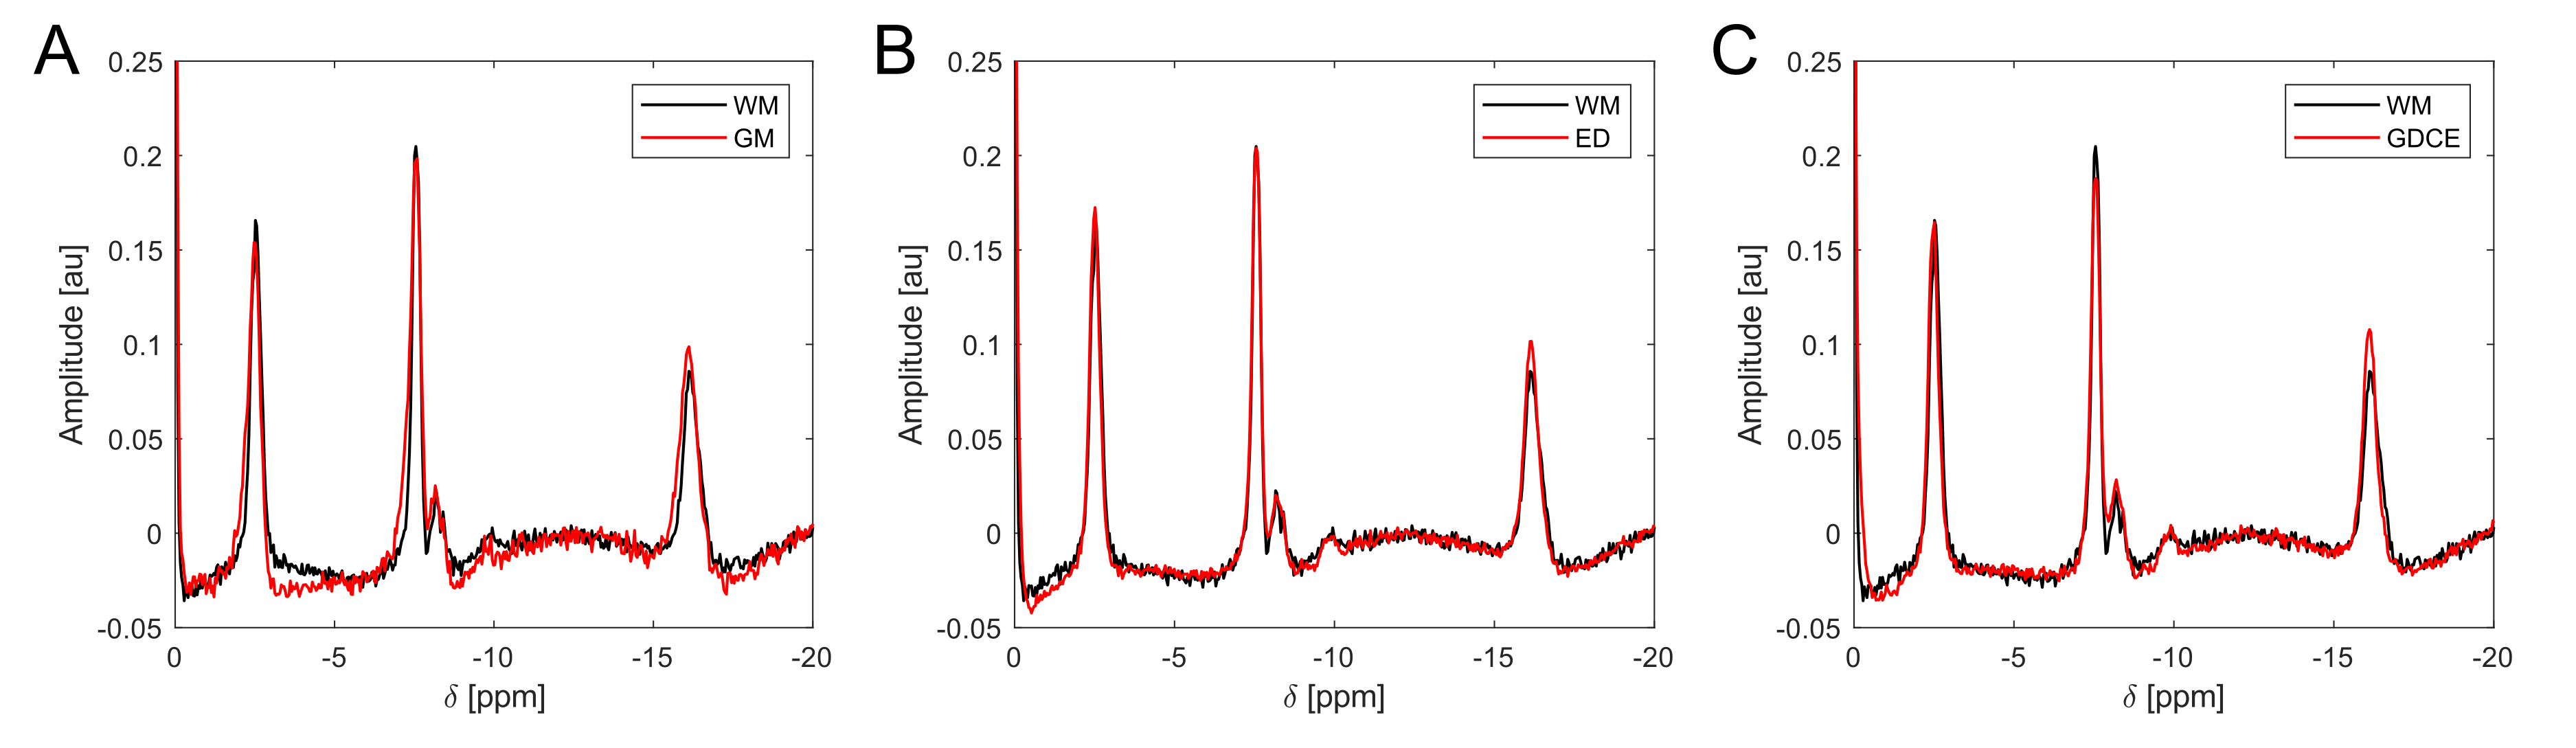
ROI-averaged 31P spectra of high quality were obtained in each ROI of every subject (Figure 1). When a specified ROI was compared between subjects, often the spectra differed in amplitudes, but not in frequencies and linewidths of the individual resonances. This was observed for GM, for WM in both volunteers and all patients, and for ED in all patients, leading to a highly coherent summation of signals when averaged across all subjects (Figure 2A-C). Noticeable signal variations across individual patients were only observed in the spectra of GDCE, but coherent summation was still possible (Figure 2D). NEC spectra closely resemble the GDCE spectra in each high-grade glioma patient, but with lower signal intensities due to the fewer number of summed voxels (not shown).The subject-averaged spectra of individual ROIs clearly deviate from each other. In the region downfield from PCr, strong changes in relative intensities for phosphomonoesters and phosphodiesters, as well as for the individual Pi resonances can be observed (Figure 3). Additionally, a broad resonance around 2.2 ppm becomes most prominent in the GDCE spectrum (Figure 3C). Interestingly, the intra- and extracellular Pi resonances remain well separated in ED (Figure 3B), in contrast to GDCE where a strong pH heterogeneity may be suggested. In the region upfield from PCr, subtle changes are observable between individual ROIs, e.g. frequency-specific intensity changes of NAD(H) and UDPG (Figure 4).
Discussion
In this study, no temporal filters or denoising techniques were applied to the MRSI data, in order to preserve the features of local 31P spectra, i.e. raw frequencies and linewidths. Nevertheless, high signal-to-noise could be obtained in the final profiles by summation of phase-/frequency-aligned spectra within individual ROIs (corresponding to 1-10 voxels from the original MRSI matrix), and subsequent coherent summation of ROI-averaged spectra across all subjects (3-16 ROIs for each tissue).Although partial volume effects cannot be completely excluded because of the still limited spatial resolution, the obtained 31P profiles are strongly weighted by the assigned tissue type and clearly differ from each other. Particularly, GDCE and ED were usually well separated in space. Although a certain variation in signal intensities, e.g. due to variations in B1, may be expected, the high coherence in frequencies and linewidths across ROI-averaged spectra of different subjects hints towards approaching tissue-specific 31P profiles.
Conclusion
The presented high-quality 31P brain spectra from individual tissue types obtained at B0 = 7T illustrate clear differences not only between healthy and tumor tissues, but also between different compartments within diseased tissue, i.e. contrast-enhanced regions and edema. These 31P profiles may improve our understanding of metabolic differences observed in healthy and tumorous brain tissue, and guide the development of new models for prior-knowledge based quantification or reconstruction.Acknowledgements
No acknowledgement found.References
1. Korzowski A, Weinfurtner N, Mueller S, et al. Volumetric mapping of intra‐ and extracellular pH in the human brain using 31P MRSI at 7T. Magn Reson Med. 2020; 84: 1707– 1723. https://doi.org/10.1002/mrm.28255
2. Nolden M, Zelzer S, Seitel A, et al. The medical imaging interaction toolkit: Challenges and advances: 10 years of open-source development. Int J Comput Assist Radiol Surg. 2013;8(4):607-620. doi:10.1007/s11548-013-0840-8
3. Vanhamme L, Van Huffel S. AMARES: Advanced Method for Accurate, Robust and Efficient Spectral fitting of MRS data with use of prior knowledge. J Magn Reson. 1997;43(129):1-2. http://www.esat.kuleuven.be/sista/yearreport96/node2.html
Figures