0954
Correlations of Single Voxel 1H-MRS Findings with Tumor Biology in Meningiomas.1Institute of Biomedical Engineering, Bogazici University, Istanbul, Turkey, 2Department of Medical Pathology, Acibadem Mehmet Ali Aydinlar University, Istanbul, Turkey, 3Center for Neuroradiological Applications and Reseach, Acıbadem Mehmet Ali Aydinlar University, Istanbul, Turkey, 4Department of Neurosurgery, Acibadem Mehmet Ali Aydinlar University, Istanbul, Turkey, 5Health Institutes of Turkey, Istanbul, Turkey, 6Department of Medical Engineering, Acibadem Mehmet Ali Aydinlar University, Istanbul, Turkey, 7Department of Molecular Biology and Genetics, Acibadem Mehmet Ali Aydinlar University, Istanbul, Turkey, 8Department of Radiology, Acibadem Mehmet Ali Aydinlar University, Istanbul, Turkey
Synopsis
Meningiomas are a heterogeneous group of tumors that arise at the pachymeninges and tend to invade surrounding bone and rarely the brain. In this work, we studied the single-voxel 1H-MRS correlates of aggressive biology (measured by WHO grade), peritumoral edema, brain invasion, bone invasion, skull base location in meningiomas. Higher Glyc and Ins+Glyc levels were observed in aggressive (WHO grade II or III) meningiomas. Higher Glu, GPC, and Glx levels were observed in hyperostotic tumors. The classification accuracies were 81.28% for tumor grade, 73.18% for hyperostosis detection, and 76.88% for skull base localization of meningiomas.
Introduction
Meningiomas are the most common primary brain tumors in adult patients. They are a diverse group of tumors that arise at pachymeninges and exhibit significant variation in tumor biology, treatment response, and clinical behavior. The current standard to evaluate the aggressiveness of meningiomas is the World Health Organization (WHO) grading scheme. WHO grade I (typical) tumors have more benign biology as opposed to more aggressive WHO grade II (atypical) and WHO grade III (anaplastic) meningiomas [1]. Since atypical and malignant meningiomas have shorter progression-free survival and worse treatment response, tumor grading plays a significant role in the prognosis and treatment plan of meningiomas [2, 3]. Additionally, meningiomas also have a propensity to invade the surrounding dura and bone, cause peri-tumoral brain edema, and in some cases even invade the surrounding brain tissue [4]. A non-invasive method to reliably predict tumor biology can be a valuable adjunct to meningioma management. This study aims to look at correlates of single-voxel proton magnetic resonance spectroscopic (1H-MRS) findings and several features of meningiomas including aggressive behavior, bone invasion, peritumoral edema, skull base location, and brain invasion.Methods
Forty-nine surgically treated meningioma patients (15M/34F, mean age: 51.92±13.80 years, range: 18-80 years, 17 WHO grade I meningiomas, 32 higher-grade (29 WHO grade II and 3 WHO grade III)) were included in this study. Five parameters of tumor biology used for correlation were tumor WHO grade, skull base location, presence of associated bone hyperostosis, peritumoral brain edema (as assessed on T2w MRI), and brain invasion (as assessed by pathological examination). The patients were scanned before surgery at a 3T MR scanner (Erlangen, Germany) using a 32-channel head coil. 1H-MRS data was acquired from the volume of interest manually placed in the solid tumor region excluding necrosis or hemorrhage using a Point Resolved Spectroscopy (PRESS) sequence (TR/TE=2000/30 ms, voxel size=1-8 cm3). LCModel spectral fitting program [5] was used for quantification of MRS peak concentrations of main metabolites, lipids, and macromolecules. The metabolites with a Cramer-Rao lower bound (CRLB) of more than 30% were excluded from the study. A Mann-Whitney U test was used to assess metabolic differences between the meningiomas grouped based on pathological grades, bone invasion, peritumoral edema, and brain invasion. Most informative metabolites were selected using well-known feature selection methods. Machine-learning algorithms were employed to classify meningiomas based on their grades, skull base location, and the presence of hyperostosis using selected features. Adaptive synthetic (ADASYN)[6] oversampling method was also used for handling the class imbalance problem in all classifications. Five-fold cross-validation was used, and the models were executed 100 times to report the mean performance measures.Results
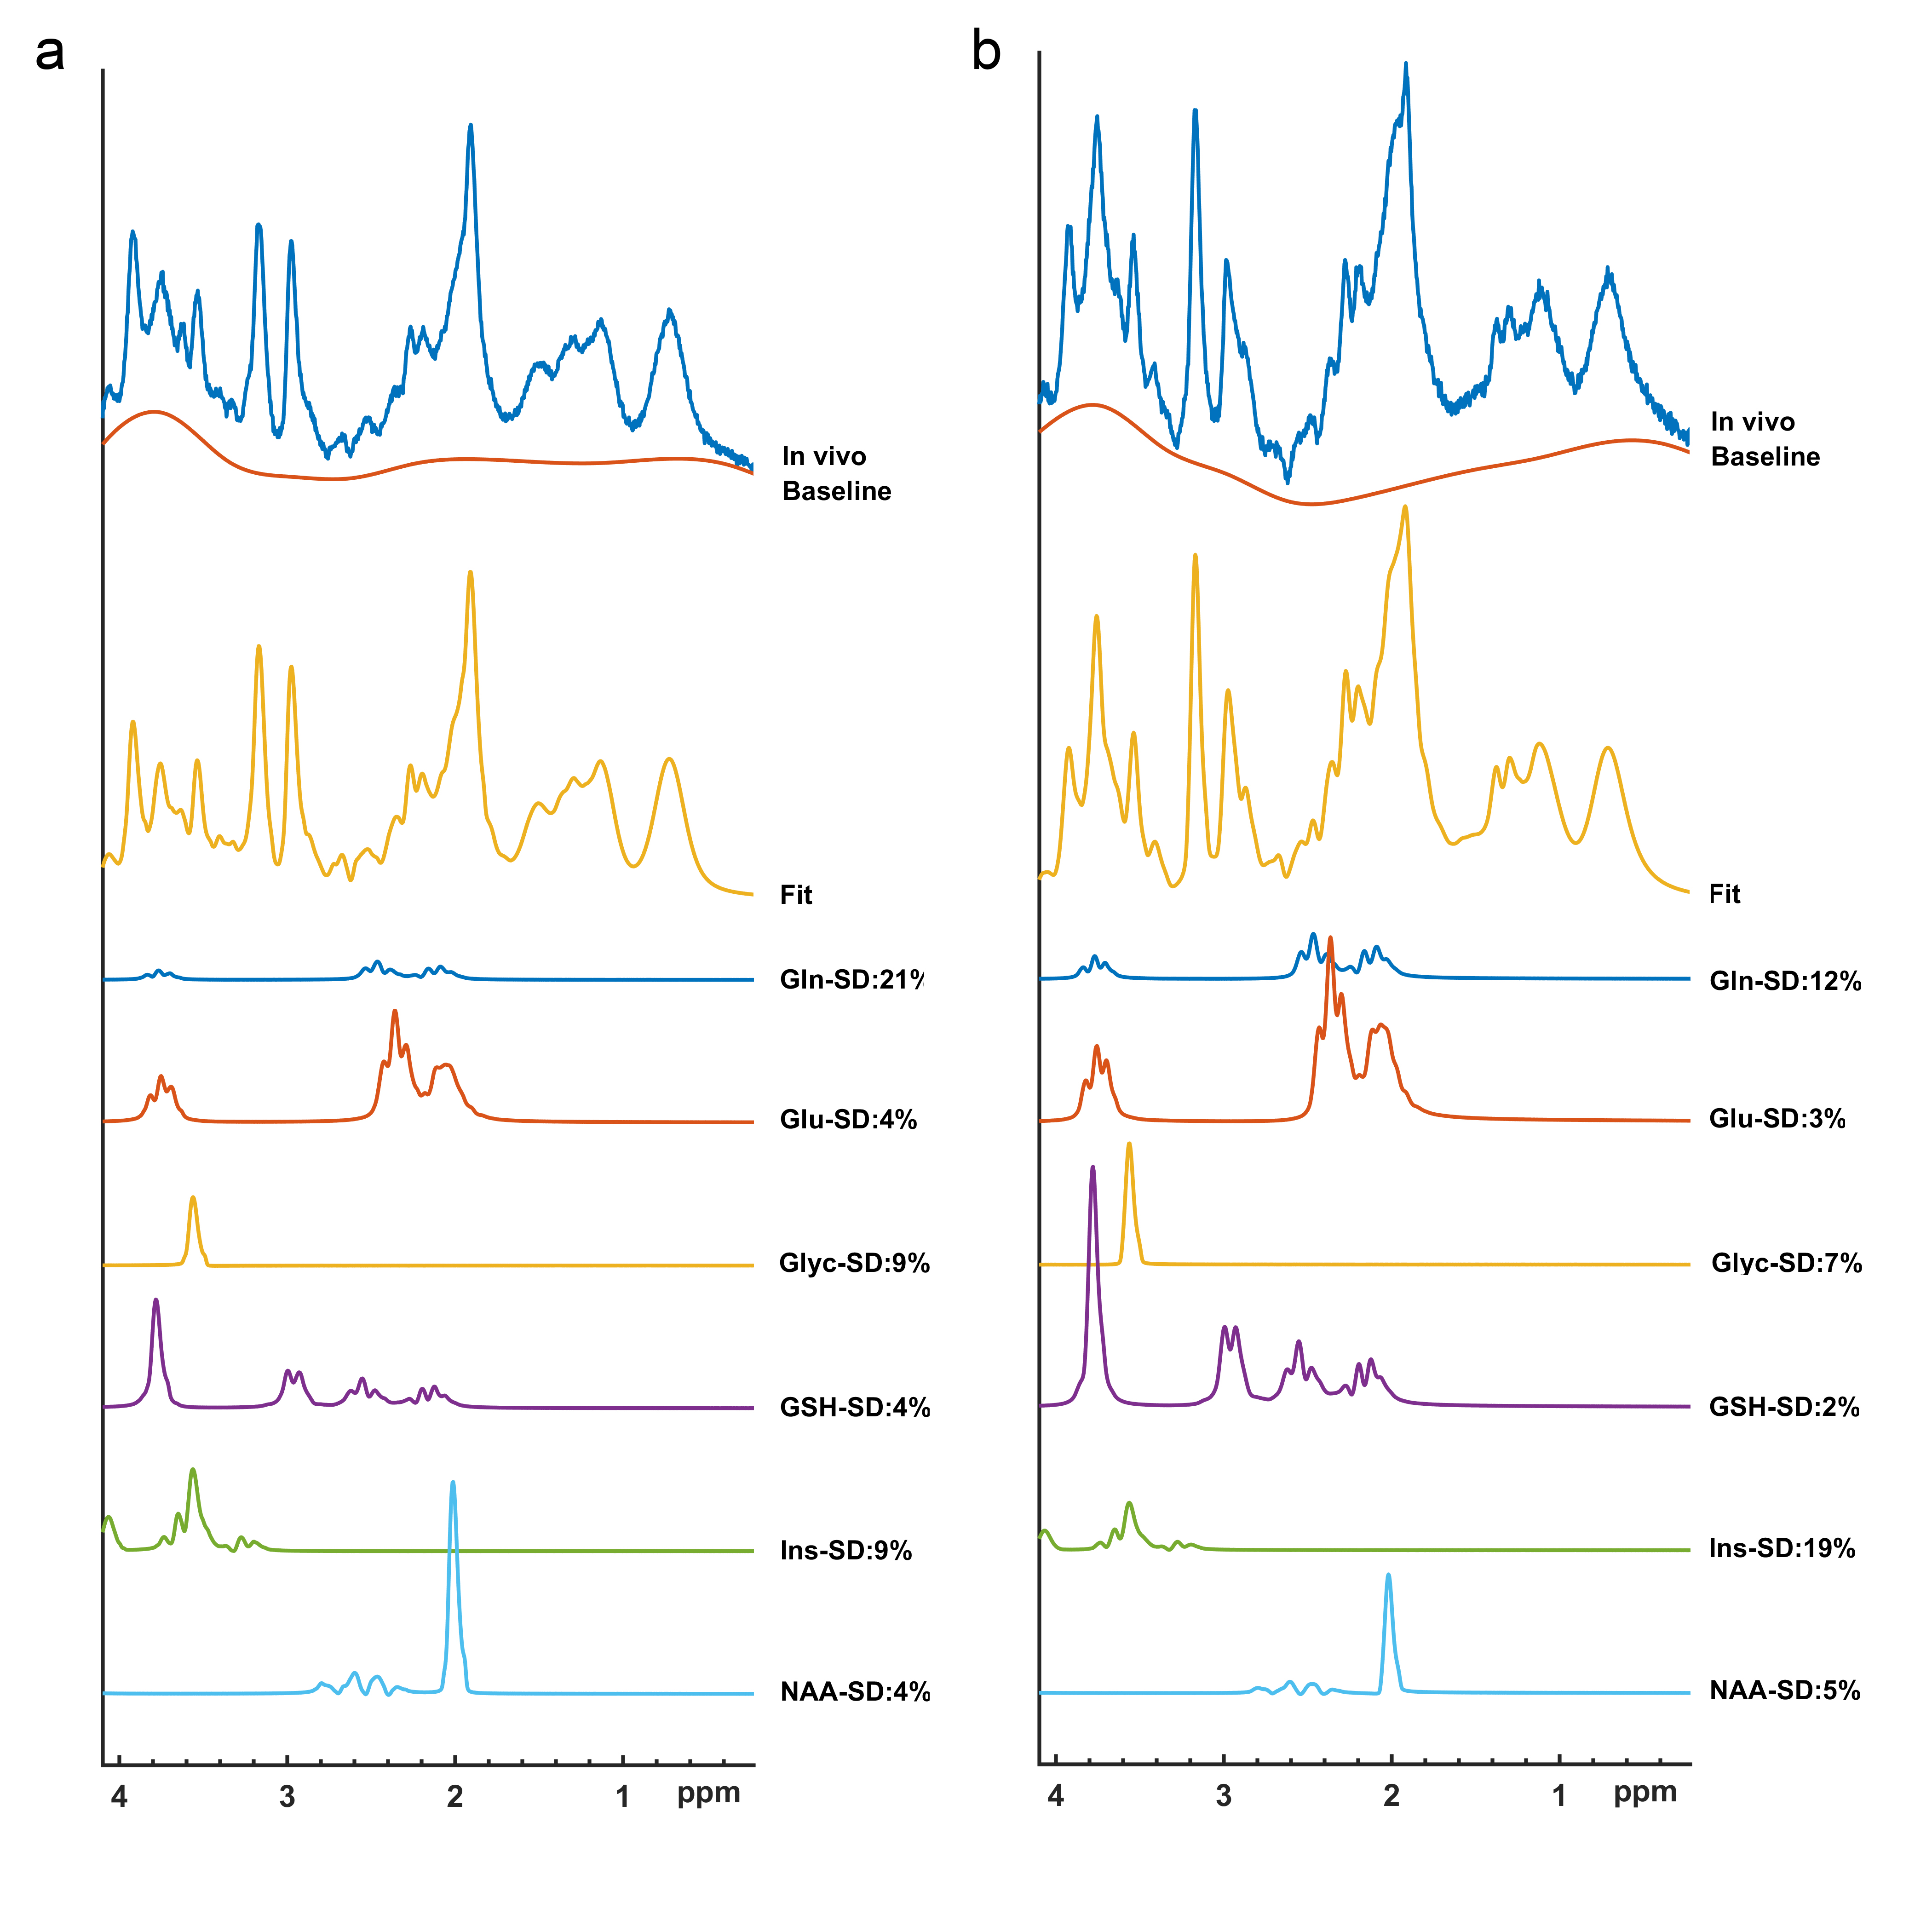
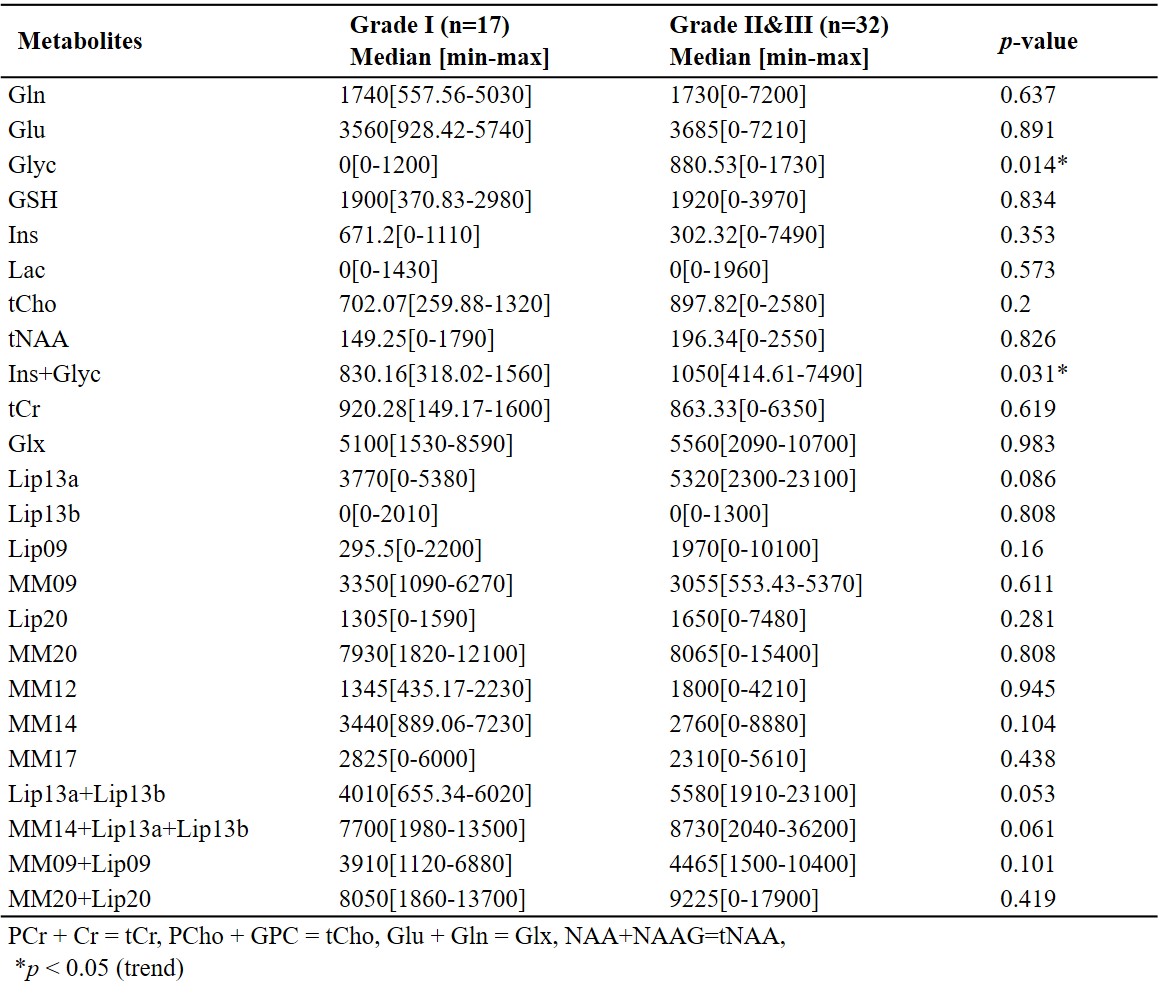
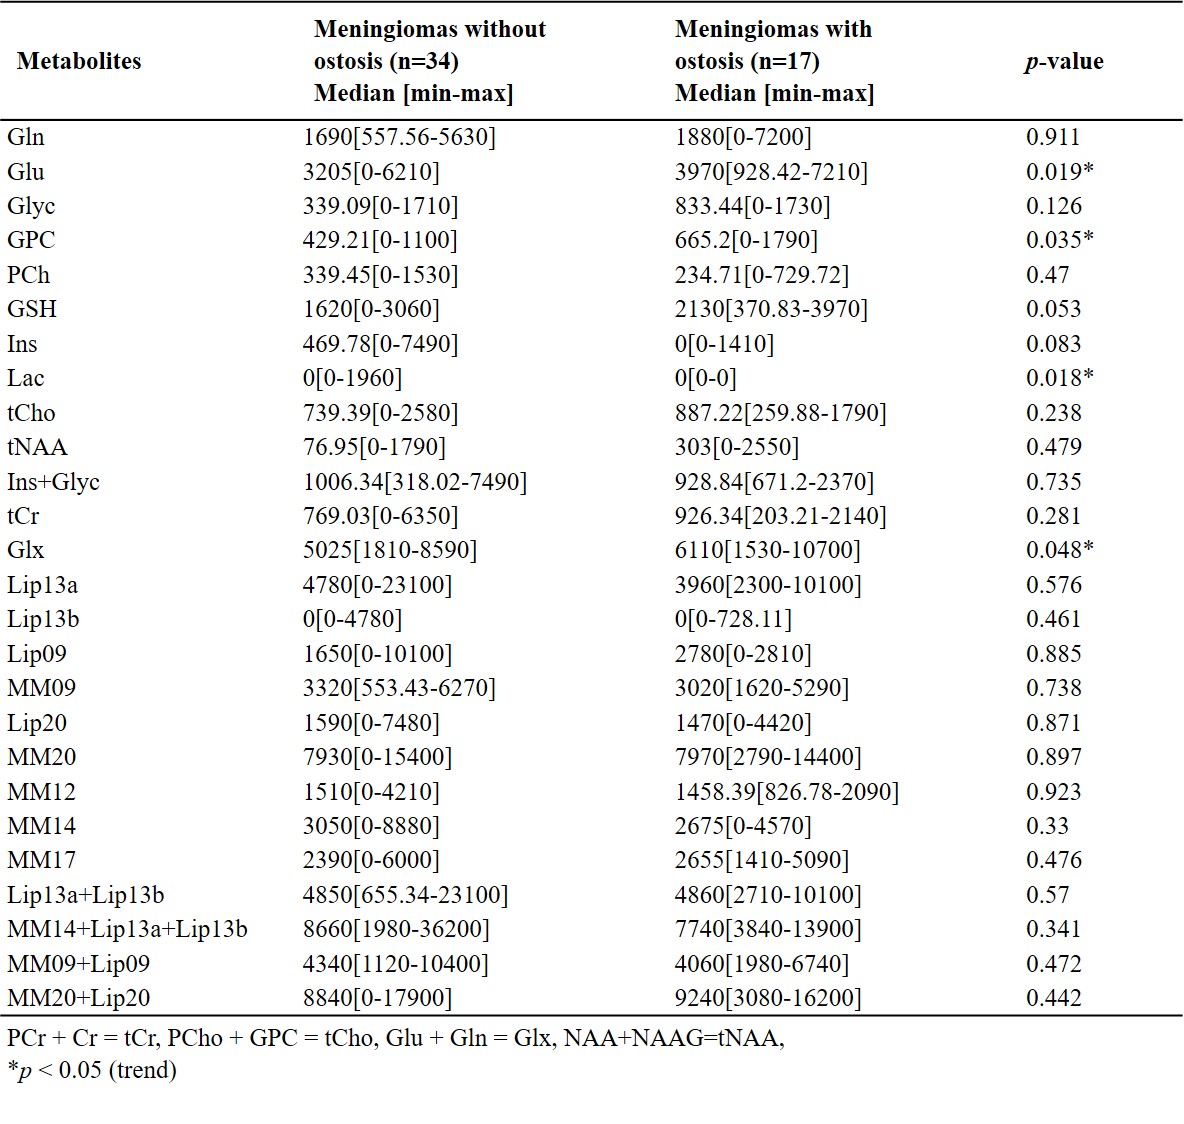
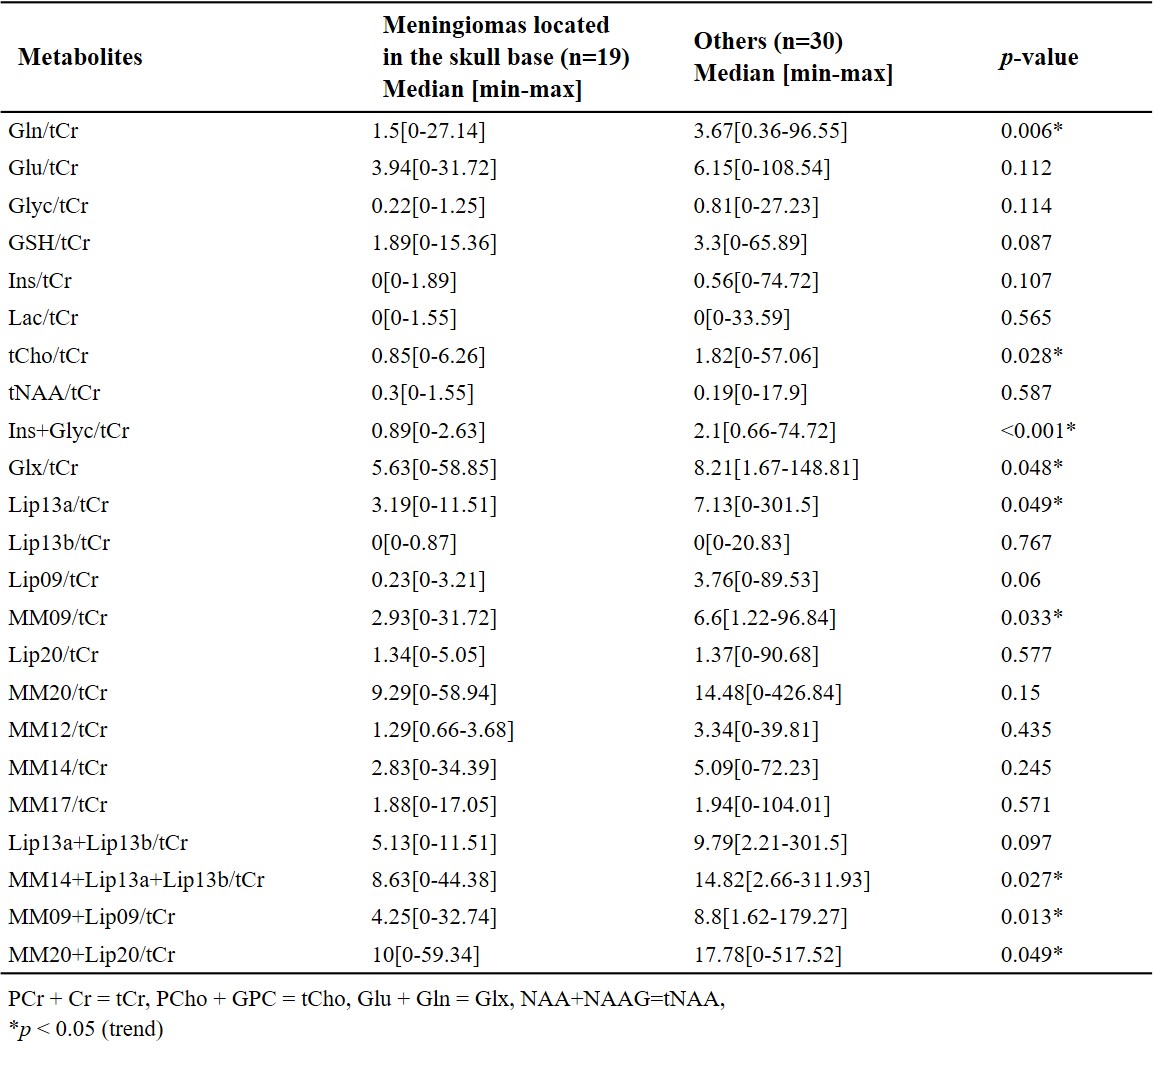
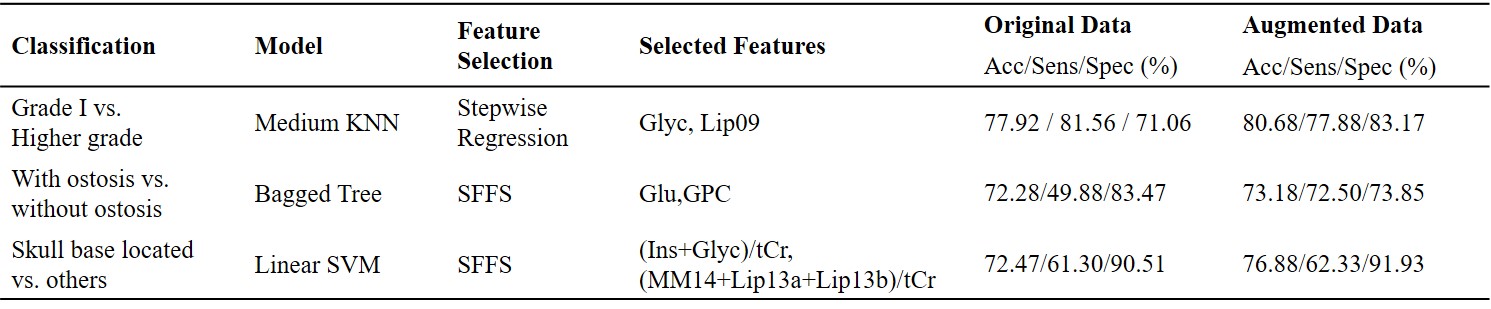
Figures 1 shows short-TE PRESS 1H-MRS data along with some of the LCModel quantification results of a grade I (a) and a grade II (b) meningiomas. While higher Ins and NAA were observable in grade I meningioma, higher Glu, Glyc, and GSH were prominent in grade II meningioma. The median and range of metabolite concentrations and the p-values of their comparison between the meningiomas grouped by tumor grade, skull base location, and the presence of hyperostosis are shown in Table 1, 2, 3, respectively. Higher grade meningioma patients had higher Glyc (p=0.014) and Ins+Glyc (p=0.031) than grade I meningiomas. Higher Glu (p=0.019), GPC (p=0.035), Lac (p=0.018) and Glx (p=0.048) were observed in meningiomas showing hyperostosis. The tumors having a skull base location had lower Gln/tCr (p=0.006), tCho/tCr (p=0.028), (Ins+Glyc)/tCr (p<0.001), Lip13a/tCr (p=0.049), MM09/tCr (p=0.033), (MM14+Lip13a+Lip13b)/tCr (p=0.027), (MM09+Lip09)/tCr (p=0.013), and (MM20+Lip20)/tCr (p=0.049). Table 4 shows sensitivity, specificity, and accuracy results along with the classification algorithm, feature selection method, and selected metabolites for the classifications of grade, hyperostosis, and location. In meningiomas grading, a weighted KNN model achieved the highest accuracy of 77.38% using Glyc and Lipid 13a+Lipid 13b. For hyperostosis detection, the sequential forward feature selection method selected Glu and GPC as the most informative biomarkers, and an accuracy of 72.28% was obtained using the bagged tree model. Linear SVM model gave an accuracy of 72.47% using (Ins+Glyc)/tCr and (MM14+Lip13a+Lip13b)/tCr ratios to detect skull base location. Oversampling with ADASYN improved the performance for all classifications.Discussion and Conclusion
Despite the limited number of patients, the current study detected significant metabolic correlates of tumor biology in meningiomas. Higher-grade meningiomas had significantly higher Glyc and Ins+Glyc measures. Glyc was also useful along with Lip13a+Lip13b to preoperatively determine the pathological grade using machine learning algorithms. Serine is an essential precursor for protein, nucleic acid, and lipid synthesis and has a proven role in supporting rapid cellular proliferation and may be a metabolic marker for fast growth in meningiomas [7] serine with Glyc was demonstrated to promote sustained angiogenesis in meningiomas [8]. Using the current cohort, we did not find any correlates for peritumoral edema or brain invasion. Meningiomas showing hyperostosis had higher Glu, GPC, and Glx and these metabolites were also informative for detection of the hyperostosis in meningiomas. The ratios of Gln, tCho, and (Ins+Glyc) to tCr were lower in tumors located at the skull base, which are more benign. Further analysis using larger cohorts is currently being conducted.Acknowledgements
This study has been supported by the Scientific and Technological Research Council of Turkey (TUBITAK) grant 119S520.References
1. Louis, D.N., et al., The 2016 World Health Organization Classification of Tumors of the Central Nervous System: a summary. Acta Neuropathologica, 2016. 131(6): p. 803-820.
2. Nowak, A., et al., Benign versus atypical meningiomas: Risk factors predicting recurrence. Neurologia Neurochirurgia Polska, 2015. 49(1): p. 1-10.
3. Zhao, P., et al., Prognostic factors for patients with atypical or malignant meningiomas treated at a single center. Neurosurgical Review, 2015. 38(1): p. 101-107.
4. Alzhrani, G. and W. Couldwell, Bony Hyperostosis Recurrence after Complete Resection of Sphenoorbital Meningioma. Cureus, 2017. 9(8): p. e1540-e1540.
5. Provencher, S.W., Automatic quantitation of localized in vivo 1H spectra with LCModel. NMR Biomed, 2001. 14(4): p. 260-4.
6. Haibo, H., et al. ADASYN: Adaptive synthetic sampling approach for imbalanced learning. in 2008 IEEE International Joint Conference on Neural Networks (IEEE World Congress on Computational Intelligence). 2008.
7. Jain, M., et al., Metabolite profiling identifies a key role for glycine in rapid cancer cell proliferation. Science, 2012. 336(6084): p. 1040-4.
8. Monleon, D., et al., Metabolic aggressiveness in benign meningiomas with chromosomal instabilities. Cancer Res, 2010. 70(21): p. 8426-34.
Figures