0952
The Effect of Cramer-Rao Lower Bound Thresholds on Classification of IDH and TERTp Mutation Status in Gliomas using 1H-MRS1Institute of Biomedical Engineering, Bogazici University, İstanbul, Turkey, 2Department of Medical Pathology, Acibadem Mehmet Ali Aydinlar University, Istanbul, Turkey, 3Center for Neuroradiological Applications and Reseach, Acibadem Mehmet Ali Aydinlar University, Istanbul, Turkey, 4Department of Molecular Biology and Genetics, Acibadem Mehmet Ali Aydinlar University, Istanbul, Turkey, 5Department of Neurosurgery, Acibadem Mehmet Ali Aydinlar University, Istanbul, Turkey, 6Department of Radiology, Acıbadem Mehmet Ali Aydinlar University, Istanbul, Turkey
Synopsis
Cramer-Rao lower bound (CRLB) is commonly employed as an exclusion criterion for bad quality MR spectra. This study aims to investigate the CRLB differences of the metabolites between isocitrate dehydrogenase (IDH) and telomerase reverse transcriptase promoter (TERTp) mutational subgroups in gliomas, and to assess the effects of CRLB threshold on their classifications. GPC, PCh, 2HG, and Ins were more reliably detected in IDH-mutant gliomas. Ins had higher CRLB values in TERTp-mutant than TERTp-wildtype gliomas. Different CRLB thresholds followed by zero-imputing had a small impact on the classification accuracies, but affected the choice of best features and classification algorithms.
Introduction
Isocitrate dehydrogenase (IDH) and telomerase reverse transcriptase promoter (TERTp) mutations cause different treatment response and survival rates in gliomas [1-3]. While IDH mutant gliomas (IDH-mut) have a better overall response, IDH wildtype TERTp mutant gliomas (TERTp-only) have been reported to have the worst overall survival [1]. Proton magnetic resonance spectroscopy (1H-MRS) has been utilized to predict IDH and TERTp mutations in gliomas [4-7]. Cramer Rao Lower Bound (CRLB), a measurement of the quality of metabolite concentration estimation, is commonly applied for indicating uncertainties in the quantification of metabolic markers [8, 9]. Although CRLB is commonly employed as an exclusion criterion for bad quality spectra, there is no certain threshold that is agreed upon. Additionally, CRLB values might differ between mutational subgroups of gliomas. This study aims to investigate CRLB differences between IDH and TERTp mutational subgroups in gliomas, and assess the effects of the CRLB threshold on the classification accuracy of mutational subgroups.Methods
110 glioma patients (65M/45F, mean age: 41.88 ±13.92 years, range: 20-74 years) were included in this study. The patients were scanned before surgery at a 3T Siemens Prisma scanner (Erlangen, Germany) using a 32-channel head coil. The brain tumor protocol included pre-and post-contrast (gadolinium DTPA) T1-weighted TSE (TR=500 ms, TE=10 ms), T2-weighted TSE (TR=5000 ms, TE=105 ms), and T2*-weighted gradient-echo echo-planar imaging (EPI) dynamic susceptibility contrast (DSC) MRI (TR=1500 ms, TE=30 ms). 1H-MRS data were acquired from the solid tumor region excluding necrosis, edema, and hemorrhage using a Point Resolved Spectroscopy (PRESS) sequence (TR/TE=2000/30 ms, voxel size=1-8 cm3). MRS peak concentrations of the main metabolites were quantified using LCModel [10]. TERTp and IDH1 or IDH2 (IDH1/2) mutations in the tissue were determined by either minisequencing or Sanger sequencing. The CRLB value differences between different glioma mutational subgroups were assessed by a Mann Whitney U test. Bonferroni multiple comparison correction was also applied and p<0.002 was considered as statistically significant. To investigate the effects of CRLB on classification accuracy, we set up an experiment consisting of 17 machine learning methods and two dimensionality reduction methods. The machine learning methods were k-nearest neighbours (KNN) [11], support vector machines (SVM) [12], decision trees [13], and boosted methods [14]. Dimensionality reduction techniques, including feature selection with the least absolute shrinkage and selection operator (Lasso) [15] and stepwise regression [16], were applied before the machine-learning-based classifications. Synthetic data were generated using adaptive synthetic sampling (ADASYN) for imbalanced data groups [17]. The classifications were performed on metabolites based on different CRLB thresholds, which were 20, 30, 40, 70, and 990, and a metabolite with a CRLB value of more than the threshold was assigned as zero. In all the classifications, the models were executed 20 times, and the mean performance metrics were reported. All the computations were performed in Matlab 2020a (The MathWorks Inc., Natick, MA).Results
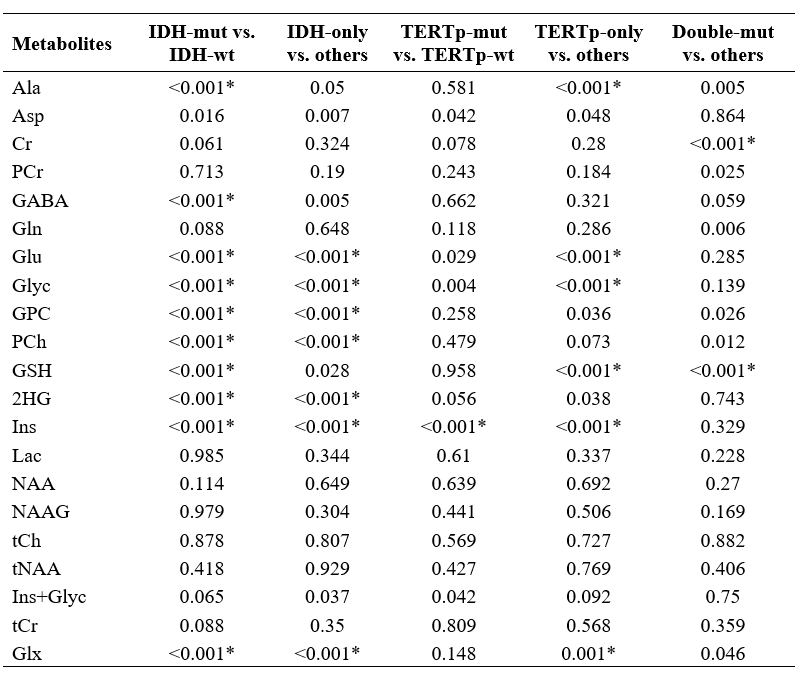
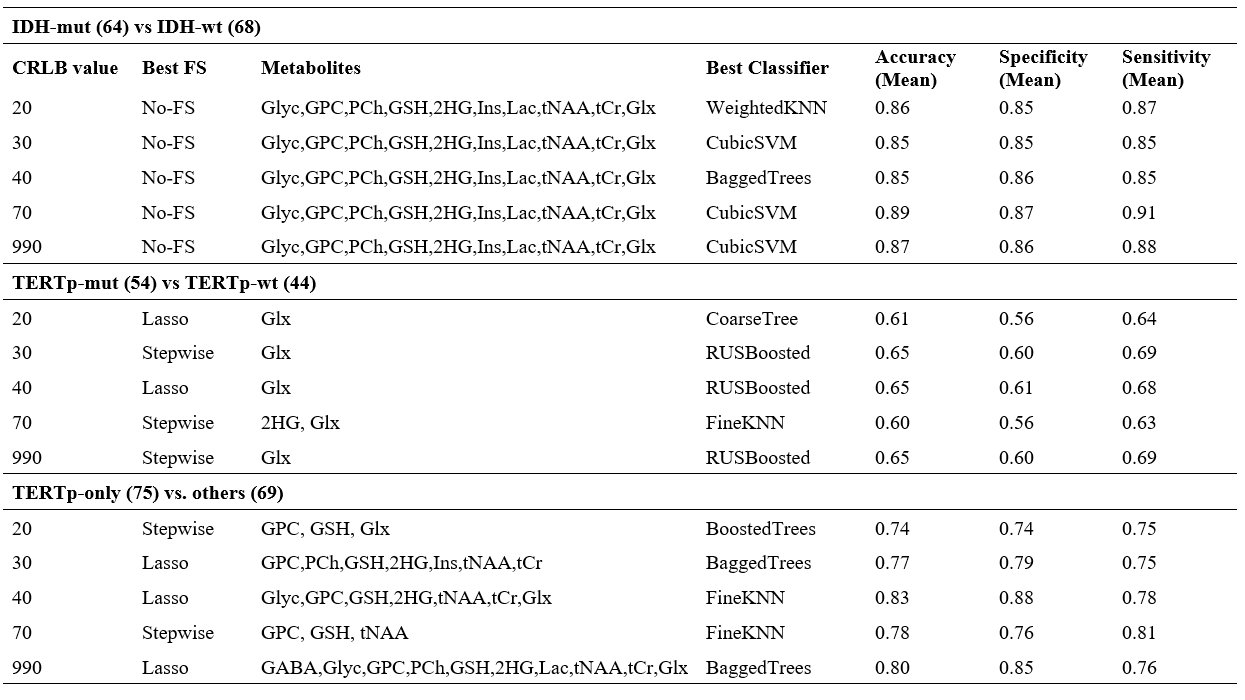
IDH-mut glioma patients had statistically significantly higher CRLB values, which means more uncertain estimations, for Ala (p<0.001), GABA (p<0.001), Glu (p<0.001), Glyc (p<0.001), PCh (p<0.001) and Glx (p<0.001), and lower CRLB values for GPC(p<0.001), GSH (p<0.001), 2HG (p<0.001) and Ins (p<0.001) than IDH-wt ones (Table 1). IDH-only glioma patients had statistically significant increased CRLB values for Glu (p<0.001), Glyc (p<0.001) and PCh (p<0.001), and decreased CRLB values for GPC (p<0.001), 2HG (p<0.001), Ins (p<0.001) and Glx (p<0.001). TERTp-mut glioma patients had statistically significantly higher CRLB values for Ins (p<0.001). TERTp-only glioma patients had statistically significantly higher CRLB values for GSH (p<0.001) and Ins (p<0.001), and lower CRLB values for Ala (p<0.001), Glu (p<0.001), Glyc (p<0.001) ad Glx (p<0.001). Double-mut glioma patients had statistically significantly higher CRLB values for GSH (p<0.001), and lower CRLB values for Cr (p<0.001). The classification results of the models for the detection of IDH and TERTp mutations based on different CRLB thresholds are shown in Table 2. In IDH-mut detection, applying a CRLB threshold of 70 resulted in the highest accuracy of 89% with a sensitivity of 87% and a specificity of 91%. Glx was selected as the most informative feature for all CRLB thresholds in TERTp-mut detection and CRLB thresholds of 30, 40, and 990 gave an accuracy of 65%. To detect TERTp-only gliomas, classification with the use of a CRLB threshold of 40 was the best with an accuracy of 83%, a sensitivity of 88%, and a specificity of 78%.Discussion and Conclusion
This study indicated that there might be a relation between the CRLB values of the metabolites and the IDH and TERTp mutational status in gliomas. More reliable detections of GPC, PCh, 2HG, and Ins were related with IDH mutation in gliomas. These metabolites have also been indicated as important biomarkers of IDH-mut gliomas [4]. Ins was the only metabolite with a statistically significantly different CRLB values between the TERTp mutation based subgroups of gliomas. This study also indicated that using different CRLB thresholds resulted in different set of best features and classification algorithms for the identification of IDH and TERTp based mutational status in gliomas, but the resultant accuracies were similar between the different schemes.Acknowledgements
This project was funded by TUBITAK 1003 project 216S432.References
1.Eckel-Passow, J.E., et al., Glioma Groups Based on 1p/19q, IDH, and TERT Promoter Mutations in Tumors. N Engl J Med, 2015. 372(26): p. 2499-508.
2.Ogura, R., et al., Immunohistochemical profiles of IDH1, MGMT and P53: practical significance for prognostication of patients with diffuse gliomas. Neuropathology, 2015. 35(4): p. 324-35.
3.Takano, S., et al., Immunohistochemistry on IDH 1/2, ATRX, p53 and Ki-67 substitute molecular genetic testing and predict patient prognosis in grade III adult diffuse gliomas. Brain Tumor Pathol, 2016. 33(2): p. 107-16.
4.Ozturk-Isik, E., et al., Identification of IDH and TERTp mutation status using 1H‐MRS in 112 hemispheric diffuse gliomas. Journal of Magnetic Resonance Imaging, 2019. 51.
5.Andronesi, O.C., et al., Detection of 2-hydroxyglutarate in IDH-mutated glioma patients by in vivo spectral-editing and 2D correlation magnetic resonance spectroscopy. Sci Transl Med, 2012. 4(116): p. 116ra4.
6.Choi, C., et al., 2-hydroxyglutarate detection by magnetic resonance spectroscopy in IDH-mutated patients with gliomas. Nat Med, 2012. 18(4): p. 624-9.
7.Nagashima, H., et al., Diagnostic value of glutamate with 2-hydroxyglutarate in magnetic resonance spectroscopy for IDH1 mutant glioma. Neuro Oncol, 2016. 18(11): p. 1559-1568.
8.Cavassila, S., et al., Cramér–Rao bounds: an evaluation tool for quantitation. NMR in Biomedicine, 2001. 14(4): p. 278-283.
9.Kreis, R., The trouble with quality filtering based on relative Cramér-Rao lower bounds. Magnetic Resonance in Medicine, 2016. 75(1): p. 15-18.
10.Provencher, S.W., Automatic quantitation of localized in vivo 1H spectra with LCModel. NMR Biomed, 2001. 14(4): p. 260-4.
11.Altman, N.S., An Introduction to Kernel and Nearest-Neighbor Nonparametric Regression. The American Statistician, 1992. 46(3): p. 175-185.
12.Cristianini, N. and J. Shawe-Taylor, An introduction to support vector machines : and other kernel-based learning methods, 2000, Cambridge, U.K. ; New York: Cambridge University Press. xiii, 189 p.
13.Quinlan, J.R., Induction of Decision Trees. Mach. Learn., 1986. 1(1): p. 81–106.
14.Schapire, R.E., A brief introduction to boosting, in Proceedings of the 16th international joint conference on Artificial intelligence - Volume 21999, Morgan Kaufmann Publishers Inc.: Stockholm, Sweden. p. 1401–1406.
15.Tibshirani, R., Regression Shrinkage and Selection via the Lasso. Journal of the Royal Statistical Society. Series B (Methodological), 1996. 58(1): p. 267-288.
16.Skovgaard, L.T., Applied regression analysis. 3rd edn. N. R. Draper and H. Smith, Wiley, New York, 1998. No. of pages: xvii+706. Price: £45. ISBN 0-471-17082-8. Statistics in Medicine, 2000. 19(22): p. 3136-3139.
17.Haibo, H., et al. ADASYN: Adaptive synthetic sampling approach for imbalanced learning. in Conference Proceedings of 2008 IEEE International Joint Conference on Neural Networks (IEEE World Congress on Computational Intelligence). 2008. p. 1322-1328.
Figures