0949
ADC Decreases in Solid Tumors Following Monotherapy With PEGylated Recombinant Human Hyaluronidase: Results From Early-Phase Clinical Trials1Moffitt Cancer Center, Tampa, FL, United States
Synopsis
In early-phase clinical trials, we observed a general decrease in tumor ADC following administration of PEGylated Recombinant Human Hyaluronidase PH20 (PEGPH20) as monotherapy. This decrease was related with reduction of tumor hyaluronan measured in biopsy samples. Reduction in ADC is suggestive of a decrease in tumor water content following hyaluronan depletion by PEGPH20.
INTRODUCTION
The extracellular matrix (ECM) of solid tumors can contain significant amounts of hyaluronic acid (HA) forming a viscoelastic watery gel-fluid phase that has been mechanistically linked to high interstitial fluid pressure (IFP) in tumors. A dense ECM and high IFP, coupled with dysfunctional tumor microvasculature, leads to poor distribution of systemically-administered therapeutics into the tumor mass 1-3. High tumor levels of HA can promote intratumoral hypoxia and acidity 4, further contributing to poorer prognoses. PEGylated Recombinant Human Hyaluronidase PH20 (PEHPG20) is an investigational anti-cancer therapeutic that was developed to target and degrade tumor HA 5,6.In vitro and pre-clinical studies have shown that PEGPH20 depletes HA, leading to decreased IFP, increased perfusion, decreased water, increased micro-vessel area, reduced hypoxia, increased pH, and changes in water diffusion, among other therapeutic events 2-4,7,8,9. In mouse models, combination of PEGPH20 with other anti-cancer drugs resulted in higher tumor size reductions than without PEGPH20 7. ADC estimated from DW-MRI provides a non-invasive measure of tumor water content and mobility, both properties reported to be affected by PEGPH20 8,10. Pre-clinical studies using mouse models demonstrated an increase of tumor ADC with low diffusion weighting (b values) 8, and a decrease of ADC with higher b values 10. Here we report the first analysis of ADC response in advanced solid tumors from early-phase clinical trials of PEGPH20 5,6.
METHODS
We collected DW-MRI data in two clinical trials of PEGPH20, HALO-109-101 (NCT00834704) and HALO-109-102 (NCT01170897). HALO-109-101 was a Phase I dose-escalation study (0.5-50µg/Kg) on 14 patients, with PEGPH20 administered once or twice weekly on day 1 of each 21 days cycle. DW-MRI was obtained in 11 subjects, 7 with imaging done before and 2-4 days after drug. Baseline HA staining was obtained in 6 subjects. In HALO-109-102, PEGPH20 was administered (0.5-5µg/Kg) once or twice weekly in 25 days cycles together with the anti-inflammatory dexamethasone in 26 subjects. DW-MRI was obtained in 14 subjects, of whom 9 subjects had available DW-MRI at baseline and following PEGPH20 (day 1; days 2, 3 or 4; and end of first cycle). HA staining before and after drug (day 2 or beyond) was available in 5 patients. In this work, 16 patients from both trials with DW-MRI available from multiple scan dates visits were analyzed.Single-shot EPI DW-MRI images were acquired with in-plane resolution of ~1.5x1.5mm2, slice thickness of 8mm, TR ~6s, TE ~80ms, field strength 1.5T, FA 90°, and b values of 0 and 450s/mm2. Typically, 3 replicates of the b=0 and 450 images were obtained per session. ADC was computed per replicate using the mono-exponential model 11. Tumors and Regions-Of-Interest within normal tissues were manually contoured. Median ADC values were computed per tissue at each visit. From the ADC repeats at baseline we obtained the median ADC Repeatability Coefficient ($$$RC=2.77\sqrt{\sigma^2}$$$) to identify true ADC changes 12. HA % content in tumor biopsy samples was measured by HA histochemical staining.
RESULTS
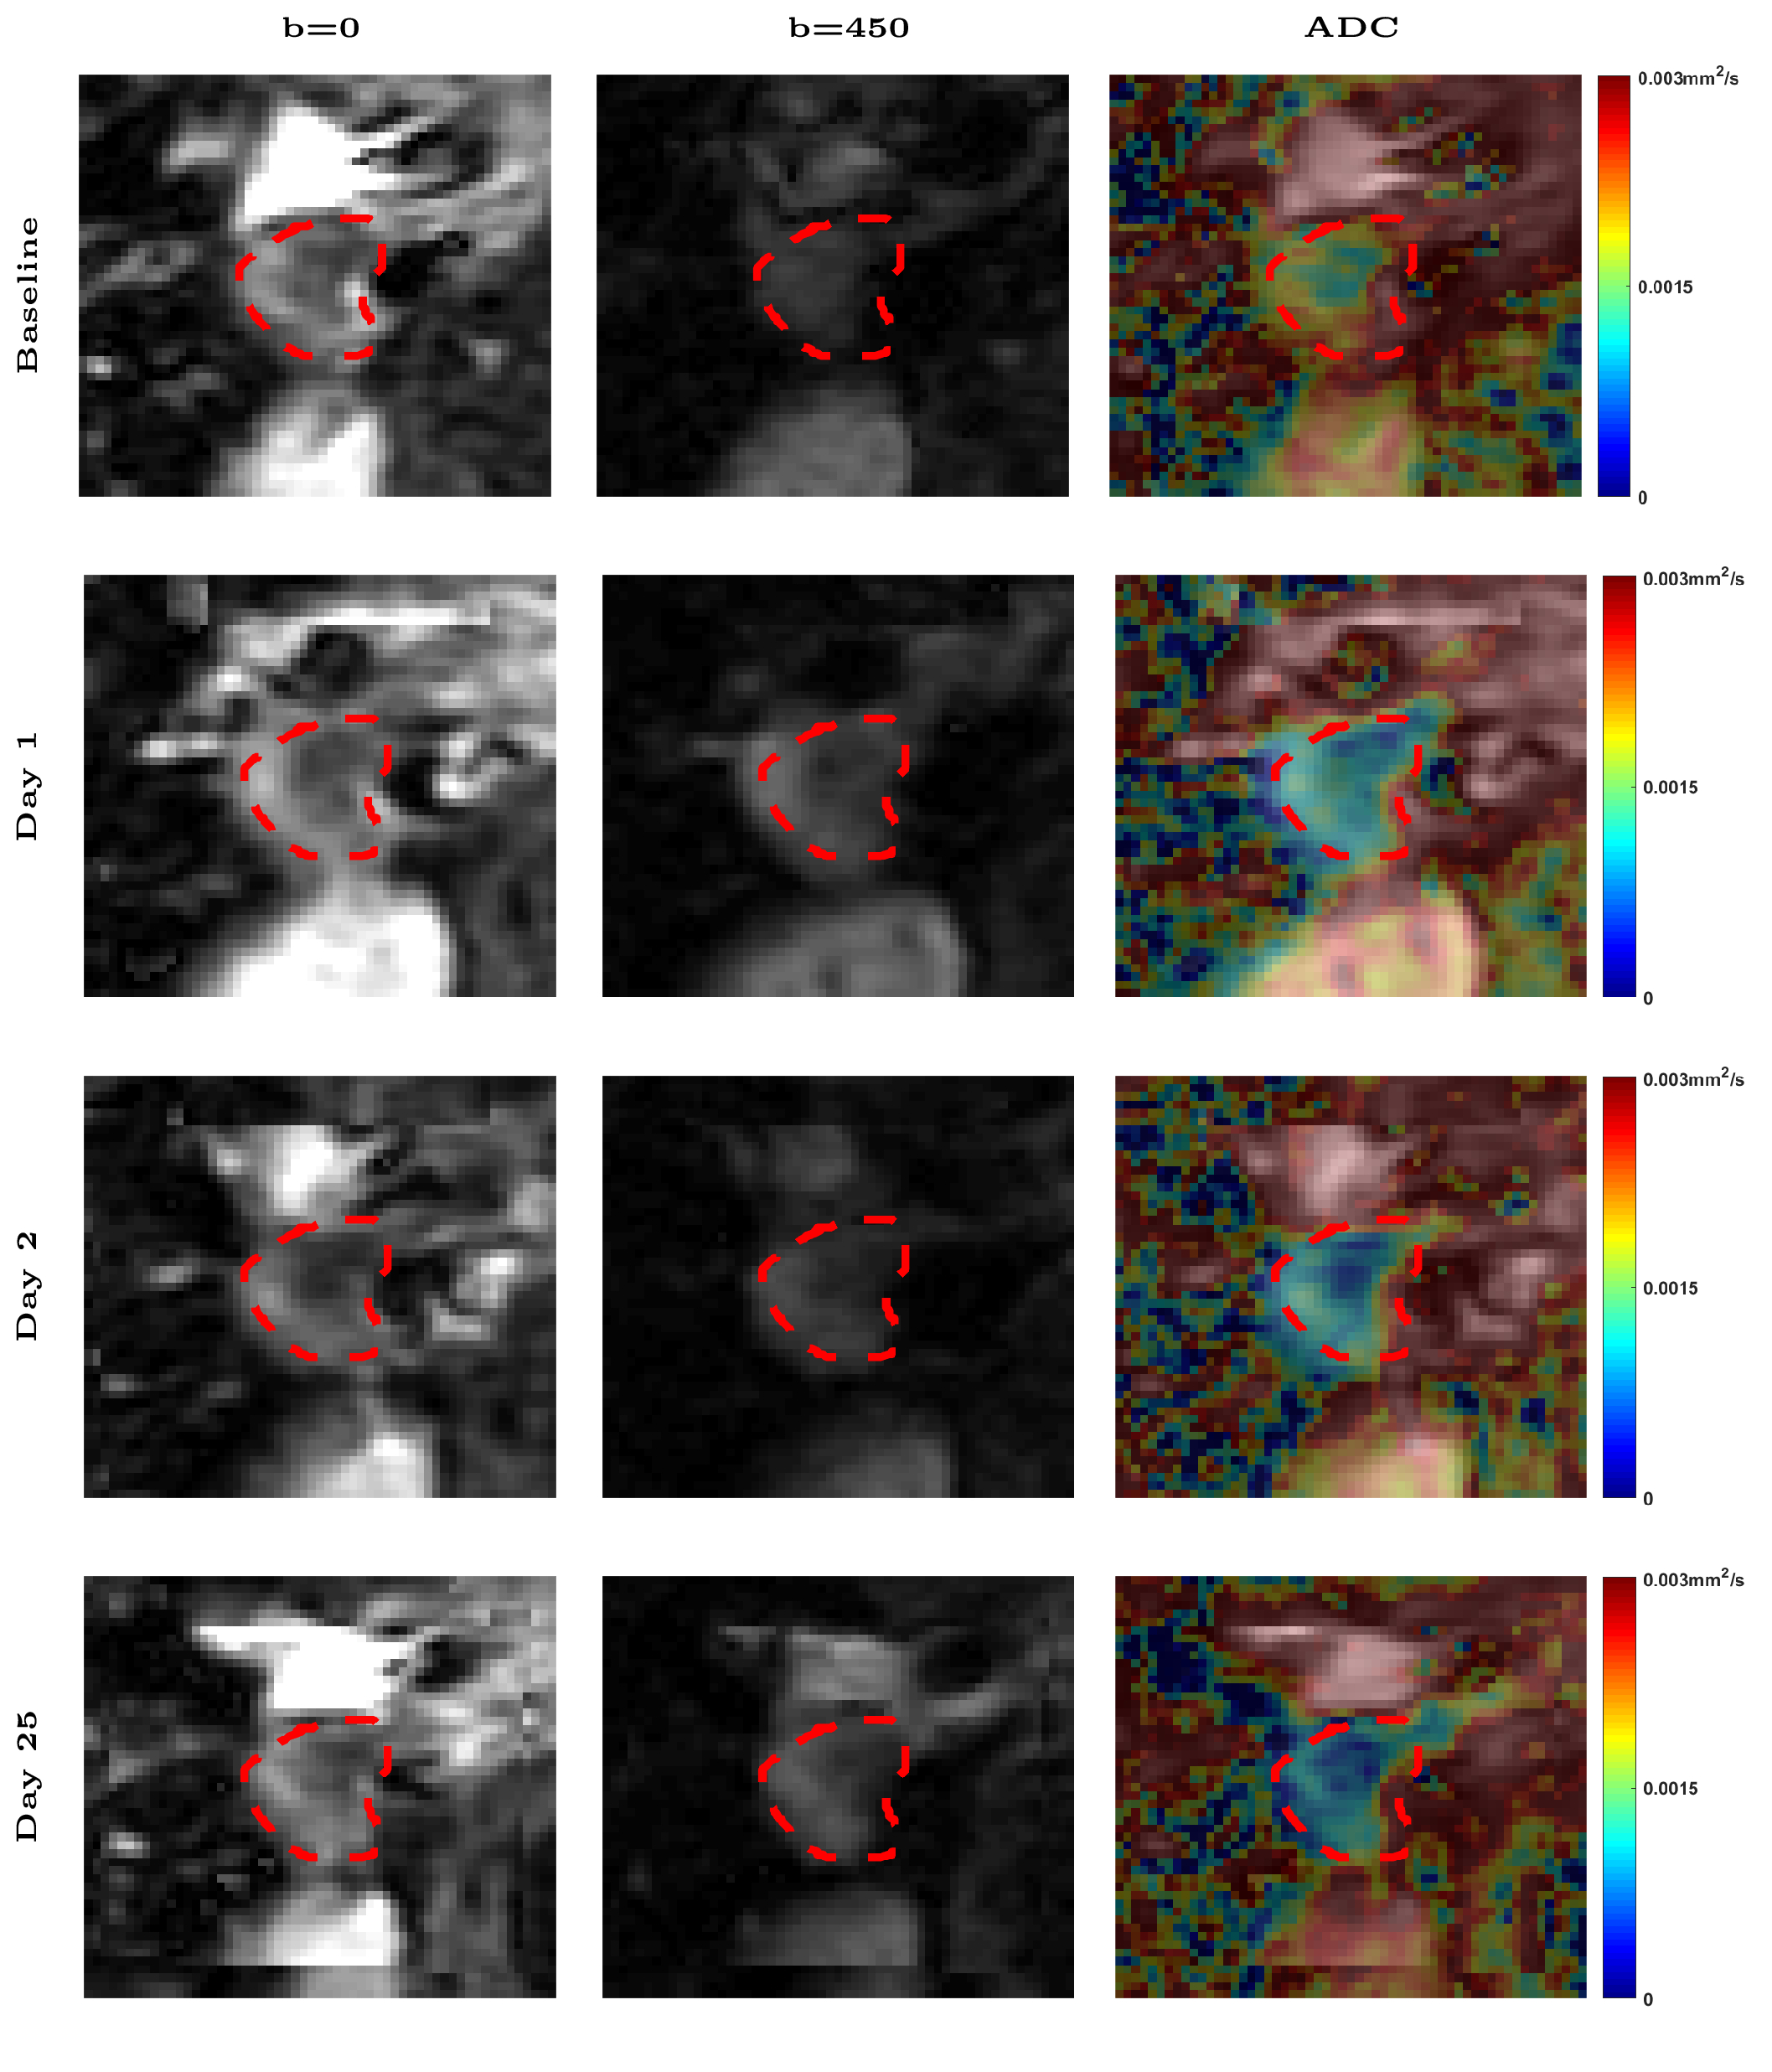
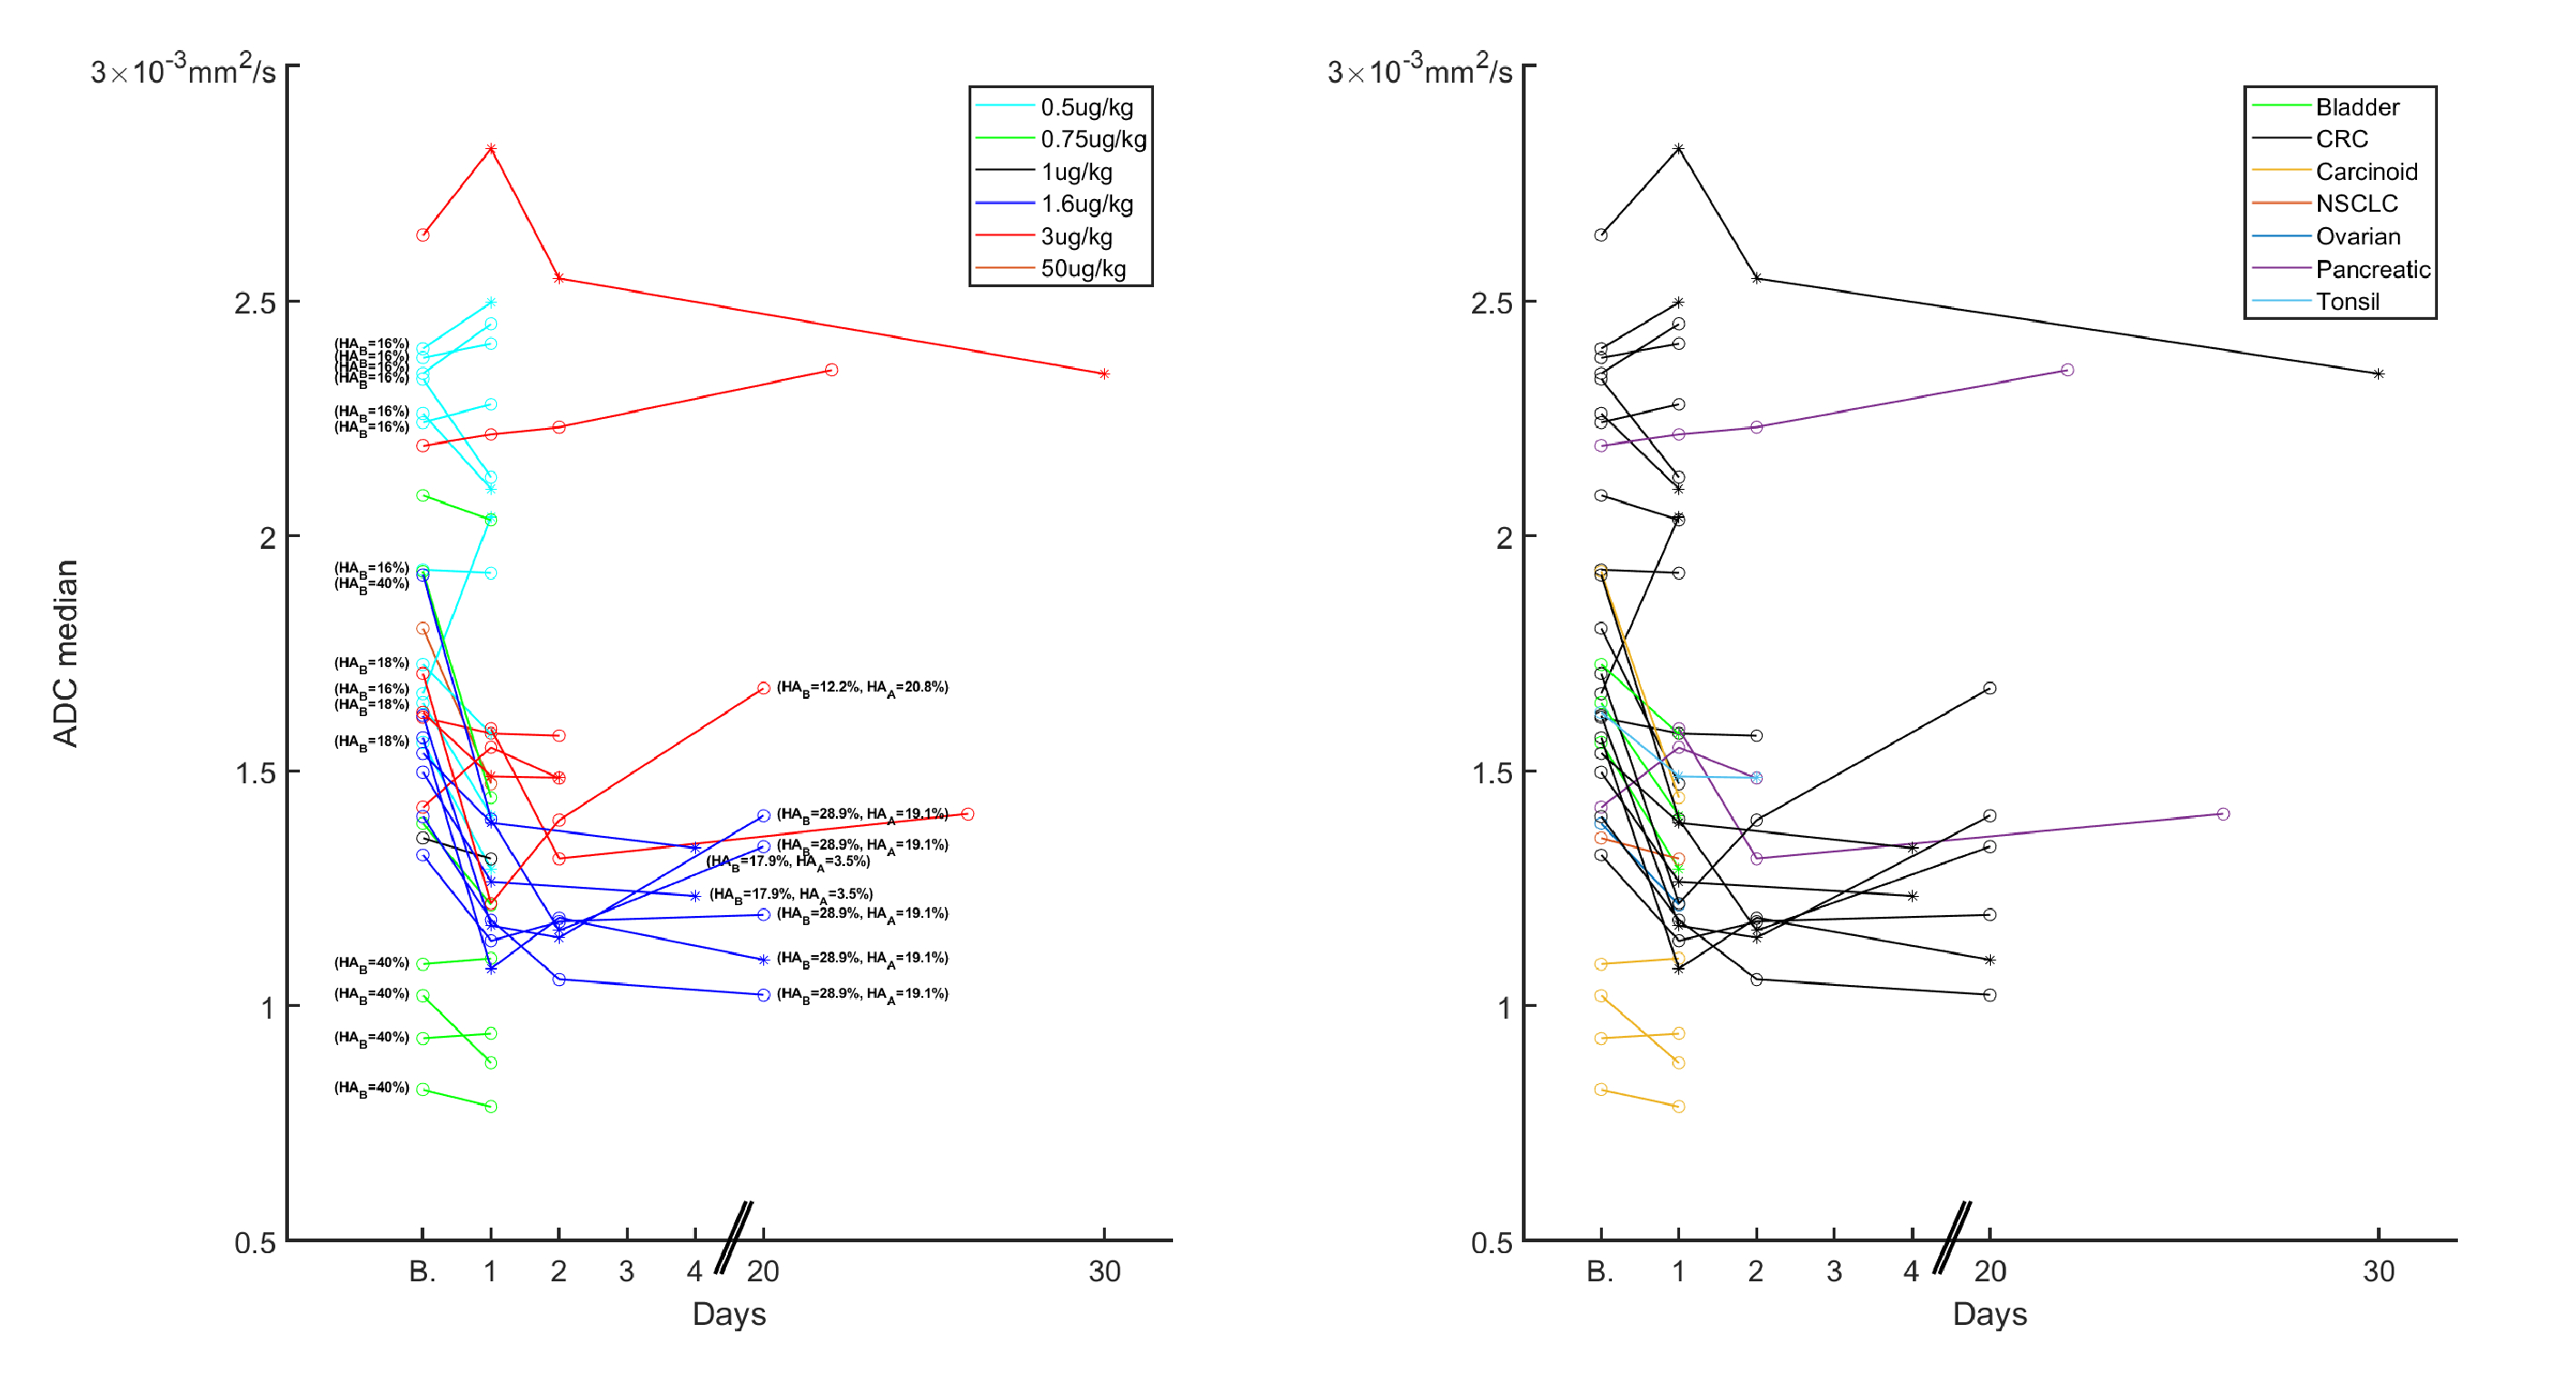
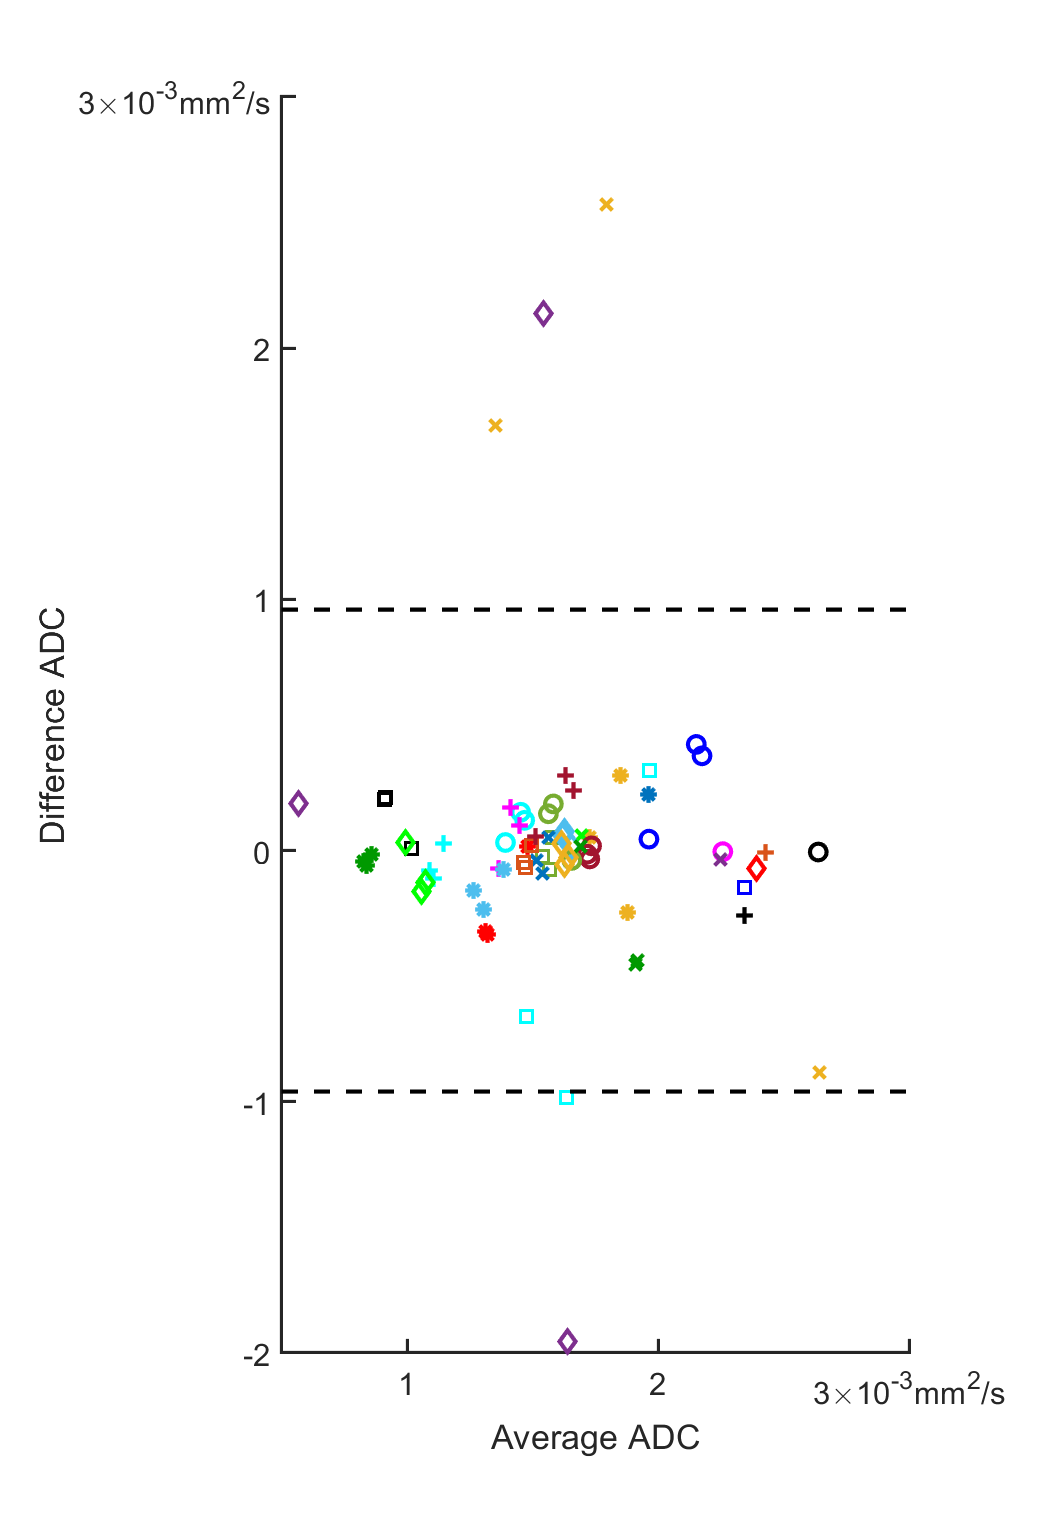
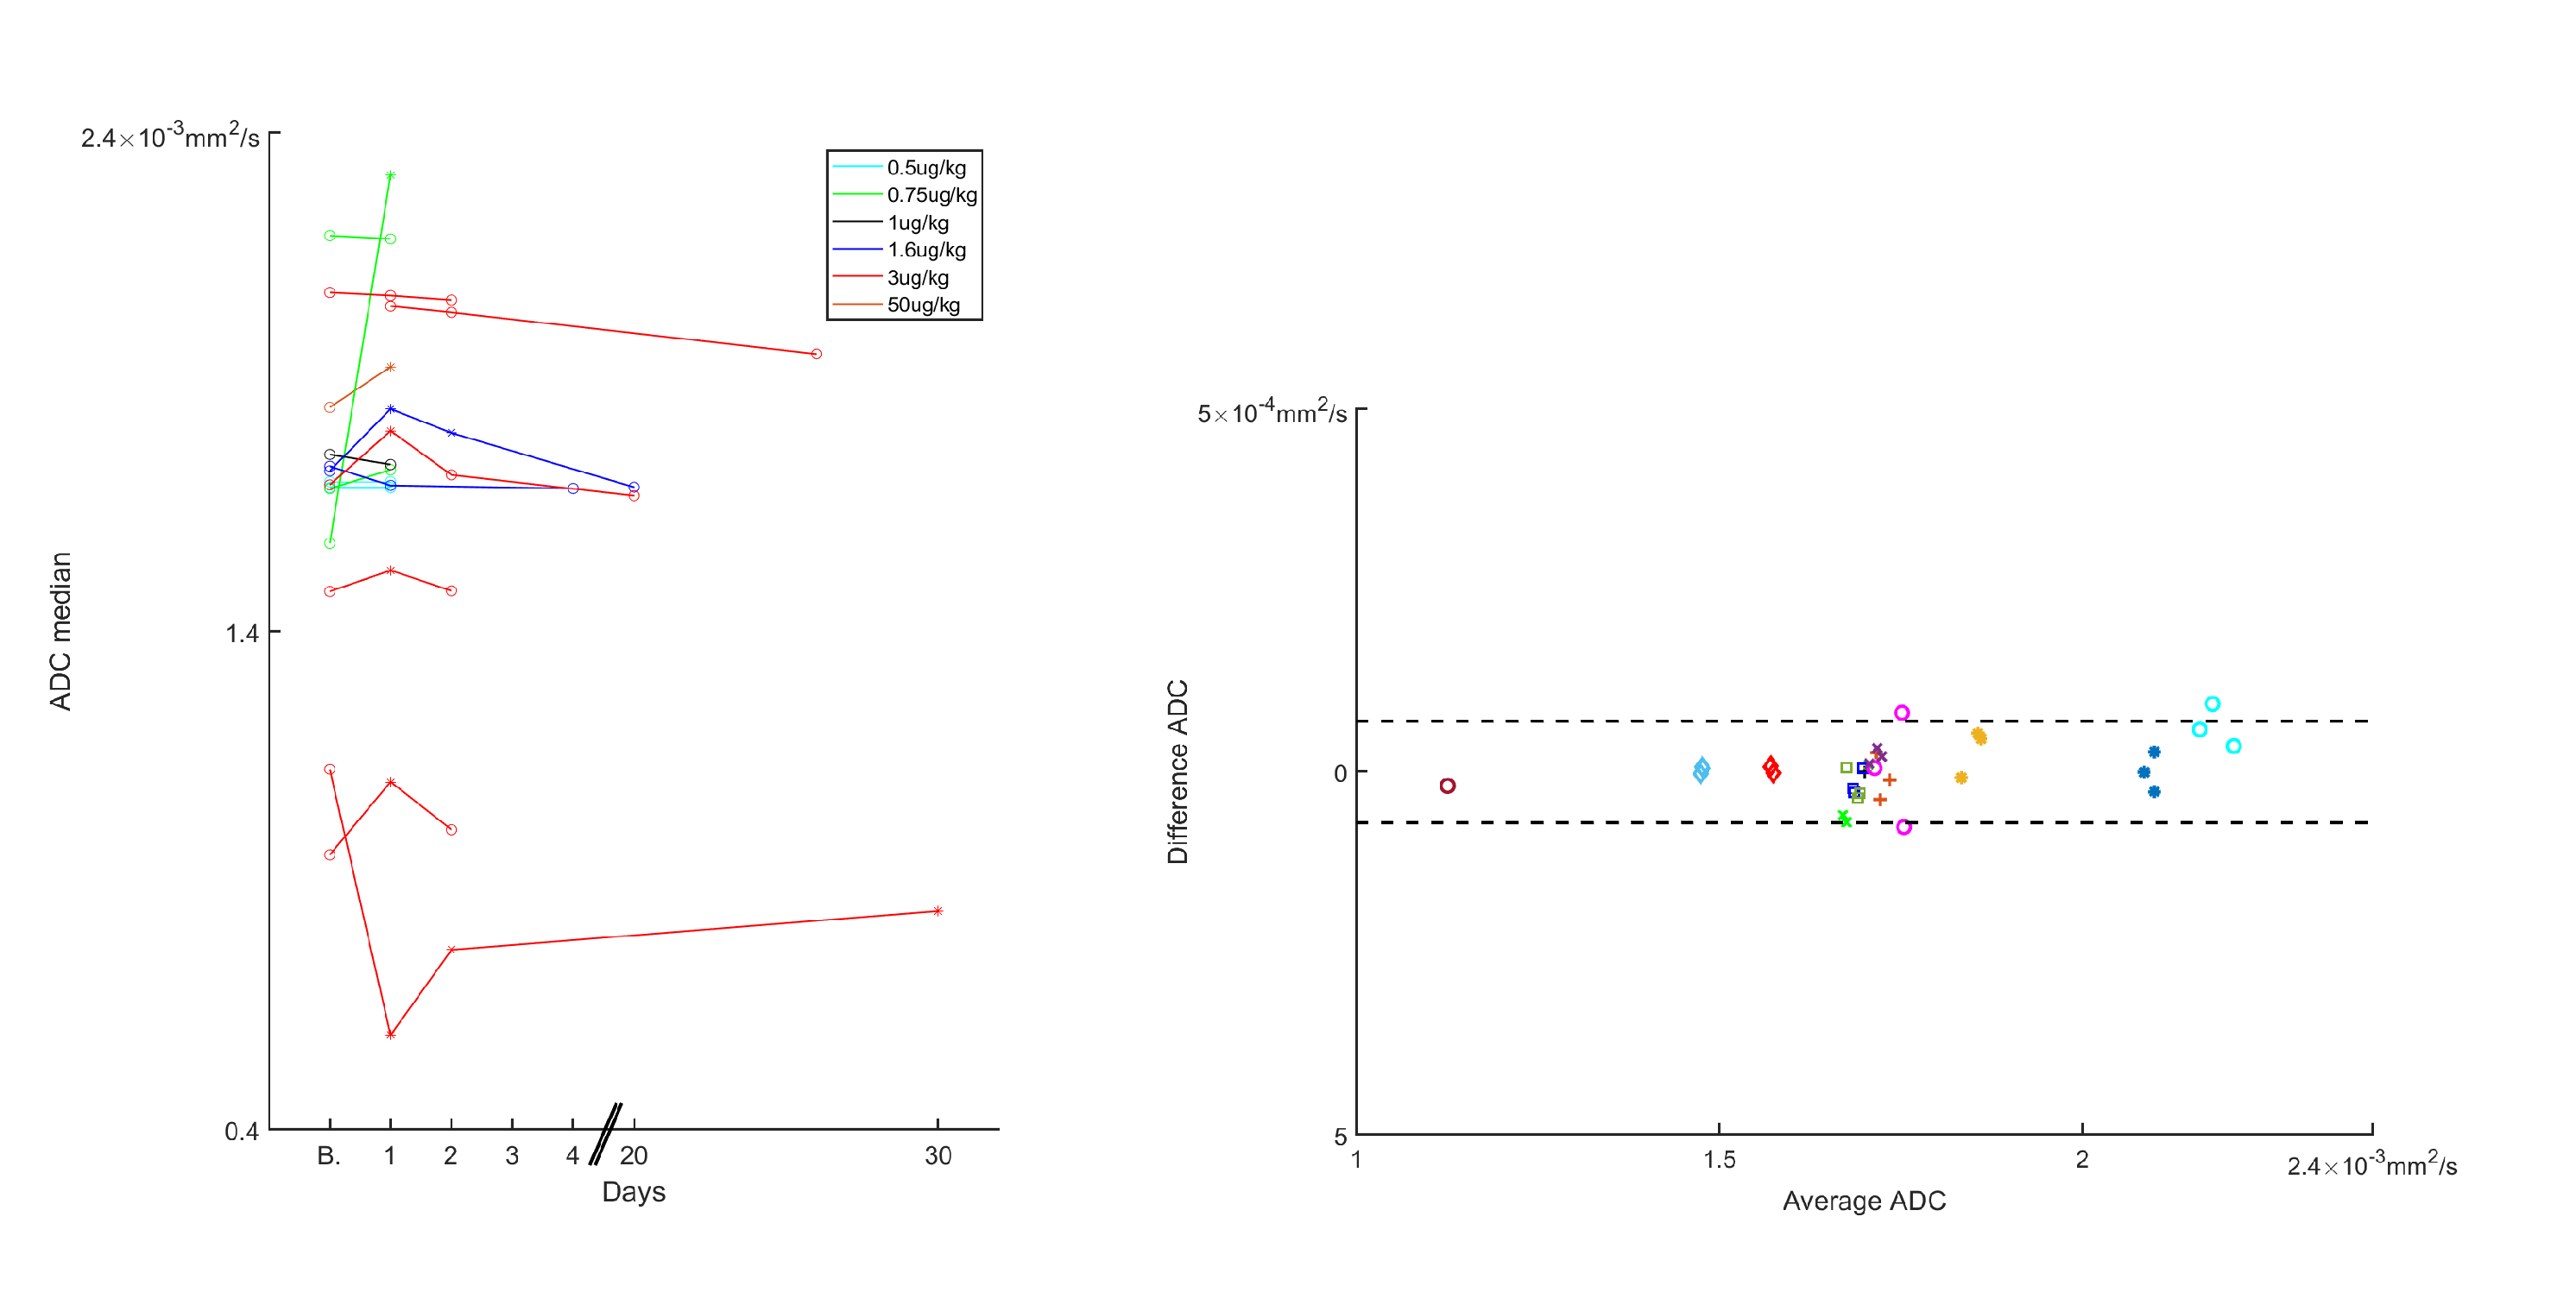
Figure 1 shows DW-MRI images and ADC per visit of a colorectal cancer metastasis in the liver. At baseline, a higher ADC is observed, then after PEGPH20 there is a decrease in ADC. This decrease was associated with a tumor HA level change from 28.9% HA at baseline to 19.1% HA following treatment. Changes in ADC of a total of 34 tumors in 16 subjects are depicted in Figure 2. Absolute changes relative to baseline above the RC per tumor are also depicted. A Bland-Altman plot depicting RC per tumor and whole data is shown in Figure 3. In Figure 2 it can be noted that the majority of tumors exhibited a decrease in ADC post-PEGPH20. At the first post-PEGPH20 scan date 23 of 33 tumors had lower ADC than at baseline, though 9/33 were above RC. 11 of the 13 tumors at the second scan date showed a lower ADC relative to baseline, though 6/13 were above RC. At the third post-PEGPH20 scan date 7 of 8 total tumors still had lower ADC relative to baseline, though 2/8 were above the RC. A clear relationship between ADC response and either the dose or tumor type was not discernable. Additionally, it was observed that in tumors in which a decrease in HA was measured, ADC was also lower post-PEGPH20. To compare with tumor responses, we also show ADC changes and a Bland-Altman plot for muscle tissue (Figure 4). In general, muscle ADC did not change significantly with treatment.CONCLUSIONS
Tumor ADC tended to decrease following PEGPH20 treatment, which would be consistent with a decrease in tumor water content consequent to HA depletion by the action of PEGPH20, as has been reported in pre-clinical studies 10. We also observed a relation between changes in tumor HA measured in biopsy samples, and changes in median tumor ADC. There was not a clear relationship between PEGPH20 dose and the magnitude of ADC response, which is not completely unexpected given that PEGPH20 is an enzyme which is not consumed upon interaction with its target. In summary, early changes in tumor ADC may serve as a response biomarker for anti-cancer therapeutic regimens containing PEGPH20.Acknowledgements
No acknowledgement found.References
1. Provenzano, P. P. & Hingorani, S. R. Hyaluronan, fluid pressure, and stromal resistance in pancreas cancer. Br J Cancer 108, 1-8, doi:10.1038/bjc.2012.569 (2013).
2. DuFort, C. C. et al. Interstitial Pressure in Pancreatic Ductal Adenocarcinoma Is Dominated by a Gel-Fluid Phase. Biophysical journal 110, 2106-2119, doi:10.1016/j.bpj.2016.03.040 (2016).
3. DuFort, C. C., DelGiorno, K. E. & Hingorani, S. R. Mounting Pressure in the Microenvironment: Fluids, Solids, and Cells in Pancreatic Ductal Adenocarcinoma. Gastroenterology 150, 1545-1557.e1542, doi:10.1053/j.gastro.2016.03.040 (2016).
4. Li, X. et al. Parallel Accumulation of Tumor Hyaluronan, Collagen, and Other Drivers of Tumor Progression. Clin Cancer Res 24, 4798-4807, doi:10.1158/1078-0432.CCR-17-3284 (2018).
5. Infante, J. R. et al. Phase 1 trials of PEGylated recombinant human hyaluronidase PH20 in patients with advanced solid tumours. Br J Cancer 118, 153-161, doi:10.1038/bjc.2017.327 (2018).
6. Hingorani, S. R. et al. Phase Ib Study of PEGylated Recombinant Human Hyaluronidase and Gemcitabine in Patients with Advanced Pancreatic Cancer. Clinical cancer research : an official journal of the American Association for Cancer Research 22, 2848-2854, doi:10.1158/1078-0432.Ccr-15-2010 (2016).
7. Thompson, C. B. et al. Enzymatic depletion of tumor hyaluronan induces antitumor responses in preclinical animal models. Mol Cancer Ther 9, 3052-3064, doi:10.1158/1535-7163.Mct-10-0470 (2010).
8. Maloney, E. et al. Non-Invasive Monitoring of Stromal Biophysics with Targeted Depletion of Hyaluronan in Pancreatic Ductal Adenocarcinoma. Cancers (Basel) 11, doi:10.3390/cancers11060772 (2019).
9. Cao, J. et al. Dynamic Contrast-enhanced MRI Detects Responses to Stroma-directed Therapy in Mouse Models of Pancreatic Ductal Adenocarcinoma. Clin Cancer Res 25, 2314-2322, doi:10.1158/1078-0432.CCR-18-2276 (2019).
10. Emma L. Reeves, J. L., Jessica K. R. Boult, Barbara Blouw, David Kang, Jeffrey C. Bamber, Yann Jamin, Simon P. Robinson. in ISMRM 2020 (2020).
11. Lorza, A. M. A. et al. Dose-response assessment by quantitative MRI in a phase 1 clinical study of the anti-cancer vascular disrupting agent crolibulin. Sci Rep 10, 14449, doi:10.1038/s41598-020-71246-w (2020).
12. Shukla-Dave, A. et al. Quantitative imaging biomarkers alliance (QIBA) recommendations for improved precision of DWI and DCE-MRI derived biomarkers in multicenter oncology trials. J Magn Reson Imaging 49, e101-e121, doi:10.1002/jmri.26518 (2019).
Figures