0948
Automatic segmentation of glioma based on MRI K-space data1Paul C. Lauterbur Research Center for Biomedical Imaging, Shenzhen Institutes of Advanced Technology, Chinese Academy of Sciences, Shenzhen, China, 2Key Laboratory for Magnetic Resonance and Multimodality Imaging of Guangdong Province, Shenzhen Institutes of Advanced Technology, Chinese Academy of Sciences, Shenzhen, China, 3CAS key laboratory of health informatics, Shenzhen Institutes of Advanced Technology, Chinese Academy of Sciences, Shenzhen, China, 4Faculty of Information Technology, Beijing University of Technology, Beijng, China
Synopsis
Nowadays, Magnetic Resonance Imaging (MRI) plays a pivotal role in gliomas diagnosis, analysis, and surgery planning. Nevertheless, the accuracy of MRI segmentation is enormously restricted by the quality of images. Therefore, we demonstrate a new method that can directly make segmentations from K space data. And the results show that our method achieves the state of the art.
Introduction
Gliomas as the most common primary brain tumor are an aggressive type of malignant brain tumor that grows rapidly, usually requires surgery and radiotherapy, and have a poor survival prognosis. Gliomas can be separated into low-grade gliomas (LGG) and high-grade gliomas (HGG). Most of the time, MRI and lesion manual delineation is essential for gliomas diagnosis and treatment. However, the traditional way is effectively affected by doctors’ personal experience and knowledge. And it leads to highly inaccurate cases and time-consuming issues due to human error. For the reasons, MRI automatic segmentation based on the neural network has been implemented. Although, some neural network architectures have achieved a high accuracy of the segmentation. The results still mainly depend on the precision of training images which are transformed from K space data by Fourier transformation. For solving this issue and increasing the segmentation accuracy, we implemented a new automatic segmentation method that can directly produce the region of interest based on K space data.Method
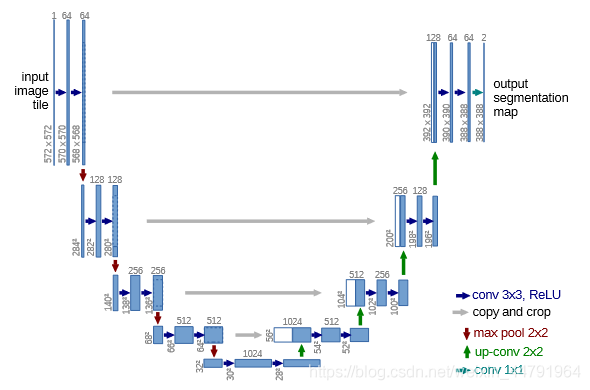
We used Multimodal Brain Tumor Segmentation Challenge (BraTS) 2018 dataset. This dataset provides 285 cases (210 HGG and 75 LGG) which have all four MRI modalities (T1, T1c, T2, and FlAIR) rigidly aligned, resampled to 1x1x1 mm isotropic resolution, and skull-stripped [1]. The region of interest is divided into the whole tumor (WT), tumor core (TC), and enhancing tumor (ET). The main network we utilized is deep residual Unet [2] which was implemented from Unet [3], a fully connected convolutional network. Figure1 shows the architecture of the deep residual Unet. Since the deep residual Unet is a 2D network. We firstly made 18923 2D slices from 285 3D datasets. We concatenated 4 available 2D MRI modalities into the 4 channel image as an input. The output of the network is 3 nested tumor subregions. Therefore, each input image size is 4x160x160 and each output image size is 3x160x160. Then we simulated fully sampled k space data from the input image by trajectory and make the k space image size 8x160x160. The eight channels represent the real and imaginary parts of the four MRI modalities. Afterward, we took 20% data as the test dataset. And we also used 10-fold cross-validation on the remaining dataset. In the training process, the segmentation performance was evaluated by the Dice Similarity Coefficient (DSC), Positive Predictive Value(PPV), Sensitivity, and Hausdorff Distance.Results
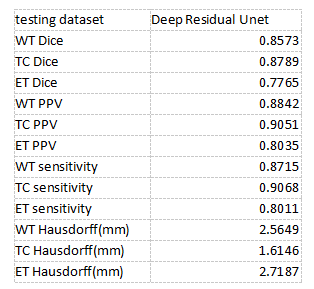
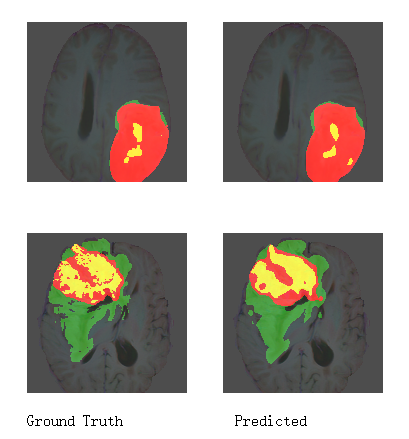
We implemented our method in Pytorch 1.7 and trained it on 2080Ti GPU using BraTS 2018 training dataset (285 cases) without any additional in-house data. The used training time is approximately 3 days. Our results are shown in Table 2. Compared with the results on the Brats2018 website, our method has a better performance on details and segmenting edges. Our BraTS 2018 testing dataset results are 0.8573, 0.8789, and 0.7765 mean dice for WT(whole tumor), TC(tumor core), and ET (enhanced tumor core). It demonstrates that our method has achieved the state of the art compared with other results.Discussion
In this work, our new semantic segmentation method for brain tumor segmentation from 2D K space data has achieved the state of the art performance. For increasing the accuracy, we also experimented with several data augmentation techniques such as flipping and padding for increasing the generalization ability of our model. Moreover, we have also tried the post-processing techniques such as CRF[4]. However, the results after adding the techniques do not act better since K space data do not demonstrate the same property as images. The only method we tried that makes the results better is increasing the network depth. So we added some resnet[5] on the model for avoiding the vanishing gradient. Besides, we are now trying to implement a new technique based on Vnet [6] that can directly make segmentation from 3D Since most medical images are 3D datasets.Acknowledgements
No acknowledgement found.References
[1] Myronenko, A., “3D MRI brain tumor segmentation using autoencoder regularization”, 2018.
[2] Zhang, Z., Liu, Q., and Wang, Y., “Road Extraction by Deep Residual U-Net”, <i>IEEE Geoscience and Remote Sensing Letters</i>, vol. 15, no. 5, pp. 749–753, 2018. doi:10.1109/LGRS.2018.2802944.
[3] Ronneberger, O., Fischer, P., and Brox, T., “U-Net: Convolutional Networks for Biomedical Image Segmentation”, 2015.
[4] Kamnitsas, K., “Efficient Multi-Scale 3D CNN with Fully Connected CRF for Accurate Brain Lesion Segmentation”, 2016.
[5] He, K., Zhang, X., Ren, S., and Sun, J., “Identity Mappings in Deep Residual Networks”, 2016.
[6] Milletari, F., Navab, N., and Ahmadi, S.-A., “V-Net: Fully Convolutional Neural Networks for Volumetric Medical Image Segmentation”, 2016.
Figures