0947
Diagnostic performance of machine learning-based MRI for posterior fossa tumors: a meta-analysis
Chen Chen1, Fabao Gao1, and Xiaoyue Zhou2
1Department of Radiology, West China Hospital, Chengdu, China, 2MR Collaboration, Siemens Healthineers Ltd., Shanghai, China
1Department of Radiology, West China Hospital, Chengdu, China, 2MR Collaboration, Siemens Healthineers Ltd., Shanghai, China
Synopsis
Because of variations in severity and treatment methods of pilocytic astrocytoma, medulloblastoma, and ependymoma, accurate and specific diagnoses of the tumors are critical. Non-invasive diagnosis of posterior fossa tumors based on machine learning-based magnetic resonance imaging are being reported. However, conventional MRI, diffusion MRI, MR perfusion, and magnetic resonance spectroscopy have variable diagnostic values. We present here a meta-analysis of all the relevant published studies and conducted a large sample-size assessment concerning the diagnostic performance and potential covariates that could influence the diagnostic performance of machine learning.
Introduction
Pilocytic astrocytoma (PA), medulloblastoma (MB), and ependymoma (EP) are common posterior fossa tumors (PFTs) in children; hemangioblastoma and metastasis are less common. Most PAs can be treated effectively by complete surgical resection, with an excellent prognosis: 25-year survival rate about 90%. In treatment of MB, survival rates with radiotherapy and chemotherapy have been better than with surgery alone. Compared with PA and MB, EP is chemo-resistant, so chemotherapy has not improved survival rates. MR perfusion and magnetic resonance spectroscopy have variable diagnostic value in the differentiation of PFTs, so non-invasive tests based on ML-based MRI are being evaluated for differentiation of them. The sensitivity of these MRI models for identifying EP vs non-EP vary from 0.067 to 0.800, for MB vs non-MB from 0.365 to 0.952, and for PA vs non-PA from 0.452 to 0.952. The aim of the present meta-analysis was to pool all the published studies and conduct a large sample-size assessment concerning the diagnostic performance of ML-based MRI in predicting the diagnosis of PFTs.Methods
A systematic search of PubMed, Embase, Web of Science, and the Cochrane library up to 25 November 2020 was conducted to collect all relevant articles (Fig. 1). Two reviewers independently screened all papers and extracted characteristics and diagnostic outcomes for eligibility (Fig. 2). Sensitivity, specificity, positive likelihood ratio (PLR), negative likelihood ratio (NLR), diagnostic odds ratio (DOR), and the area under the receiver operating characteristic curves (AUC) were pooled to quantify predictive accuracy (Fig. 3). Summary receiver operating characteristic curves were applied to evaluate the threshold effect. A fixed-effects or random-effects model estimated overall effect size, and a funnel plot was used to assess the publication bias. Data were processed with Review Manager 5.3, Stata14.0 and MetaDisc1.4.Results
Seven studies assessing 879 patients were included in the analysis 1-7 (Table 1-2). The overall AUC of ML were 0.87 (95% confidence interval [CI]: 0.83-0.89) in EP vs non-EP, 0.84 (95%Cl 0.81-0.87) in MB vs non-MB, and 0.92 (95% Cl 0.89-0.94) in PA vs non-PA. The pooled sensitivities and specificities were 0.67 (95% Cl 0.36–0.88) and 0.87 (95% Cl 0.72–0.95) of EP vs non-EP, 0.79 (95% Cl 0.66-0.87) and 0.76 (95% Cl 0.66-0.84) of MB vs non-MB, 0.87 (95% Cl 0.80-0.91) and 0.86 (95% Cl 0.78-0.91) of PA vs non-PA. Sensitivity analysis revealed that most of the original articles had high stability and reliability. In subgroup analyses, whole volumetric feature with ML yielded higher sensitivities (0.64 vs. 0.60, 0.83 vs 0.69, 0.88 vs 0.83) of EP vs non-EP, MB vs non-MB, and PA vs non-PA, respectively, than did solid component, and higher specificities (0.94 vs. 0.58, 0.78 vs 0.57) of EP vs non-EP and MB vs non-MB, respectively. In addition, T1 and T2 with ML yielded higher sensitivity (0.82 vs. 0.77) and specificity (0.85 vs. 0.78) than did contrast-enhanced T1(T1CE) of MB vs non-MB. ML performed better for 3D than for 2D for detection of PA vs non-PA: pooled sensitivity 0.91 vs. 0.79 and specificity 0.84 vs. 0.81. Support vector machines had slightly higher specificity (0.68 vs. 0.67) and specificity (0.84 vs. 0.62) than did naive bayes in EP vs non-EP.Discussion
The whole volumetric feature with ML yielded a better diagnostic performance than did assessments performed with only solid component. This difference could be attributed to cystic or necrotic portions also being characteristics of the tumors. The main structure of MB and EP is solid portion with small cysts, whereas the main structure of PA is predominantly cystic. In addition, T1 and T2 with ML yielded higher sensitivity and specificity than did T1CE of MB vs non-MB; this finding could be attributed to MB having mostly iso intensity on T2, whereas EP and PA have predominantly hyperintensity. However, the signal intensity of PA, MB, and EP on T1CE was strong. Besides, ML performed better for 3D than for 2D in PA vs non-PA: pooled sensitivity 0.91 vs. 0.79 and specificity 0.84 vs. 0.81. 3D volumetric acquisition enhanced the characterization of various parts of tumors, as it has the advantage of capturing inter-slice features, which are ignored in the traditional 2D method.Conclusion
ML demonstrated excellent diagnostic performance for prediction of PFTs, especially for MB vs non-MB and PA vs non-PA. MRI sequences, algorithms, region of interest, and feature extraction were the main factors affecting the diagnostic performance of ML.Acknowledgements
No acknowledgement found.References
[1]Orphanidou-Vlachou E, Vlachos N, Davies N, et al. Texture analysis of T1-and t2-weighted magnetic resonance images to discriminate posterior fossa tumors in children[J]. Neuro-Oncology, 2014,16:i125. [2]Li M, Wang H, Shang Z, et al. Ependymoma and pilocytic astrocytoma: Differentiation using radiomics approach based on machine learning[J]. Journal of Clinical Neuroscience, 2020,78:175-180. [3] Zhou H, Hu R, Tang O, et al. Automatic machine learning to differentiate pediatric posterior fossa tumors on routine MR imaging[J]. American Journal of Neuroradiology, 2020,41(7):1279-1285. [4] Payabvash S, Aboian M, Tihan T, et al. Machine Learning Decision Tree Models for Differentiation of Posterior Fossa Tumors Using Diffusion Histogram Analysis and Structural MRI Findings[J]. FRONTIERS IN ONCOLOGY, 2020,10(71). [5] Fetit A E, Novak J, Rodriguez D, et al. Radiomics in paediatric neuro-oncology: A multicentre study on MRI texture analysis[J]. NMR Biomed, 2018,31(1). [6] Li Y, Li M, Zhang Y, et al. Utility of texture analysis of magnetic resonance imaging in differential diagnosis of common pediatric cerebellar tumors in children[J]. National Medical Journal of China, 2016,96(23):1853-1855. [7] Fetit A E, Novak J, Peet A C, et al. Three-dimensional textural features of conventional MRI improve diagnostic classification of childhood brain tumours[J]. NMR Biomed, 2015,28(9):1174-1184.Figures
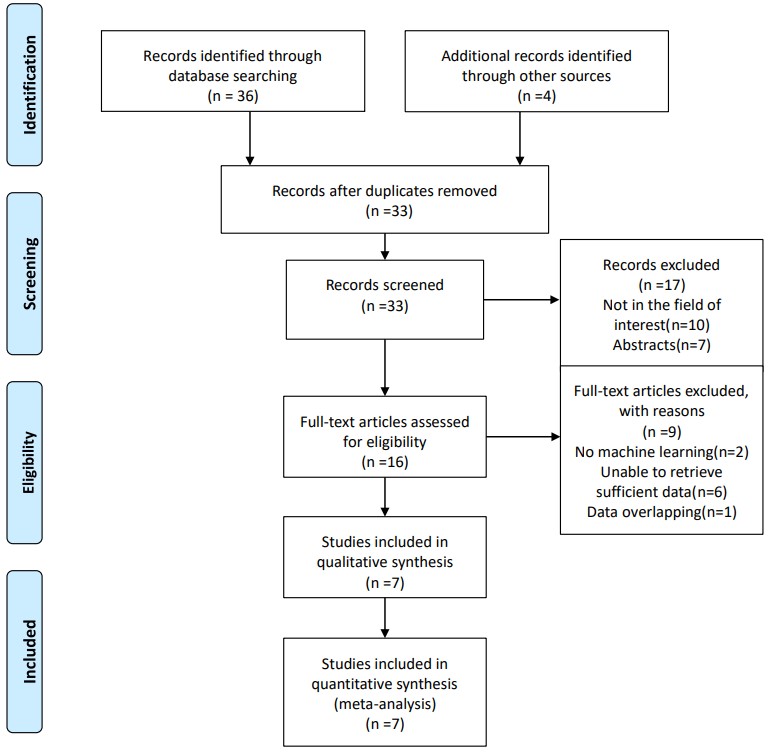
Fig. 1. Flow diagram of literature review
and study selection
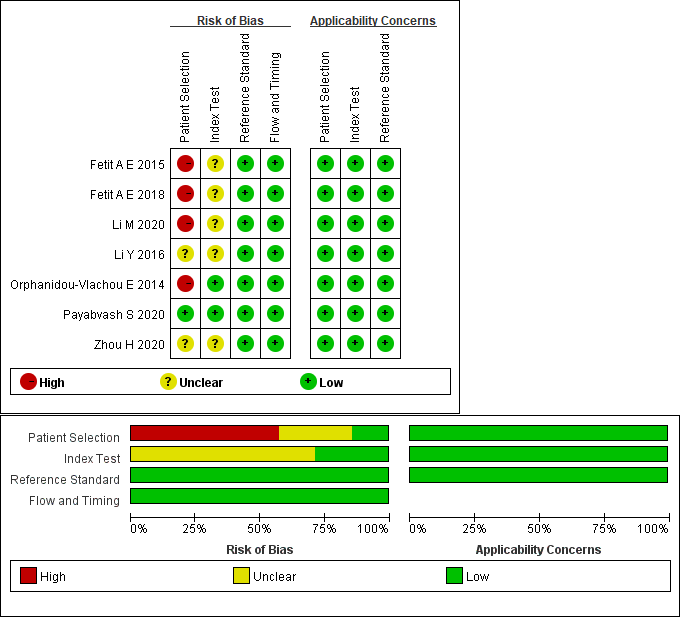
Fig. 2 Summary of risk of bias and
applicability concerns. Green represents low, yellow circle unclear, and red
high risk of bias.
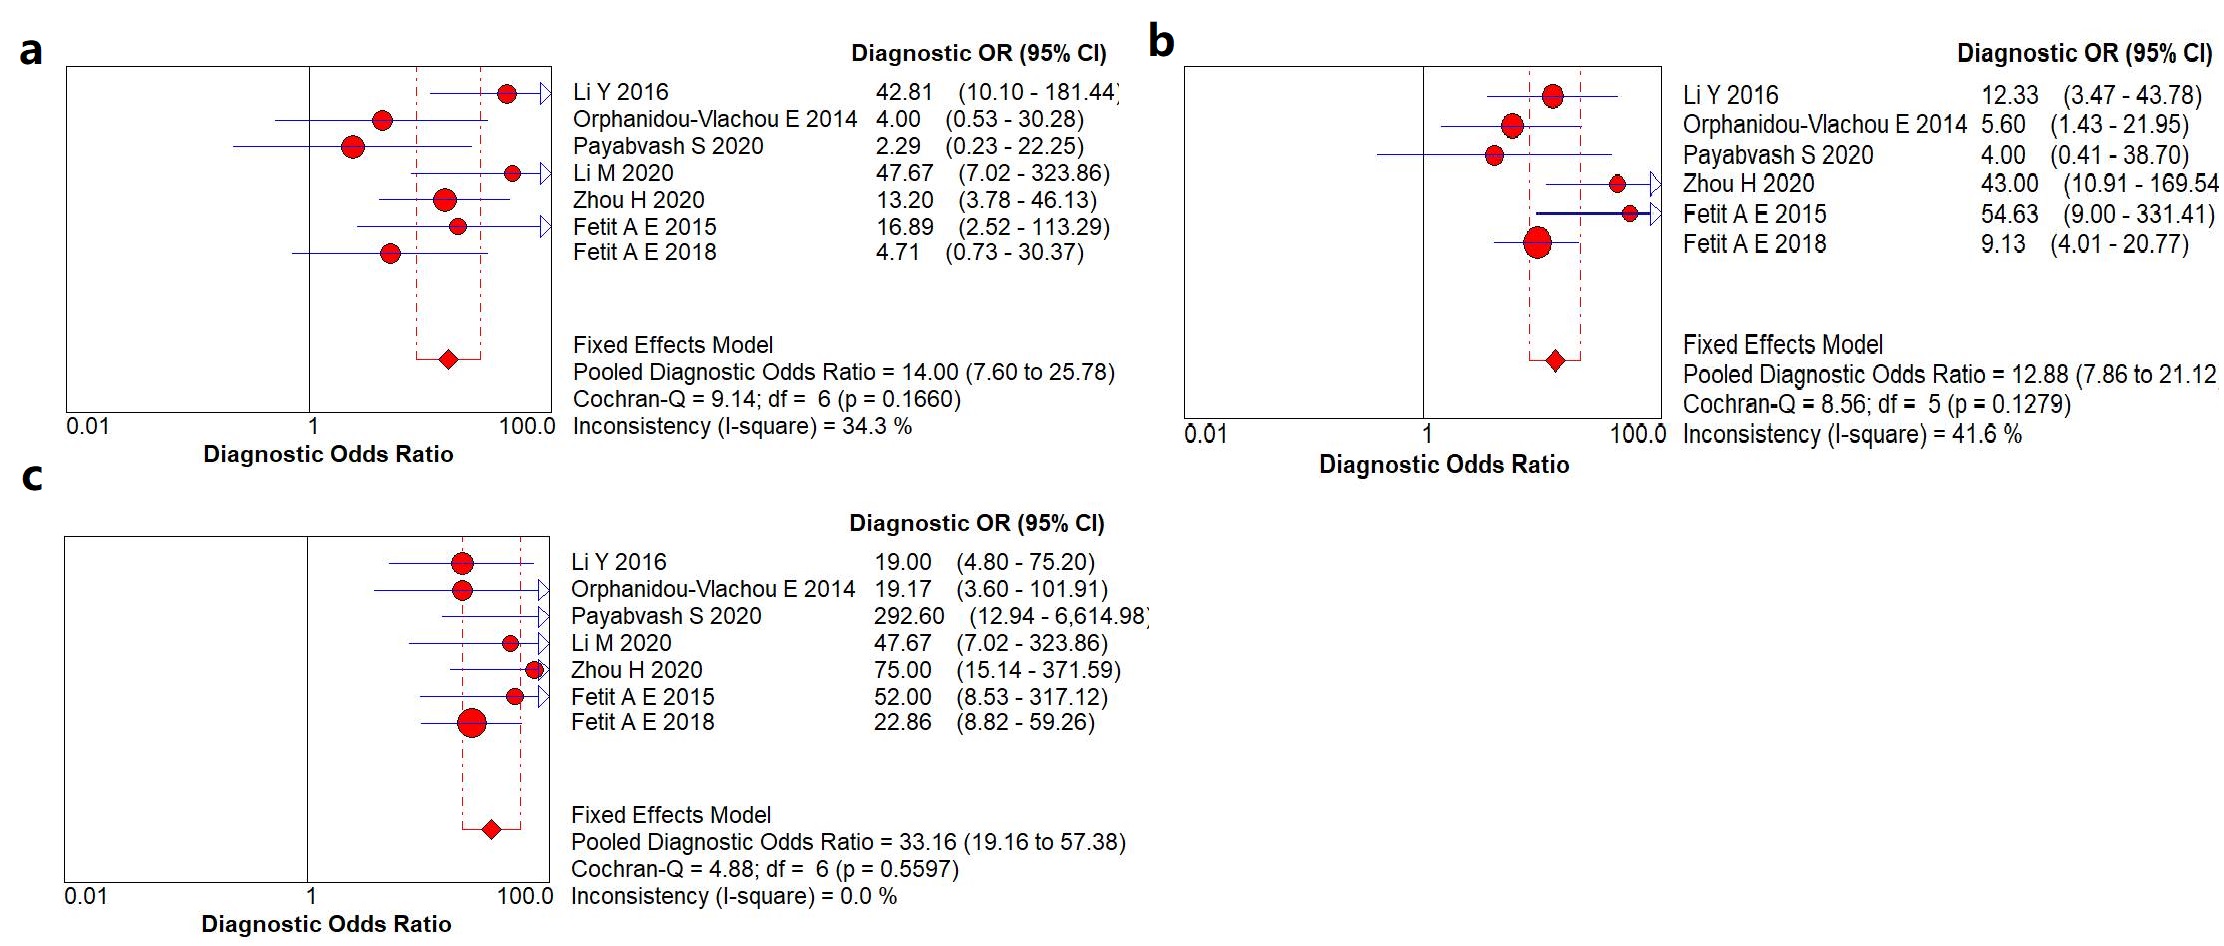
Fig. 3 Forest plot of single studies for
the pooled DOR and a represents EP vs non-EP, b MB vs non-MB, c PA vs non-PA.
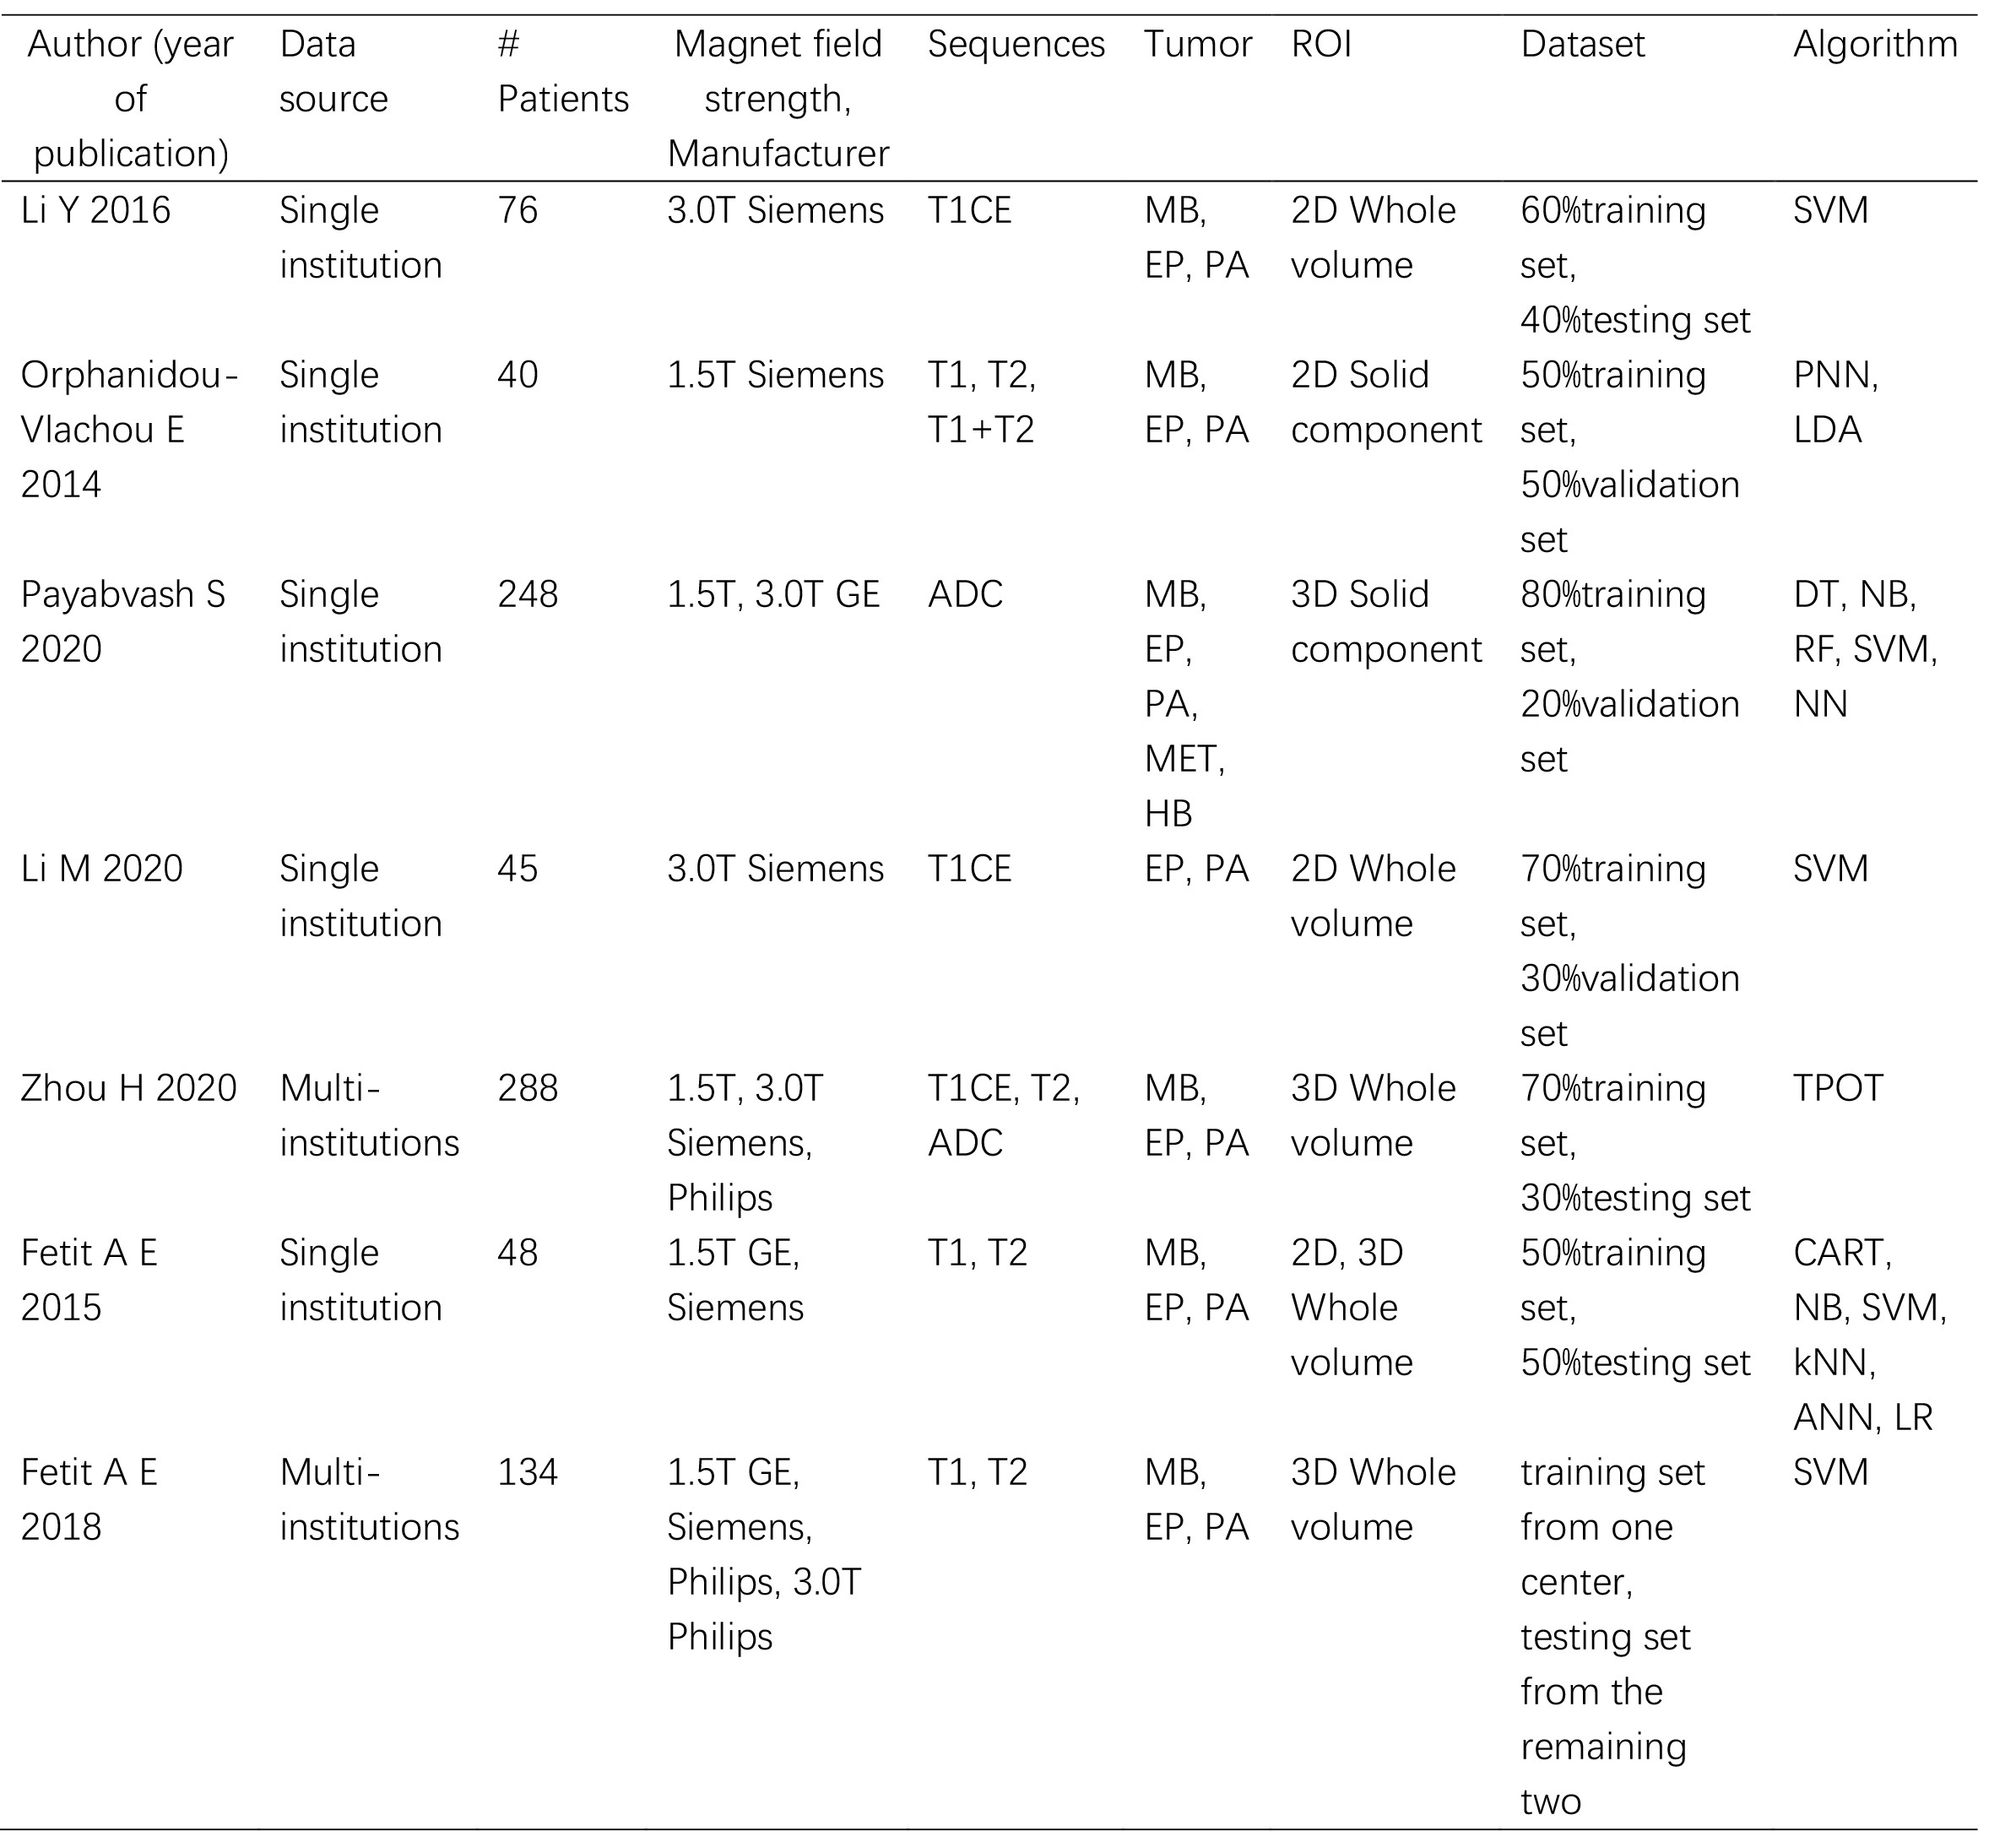
Table 1 Baseline characteristic of included
studies
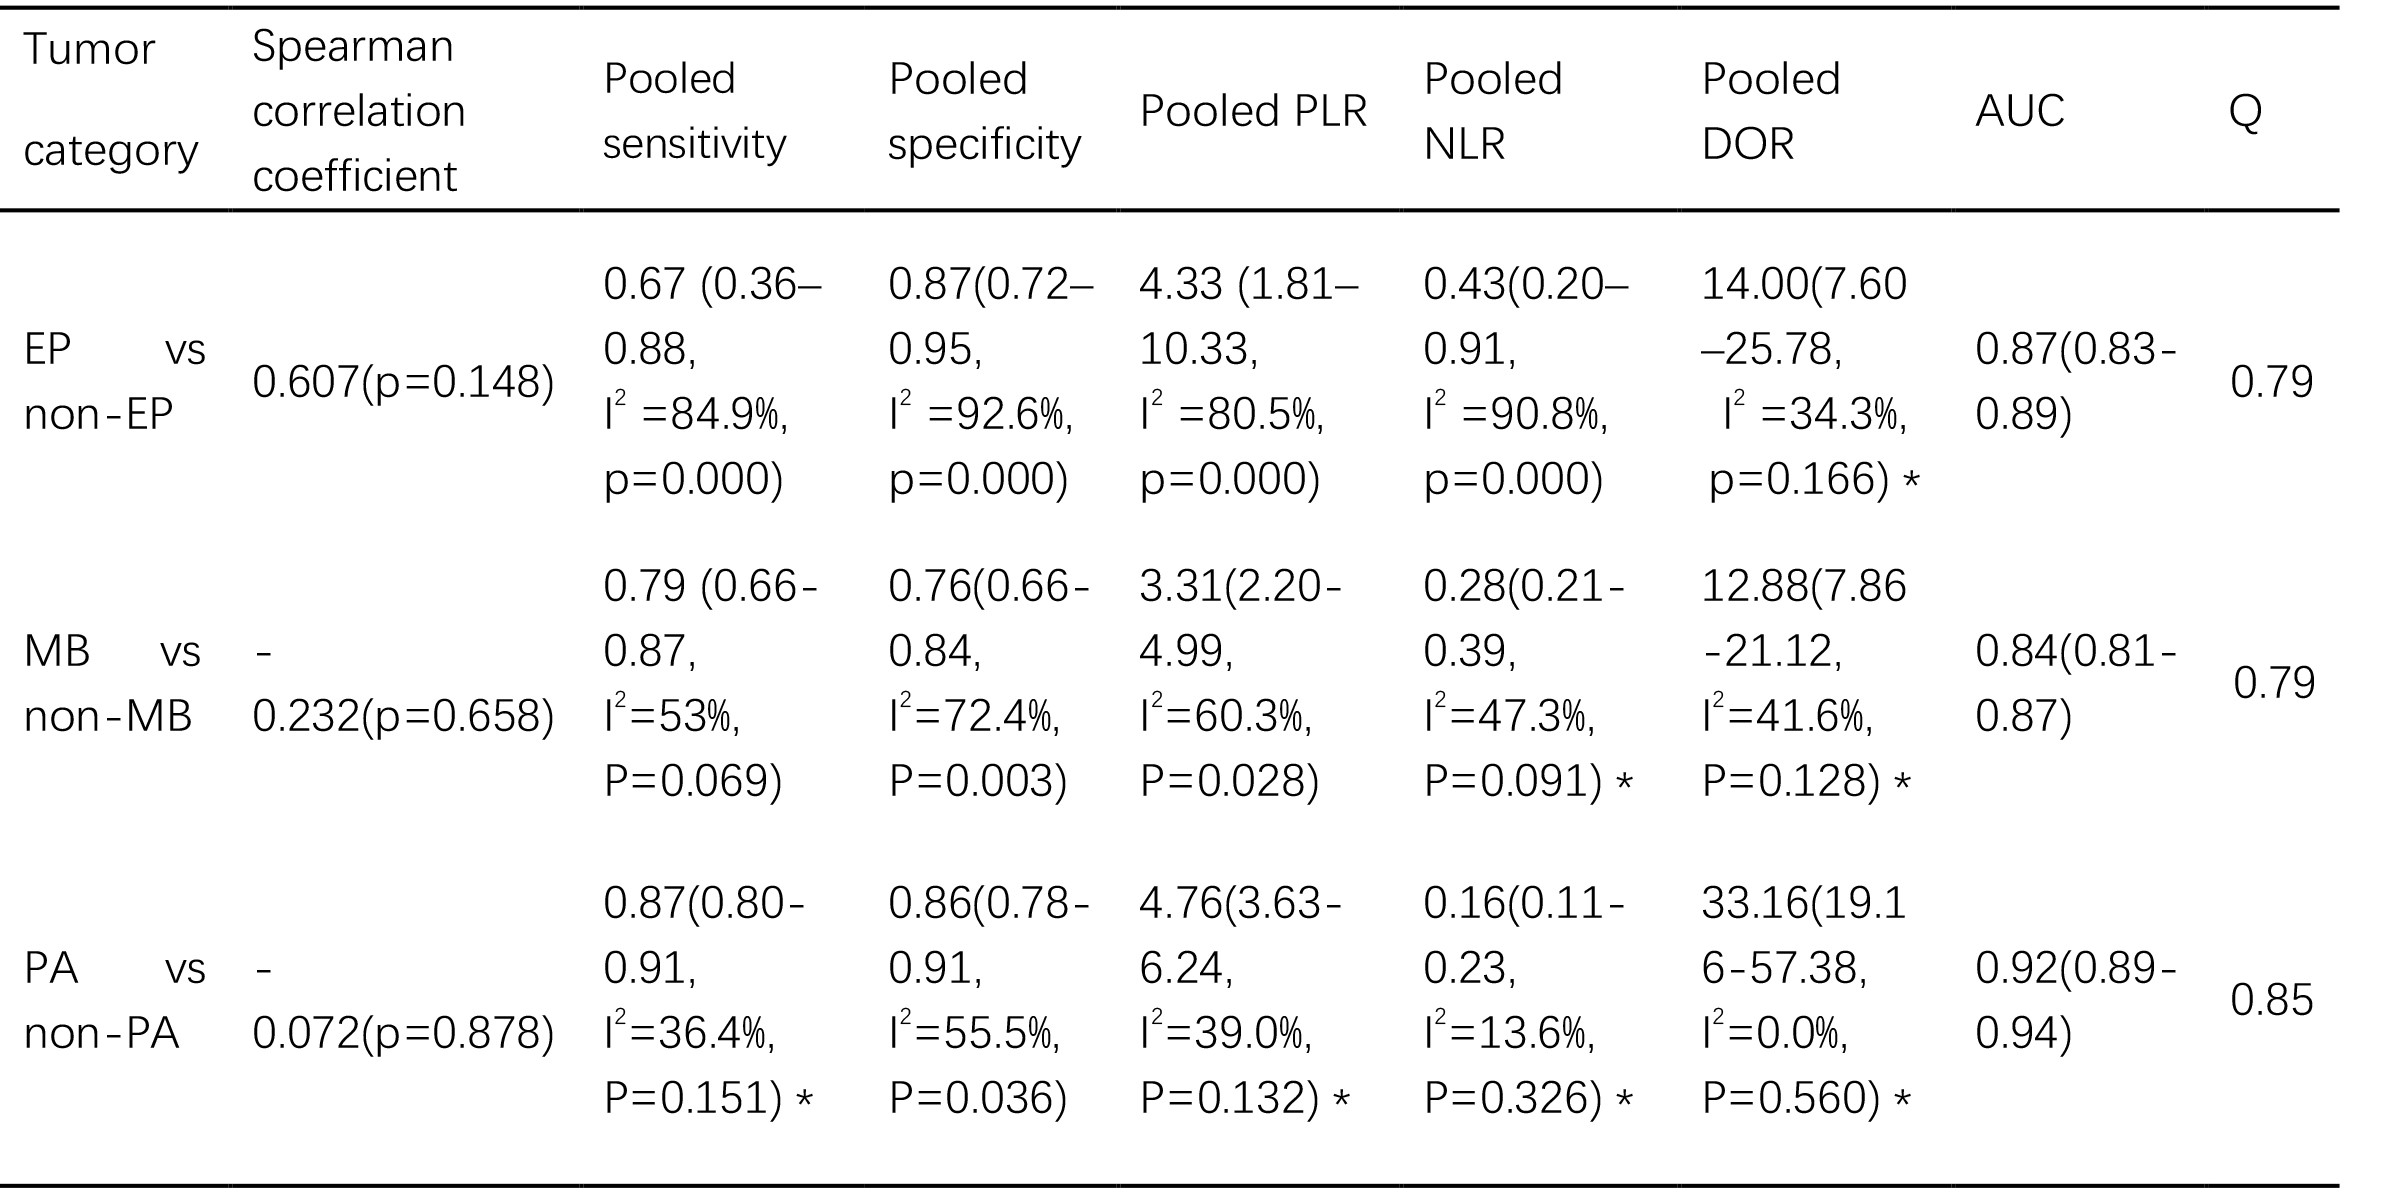
Table 2 Results of tumor differentiation of
ML