0946
The value of preoperative prediction of ki67 and P53 expression in DCE-MRI texture analysis of rectal cancer1The First Affiliated Hospital of Dalian Medical University, Dalian, China, Dalian, China
Synopsis
This study aims to analyze the intrinsic relationship between imaging indicators and tumor biological behavior, and improve the clinical value of DCE-MRI.The correlation between DCE-MRI quantitative parameter values (Ktrans, Ve, Kep) and molecular biomarkers (Ki67,P53) was compared and explored in patients with rectal cancer.
Synopsis
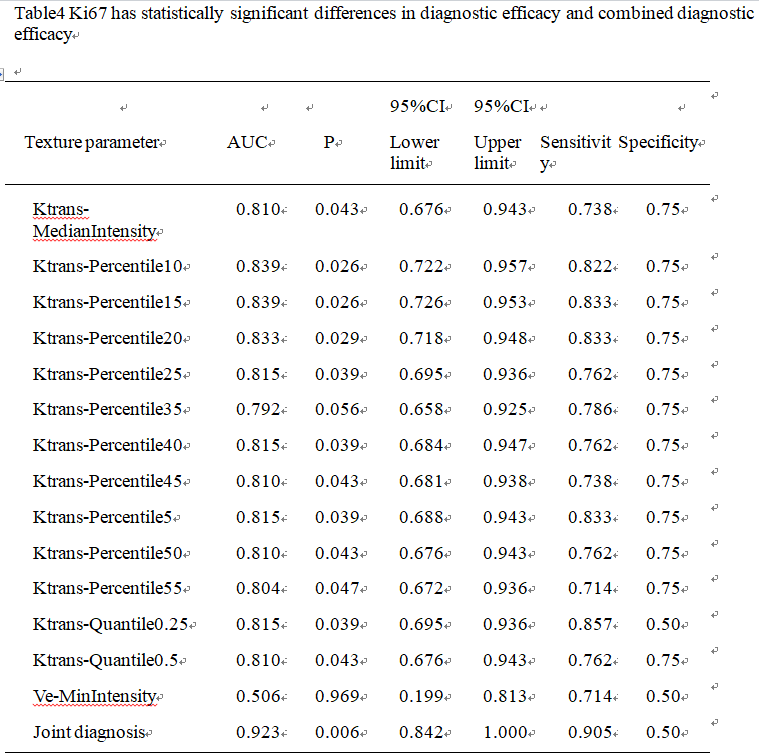
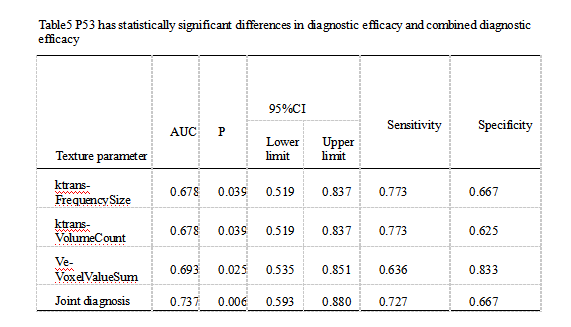
This study aims to analyze the intrinsic relationship between imaging indicators and tumor biological behavior, and improve the clinical value of DCE-MRI.The correlation between DCE-MRI quantitative parameter values (Ktrans, Ve, Kep) and molecular biomarkers (Ki67,P53) was compared and explored in patients with rectal cancer.(Ki67:the combined diagnostic performance is obtained,the AUC was 0.923, with the sensitivity of 90.5% and the specificity of 50%.P53:the combined diagnostic performance is obtained,the AUC was 0.737, with the sensitivity of 72.7% and the specificity of 66.7%.)Introduction
Rectal cancer is the third most common cancer in the world and the most common gastrointestinal tumor[1]. Its prevalence is on the rise due to the improvement of people's living standards, changes in diet structure and changes in the social environment.Preoperative and accurate judgment before surgery is an urgent need for accurate diagnosis of rectal cancer[2].Purpose
The correlation between DCE-MRI quantitative parameter values (Ktrans, Ve, Kep) and molecular biomarkers (Ki67,p53) was compared and explored in patients with rectal cancer.Analyze the intrinsic relationship between imaging indicators and tumor biological behavior, and improve the clinical value of DCE-MRI.Materials and method
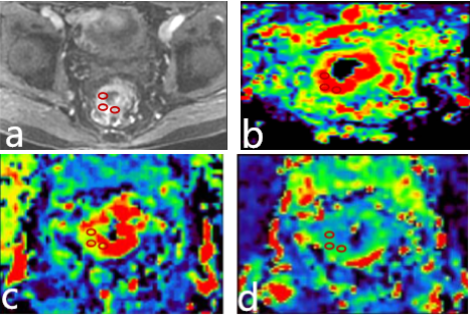
A retrospective analysis of 46 cases (34 male , 12 female , mean age: 67.5 ±10.12, range: 45- 89 years) of our hospital with 3.0T MRI (including DCE-MRI sequence), surgical pathology (immunohistochemical indicators including Ki67 and P53).This study was approved by the local IRB. These cases were divided into four groups: Ki67high-differentiation group (n=42),Ki67 low-differentiation group (n=4), P53 high-differentiation group (n=22),P53low-differentiation group (n=24).Two imaging diagnosticians independently performed lesion delineation in the case of unknown grouping. The GE Functool 4.6 workstation used GenIQ software for post-processing of DCE-MRI(Figur1).Scanning parameters for the DCE-MRI were as follows: using LAVA fast volume scan sequence,FOV=40mm×32mm,TR/TE=3.5/1.5ms,slice thick/gap=3.6/0mm,NEX=069,.matrix=256×192, scanning suration=4min, 40 periods are scanned totally. The region of interest (ROI) was selected in combination with T2WI, DWI and DCE-MRI selected the lesions to show the best, largest and adjacent layers of the annular layer to delineate the thickened intestinal wall, avoiding hemorrhage, necrosis, cystic changes, calcification, and measuring and recording the DCE-MRI quantification in the two groups(Figure1). Parameters: Ktrans, Kep, Ve values,the intra-group correlation coefficient (ICC) is used to test the consistency of the data measured by the two observers.Ki67 and P53 analyze the texture analysis of three post-processing images of Ktrans, Ve, Kev and obtains parameters with inter-group differences, provide diagnostic performance, and uses logistic regression to combine these statistically significant parameters to obtain the combined diagnostic performance.Results
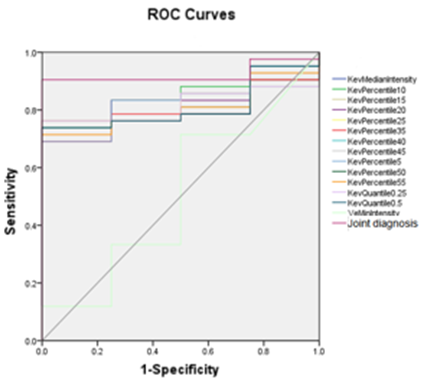
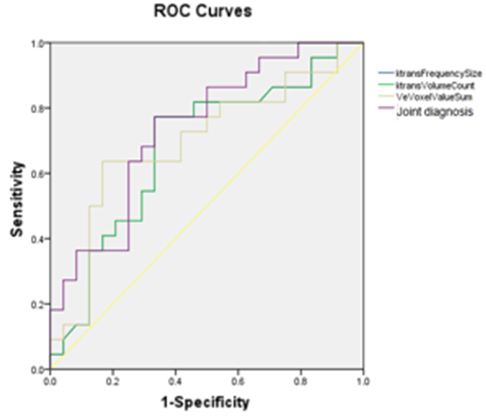
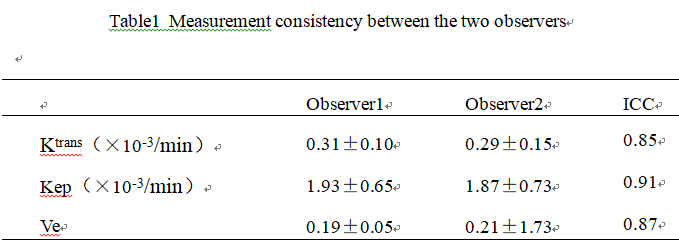
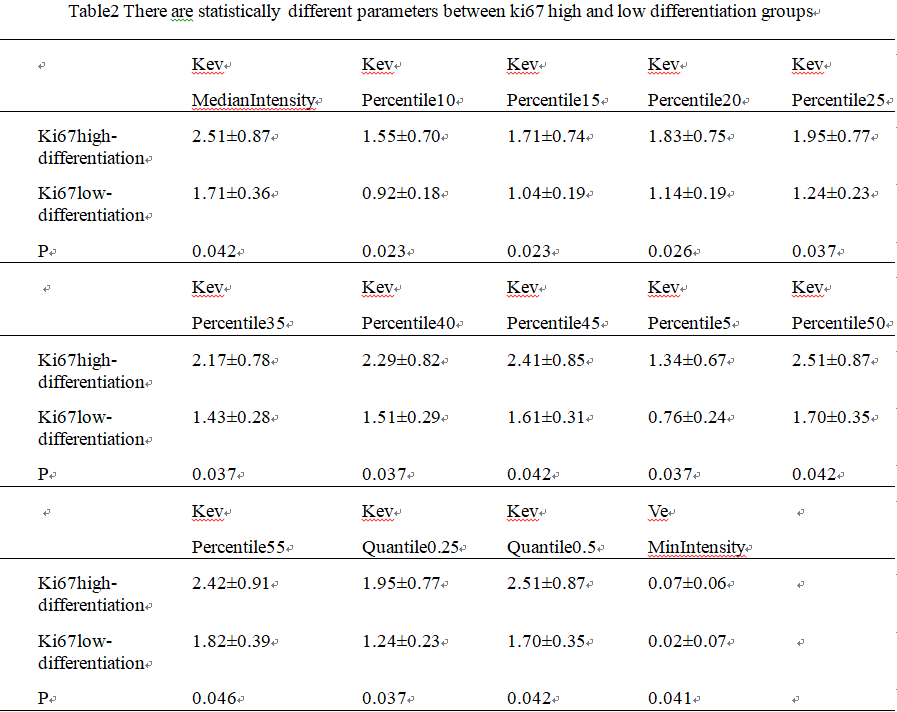
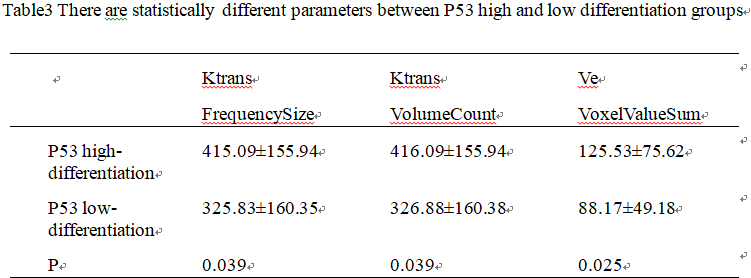
The consistency of measurements by two radiologists was in good agreement (ICC > 0.75)(Table1).The partial texture parameters of the ktrans and Ve diagrams of DCE-MRI have certain value for identifying the Ki67 high and low differentiation groups (Table2), the AUC is up to 0.839, and the combined diagnostic efficiency is higher (Table4),the AUC is 0.923, with the sensitivity of 90.5% and the specificity of 50%(Figure2). The partial texture parameters of the ktrans and Ve diagrams of DCE-MRI have certain value for identifying the P53 high and low differentiation groups (Table3), the AUC is up to 0.678, and the combined diagnostic efficiency is higher(Table5),the AUC was 0.737, with the sensitivity of 72.7% and the specificity of 66.7%(Figure3).Discussion and Conclusion
The study on the correlation between DCE-MRI quantitative parameters and molecular biological markers in rectal cancer is still in the initial stage, and the results are not very consistent[3].However, with the continuous improvement and improvement of MRI post-processing software technology and the standardization of molecular biological marker detection, DCE-MRI technology still has unlimited development space in preoperative evaluation of tumor malignancy, tumor prognosis and efficacy monitoring of anti-tumor drugs.This study viewed that DCE-MRI texture analysis of rectal cancer can predict the value of Ki67,P53 expression status before operation.Acknowledgements
No acknowledgement found.References
[1]Siegel RL, Miller KD, Fedewa SA, et al. Colorectal cancer statistics, 2017[J]. Ca A Cancer Journal for Clinicians, 2017, 67:104-117. [
2]Palmisano A,Esposito A,Rancoita P M V et al. Could perfusion heterogeneity at dynamic contrast-enhanced MRI be used to predict rectal cancer sensitivity to chemoradiotherapy?[J] .Clin Radiol, 2018, 73: 911.e1-911.e7.
[3]Wang Hui,Hu Yunting,Li Hui et al. Preliminary study on identification of estrogen receptor-positive breast cancer subtypes based on dynamic contrast-enhanced magnetic resonance imaging (DCE-MRI) texture analysis.[J] .Gland Surg, 2020, 9: 622-628.
Figures