0945
Deep learning prediction for clear cell renal carcinoma cancer compared with human and radiomics analysis1Radiology, UT southwestern medical center, Dallas, TX, United States
Synopsis
Clear cell renal carcinoma cancer (ccRCC) is the most aggressive subtype among small renal masses. ccRCC identification can help in decision making between active surveillance and definitive intervention. Recently, a clear cell likelihood score (ccLS) using subjective interpretation of multiparametric MRI by radiologists was proposed. In this study, we investigate whether radiomics and deep learning (DL) technique can facilitate the prediction of ccRCC using T2-weighted images only. We compared the results of two different approaches, radiomics and DL, with the reported ccLS performance. Our results demonstrate that both radiomics and deep learning may provide useful information for identification of ccRCC.
Introduction
Small renal masses (SRM, size $$$\leq 4 cm$$$) account for over 50% of all renal masses, and encompass a broad disease spectrum from benign tumors to aggressive malignancies 1. Determining which renal masses should undergo definitive intervention is a complex issue, because over 20% of SRM are benign 2 and there is a lack of reliable predictors of oncologic behavior and tumor grades. ccRCC, the most common subtype of RCC, is the most aggressive subtype among SRM 3. ccRCC Identification can help in management decision making between active surveillance and definitive intervention 4. Recently, the ccRCC prediction was proposed using the clear cell likelihood score (ccLS) derived from multiparametric MRI including T2-weighted (T2w), T1w, Diffusion-weighted, and multi-phasic-contrast-enhanced MRI 4. Reported mean accuracy among 7 blinded readers for the diagnosis of ccRCC using a ccLS ≥4 was 79% 5. In this study, we investigated whether radiomics and deep learning can facilitate the prediction of ccRCC using T2w images only.Methods
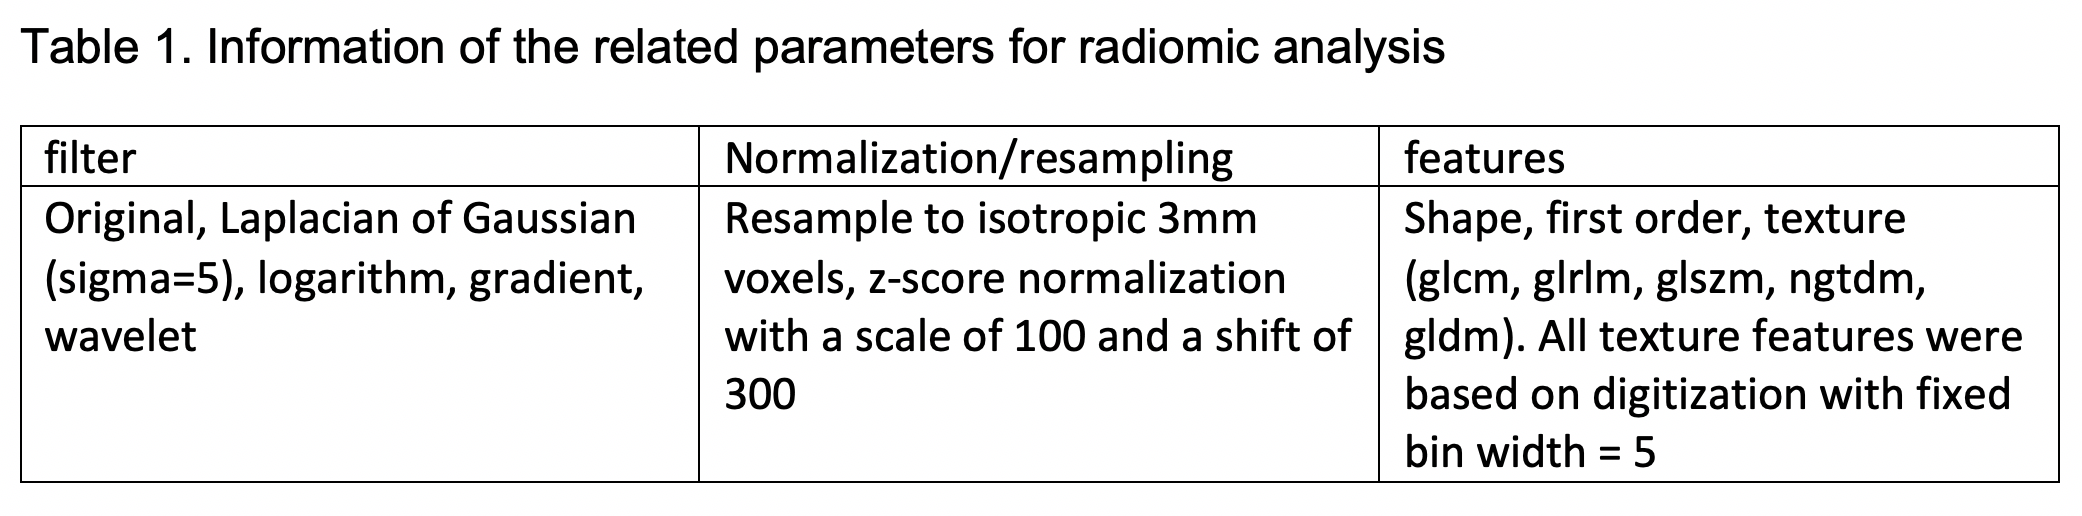
This retrospective study included total 94 subjects who under-went surgical resection of a renal mass (<= 4 cm) between 2011 and 2015 and who had a presurgical T2w MR images available for analysis. Coronal T2w fast spin-echo images were acquired on different scanners (GE, Philips, and Siemens). The imaging acquisition parameters were: 3 to 10 mm slice thickness, 70 to 164 ms TE, 502 to 4500 ms TR. Patients were imaged both in our center and elsewhere, contributing to MRI protocol variability. Masks for kidneys and tumors were manually drawn by a third-year Radiology resident.In radiomic analysis, tumor size and 1,046 radiomic features were extracted for each mask of kidney or tumor via the pyRadiomics package with parameters in Table1. Binary classification of ccRCC was based on pathology results (45 non-ccRCC vs. 49 ccRCC). Repeated nested 10-fold cross validation with LASSO logistic regression was used with 1000 repeats. Three different models were reported, 1. Tumor size only, 2. Tumor size + tumor radiomics, 3. Tumor size + tumor radiomics + ratio of tumor radiomics and kidney radiomics. Cross validated areas under the receiver operating curves (AUC) were reported with 95% confidence intervals. The classification analyses for radiomics were done in R with the glmnet package. All radiomic feature extraction adhered to the recommendations from the Image Biomarker Standardization Initiative (BSI)6.
In deep learning (DL) analysis, 2D EfficientNet (b0) was used to classify two classes (ccRCC vs. non-ccRCC) in Pytorch. Total 311 of tumor coronal T2w slices were selected for training and validation. Since the data size is small, five-fold cross validation was used to estimate the averaged performance of the model. Slices from 18 selected balanced subjects (9 ccRCC, 9 non-ccRCC) were used for validation in each fold. Two DL trainings were performed and reported: 1. A single slice as an input; 2. A slice, its kidney and tumor masks as inputs. The trained models were used to predict the result for each slice. If any slice for one subject was classified as ccRCC, this subject was classified as ccRCC. The preprocessing steps included N4bias field correction, Marcenko-Pastur PCA denoising, Nyul 7 or z-score normalization. The data augmentation steps were randomly implemented in every epoch including crop with different field-of-view (FOV) (280-350mm), 2D rotation (0-90°), 2D left-right or up-down flip. Batch size was 30 and the total number of epochs was 200. The best weights in each fold were saved for the subject prediction. Class activation maps were generated to check the highlighted regions for trained models.
Results from radiomics and DL analyses were compared against reported performance of the ccLS criteria and plotted using receiver under the operating curve analysis.
Results
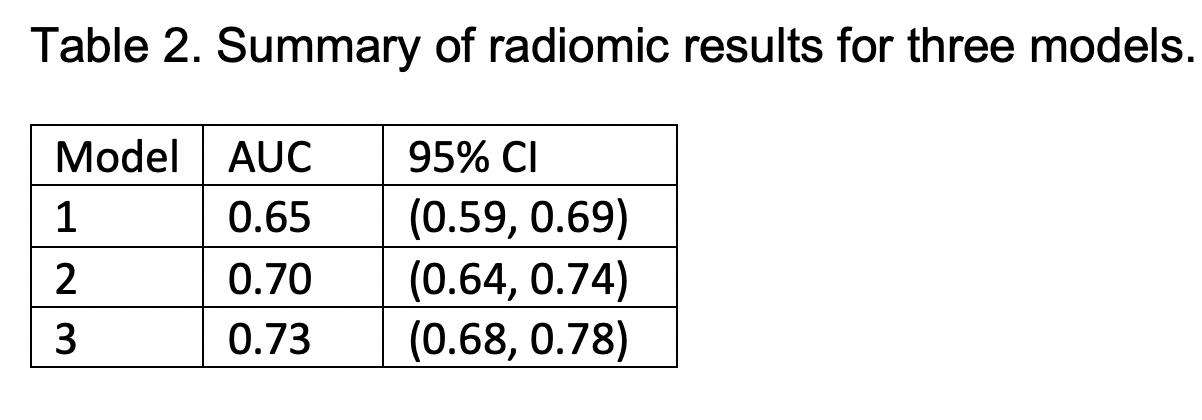
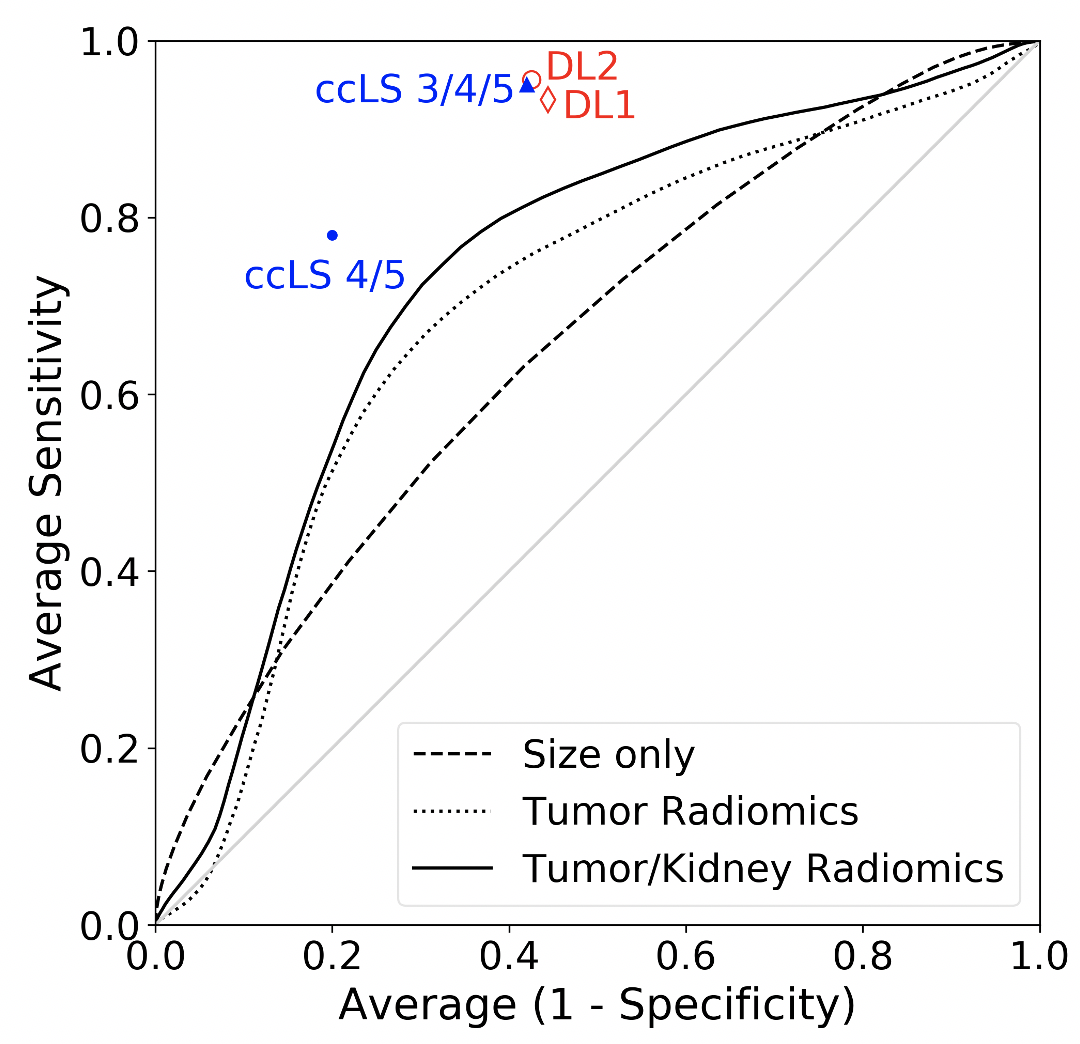
Table 2. shows the results for the three radiomic models. AUC using the tumor size only was 0.65, which is consistent with previous results 2. AUC using tumor radiomic features and tumor size was slightly improved to 0.70. AUC adding a ratio of tumor radiomics and kidney radiomics was further improved to 0.73. Fig. 1 shows all three ROC curves for the three models of radiomics. The first DL model (DL1) using a single slice predicted ccRCC subjects with a mean accuracy of 74%, a mean sensitivity of 0.93, and a mean specificity of 0.56. The second model (DL2) using tumor and kidney masks reached a mean accuracy of 77%, a mean sensitivity of 0.96, and a mean specificity of 0.57 (Fig. 1). For reference, the two prediction results using ccLS 4/5 (mean accuracy 79%) and ccLS 3/4/5 (mean accuracy 77%) previously reported5 were also plotted on Fig.1.Discussion/Conclusion
Our results demonstrate that both radiomics and deep learning technique have the potential to facilitate the prediction of ccRCC subjects even using T2w images only. However, both radiomics and the DL2 model required tumor and kidney masks. A trade-off between the benefit and the effort of drawing masks need further evaluation. Class activation maps for the DL models, especially DL1, may not highlight tumor and kidney regions for a portion of subjects. Therefore, the performance of deep learning models requires further validation in a larger cohort of subjects.Acknowledgements
This project is supported by NIH grants R01CA154475, U01CA207091, and P50CA196516.References
1. Weikert, S. and B. Ljungberg, Contemporary epidemiology of renal cell carcinoma: perspectives of primary prevention. World J Urol, 2010. 28(3): p. 247-52.
2. Frank, I., et al., Solid renal tumors: an analysis of pathological features related to tumor size. J Urol, 2003. 170(6 Pt 1): p. 2217-20.
3. Campbell, S., et al., Renal Mass and Localized Renal Cancer: AUA Guideline. J Urol, 2017. 198(3): p. 520-529.
4. Johnson, B.A., et al., Diagnostic performance of prospectively assigned clear cell Likelihood scores (ccLS) in small renal masses at multiparametric magnetic resonance imaging. Urol Oncol, 2019. 37(12): p. 941-946.
5. Canvasser, N.E., et al., Diagnostic Accuracy of Multiparametric Magnetic Resonance Imaging to Identify Clear Cell Renal Cell Carcinoma in cT1a Renal Masses. J Urol, 2017. 198(4): p. 780-786.
6. Zwanenburg, A., et al., The Image Biomarker Standardization Initiative: Standardized Quantitative Radiomics for High-Throughput Image-based Phenotyping. Radiology, 2020. 295(2): p. 328-338.
7. Nyul, L.G. and J.K. Udupa, On standardizing the MR image intensity scale. Magn Reson Med, 1999. 42(6): p. 1072-81.
Figures