0941
Using Variable Flip Angle (VFA) and Modified Look Locker Inversion Recovery (MOLLI) T1 Mapping in Clinical OE-MRI
Emma Bluemke1, Ambre Bertrand1, Kwun-Ye Chu2,3, Nigar Syed2, Andrew Murchison3,4, Tessa Greenhalgh3,5, Brian Burns6, Martin Craig7, Nia Taylor3, Ketan Shah2,3, Fergus Gleeson2,3, and Daniel Bulte1
1University of Oxford, Oxford, United Kingdom, 2MRC Oxford Institute for Radiation Oncology, Department of Oncology, University of Oxford, Oxford, United Kingdom, 3Radiotherapy Department, Oxford University Hospitals NHS, Oxford, United Kingdom, 4Nuffield Department of Medicine, University of Oxford, Oxford, United Kingdom, 5University Hospital Southampton NHS FT, Southhampton, United Kingdom, 6GE Healthcare, Menlo Park, CA, United States, 7University of Nottingham, Nottingham, United Kingdom
1University of Oxford, Oxford, United Kingdom, 2MRC Oxford Institute for Radiation Oncology, Department of Oncology, University of Oxford, Oxford, United Kingdom, 3Radiotherapy Department, Oxford University Hospitals NHS, Oxford, United Kingdom, 4Nuffield Department of Medicine, University of Oxford, Oxford, United Kingdom, 5University Hospital Southampton NHS FT, Southhampton, United Kingdom, 6GE Healthcare, Menlo Park, CA, United States, 7University of Nottingham, Nottingham, United Kingdom
Synopsis
As clinical studies adopt Oxygen-Enhanced MRI to assess its feasibility in human tumours, it is important for researchers to report any practical complications experienced. We report our practical experience with using both MOLLI and VFA T1 mapping for a recently completed OE-MRI clinical oncology study with the aim that sharing this is helpful to researchers planning to use OE-MRI in clinical oncology. Specifically, we report 4 elements: (1) difference in estimated T1 from each method used (MOLLI and VFA), (2) standard deviation within tumour ROIs, (3) OE-MRI response resulting from either method, and (4) artefacts and practical difficulties encountered.
Introduction
The imaging technique known as Oxygen-Enhanced MRI has been suggested to be a feasible technique for detecting hypoxia in tumours in preclinical models[1]. As clinical studies adopt the OE-MRI technique to assess feasibility and reproducibility in patients, it is important for researchers to share and report the practical complications experienced when using OE-MRI on patients.The premise of OE-MRI is the following: oxygen affects MR contrast by acting as a paramagnetic relaxation agent which increases the longitudinal relaxation rate R1 (1/T1)[2-4]. By acquiring a measurement of R1 under normal conditions, and then performing a second measurement while the patient is breathing an increased inspired fraction of oxygen via a face mask, the change in R1 (or the area under the curve, if measured dynamically) could be used to infer information about the perfusion of the tumour[1]. Additional data such as T2* changes can provide important information about the changes in oxygenation.
OE-MRI studies have used a variety of methods to detect the change in R1 — some have used T1-weighted imaging[5-9], some used quantitative T1 mapping methods such as Inversion Recovery[8-9], Variable Flip Angle[9], or Look-Locker variants such as Modified Look-Locker Inversion Recovery (MOLLI) [10]. There are tradeoffs between T1 estimation accuracy and acquisition time between each of these methods, and some are known to over- or under-estimate T1[11]. Although OE-MRI has shown success in pre-clinical work, applying OE-MRI into a clinical trial workflow heightens the importance of two issues: acquisition time and patient motion. In this abstract, we report our practical experience with using both MOLLI and VFA T1 mapping for a recently completed OE-MRI clinical study on oropharyngeal squamous cell carcinoma, with the aim that sharing this is helpful to researchers planning to use OE-MRI in clinical studies.
Specifically, we aim to report 4 elements: (1) the difference in estimated T1 from each method used (MOLLI and VFA), (2) the standard deviation within the tumour ROIs, (3) the OE-MRI response resulting from either method, and (4) the artefacts and practical difficulties encountered in this study.
Methods
A group of 12 patients was scanned on a GE Discovery MR750 3T MRI scanner with HDNV coil array. The following images were acquired: T2-weighted image (SE sequence,TR=781ms,TE=16.44ms, slice thickness=4.0mm, slice gap=4.5mm, matrix=512x512,19 slices); Modified Look-Locker Inversion Recovery (MOLLI) [12] T1-mapping sequences (slice thickness=10mm, 11 inversion times, FA=35,TR=3.050ms, TE=1.332ms) acquired in a single transverse slice through the tumour volume; Variable Flip Angle (VFA) imaging via a 3D gradient echo sequence (TR=4.000ms,TE=0.656ms, matrix=256x256, slice thickness=5mm, FA=2,5,10,15)[13]. Both MOLLI and VFA scans were acquired while the patient was breathing air and then again after breathing 100% oxygen via an Intersurgical EcoLite high concentration oxygen mask (Intersurgical Ltd, Berkshire, UK). Scanning was performed only once end-tidal levels reached 70%, measured using a Respiratory Gas Analyzer ML206 and a PowerLab 4/26 (AD Instruments Ltd, Dunedin, New Zealand).Results and Discussion
1. T1 Estimation from MOLLI vs VFA (Figures 1, 2 and 3): Examples of the resulting images are provided in Figure 1, and the respective histograms of the tumour ROIs in Figure 2. When comparing respective slices of the tumour ROI, the VFA T1 estimation was higher than the MOLLI estimation by 27% on average (Min -1%, Max 73%) (Figure 3). These results are consistent with the discrepancy shown by Stikov et al [11], where the peaks from VFA, IR and Look-Locker methods varied as much as 30%.2. Standard deviation within tumour ROI (Figure 4): There was no significant difference in the standard deviation seen within the tumour ROIs from the VFA method versus MOLLI (paired t-test, alpha=0.05, two-tailed p=0.95). Of course, the homogeneity of the tissue is a factor in the standard deviation seen in the tumour ROI — however the tumour standard deviation provided from the methods did not correlate with each other (shown in Figure 4), suggesting some variation is introduced by the method.
3. Resulting OE-MRI data from either method (Figure 5): Due to acquiring a 3D image, VFA captured OE-MRI information from the entire tumour, while the single-slice MOLLI method only captured OE-MRI response in one slice. By this measure alone, the VFA data was more useful for the clinical study, however VFA was also a more robust method when considering patient motion: patient motion in the z-plane (occurring in 7/12 patients) resulted in the MOLLI scan capturing a different area of the tumour, rendering it unusable for OE-MRI analysis.
4. Artefacts and practical difficulties (Figure 1): We encountered several practical challenges: (1) acquisition settings were sometimes changed by well-meaning radiographers, leading to inconsistent FOV and resolution, as well as some artefacts such as (2) phase wrap-around and (3) a dark band near the sinuses seen on the MOLLI T1 maps, sometimes accompanied by a corresponding bright band (Subj F, Figure 1). Fortunately, the artefacts did not occlude any tumour ROI.
Conclusion
We report our practical experience with using MOLLI and VFA T1 mapping for a recently completed OE-MRI clinical study, with the aim that sharing this is helpful to researchers planning to use OE-MRI in clinical studies. In this study, VFA was a more reliable and robust technique than MOLLI T1 mapping.Acknowledgements
This study is part of the translational cancer research programme of the University of Oxford and the Oxford University Hospitals NHS Trust. It is undertaken via the core clinical and research infrastructure underpinned by strategic research programme grant funds. The research imaging is enabled by funding provided by the Oxford Cancer Imaging Centre (OCIC). OCIC is funded by a strategic initiative from Cancer Research UK jointly with the Engineering & Physical Sciences Research Council, the Medical Research Council and the Department of Health. Funding has also been provided by the Oxfordshire Health Services Research Committee (OHSRC), a subcommittee of the Oxford Radcliffe Charitable Funds Charity. We acknowledge support provided by The CRUK Oxford Cancer Research Centre and The Oxford National Institute for Health Research Biomedical Research Centre. This work was supported by funding from the Engineering and Physical Sciences Research Council (EPSRC) and Medical Research Council (MRC) [grant number EP/L016052/1], the Clarendon Scholarship fund and the Joe Todd Engineering Award from St Edmund Hall.References
- O’Connor JP, Robinson SP, Waterton JC. Imaging tumour hypoxia with oxygen enhanced MRI and BOLD MRI. Br J Radiol 2019;92:20180642.
- Matsumoto K, Bernardo M, Subramanian S, Choyke P, Mitchell JB, Krishna MC, et al. MR assessment of changes of tumor in response to hyperbaric oxygen treatment. Magn Reson Med 2006;56:240–6.
- Tadamura E, Hatabu H, Li W, Prasad PV, Edelman RR. Effect of oxygen inhalation on relaxation times in various tissues. Journal of Magnetic Resonance Imaging. 1997;7(1):220-5.
- Berkowitz BA. Role of dissolved plasma oxygen in hyperoxia induced contrast. Magn Reson Imag 1997.
- White D A, Zhang Z, Li L, Gerberich J, Stojadinovic S, Peschke P and Mason R P 2016 Developing oxygen-enhanced magnetic resonance imaging as a prognostic biomarker of radiation response. Cancer Lett 380 69–77
- Zhao D, Pacheco-Torres J, Hallac RR, White D, Peschke P, Cerdan S, et al. Dynamic oxygen challenge evaluated by NMR T1 and T2 * – insights into tumor oxygenation. NMR Biomed 2015;28:937–47.
- Hallac RR et al. Correlations of noninvasive BOLD and TOLD MRI with pO2 and relevance to tumor radiation response. Magn Reson Med 2014;71:1863–73.
- Morgan A R, Parker G J M, Roberts C, Buonaccorsi G A, Maguire N C, Cristinacce P L H, Singh D, Vestbo J, Bjermer L, Jögi J, Taib Z, Sarv J, Bruijnzeel P L B, Olsson L E, Bondesson E, Nihlén U, McGrath D M, Young S S, Waterton J C and Nordenmark L H 2014 Feasibility assessment of using oxygen-enhanced magnetic resonance imaging for evaluating the effect of pharmacological treatment in COPD Eur J Radiol 83 2093–101
- Salem A, Little R A, Latif A, Featherstone A K, Babur M, Peset I, Cheung S, Watson Y, Tessyman V, Mistry H, Ashton G, Behan C, Matthews J C, Asselin M-C, Bristow R G, Jackson A, Parker G J M, Faivre-Finn C, Williams K J and O’Connor J P B 2019 Oxygen-enhanced MRI Is Feasible, Repeatable, and Detects Radiotherapy-induced Change in Hypoxia in Xenograft Models and in Patients with Non–small Cell Lung Cancer Clin Cancer Res 25 3818–29
- Bluemke E, Bulte D, Bertrand A, George B, Cooke R, Chu K-Y, Durrant L, Goh V, Jacobs C, Ng S M, Strauss V Y, Hawkins M A and Muirhead R 2020 Oxygen-enhanced MRI MOLLI T1 mapping during chemoradiotherapy in anal squamous cell carcinoma. Clin Transl Radiat Oncol 22 44–9
- Stikov N, Boudreau M, Levesque I R, Tardif C L, Barral J K and Pike B G 2015 On the accuracy of T1 mapping: Searching for common ground Magnetic Resonance in Medicine 73 514–22
- Messroghli DR, Radjenovic A, Kozerke S, et al. Modified look-locker inversion recovery (MOLLI) for high-resolution T1 mapping of the heart. Magn Reson Med 2004;52(1):141–6
- Cheng HM, Wright GA. Rapid high-resolution T(1) mapping by variable flip angles: accurate and precise measurements in the presence of radiofrequency field inhomogeneity. Magn Reson Med 2006;55(3):566-74. doi: 10.1002/mrm.20791.
Figures
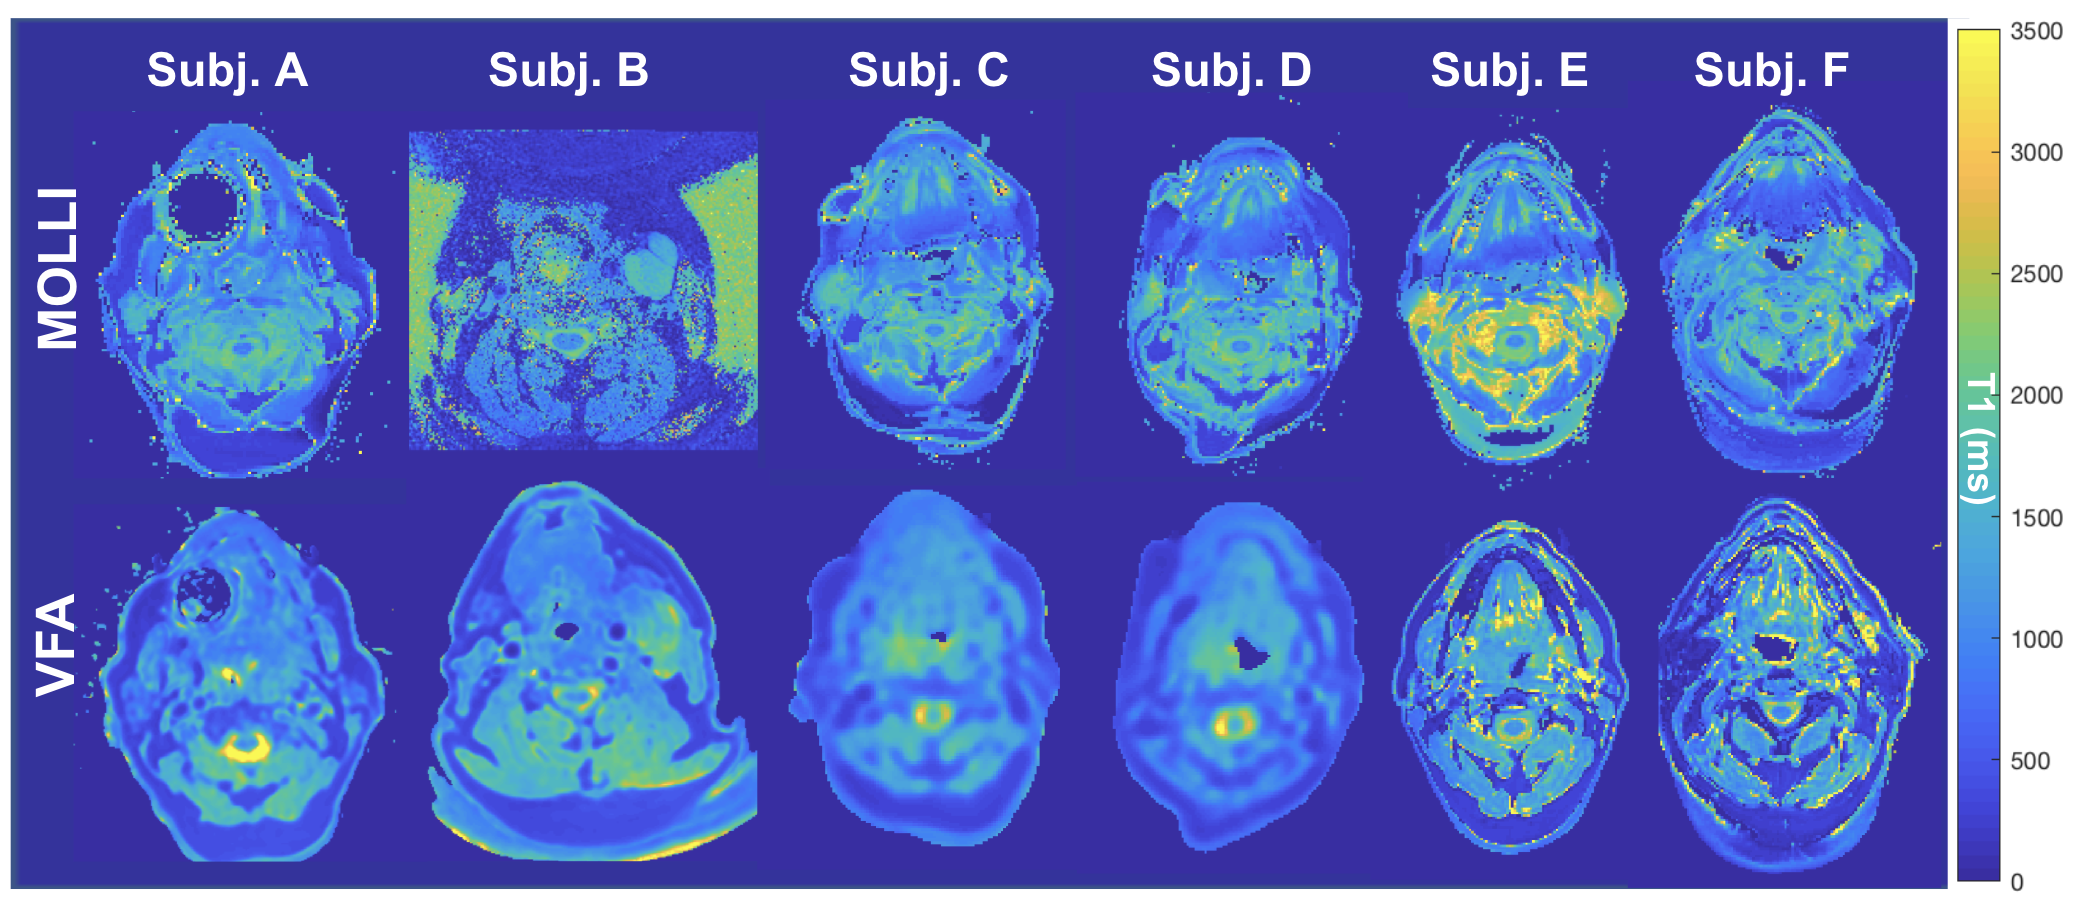
Example VFA and MOLLI T1 maps for 6 subjects (displaying a comparable slice). The field-of-view of the images has been cropped for ease of display.
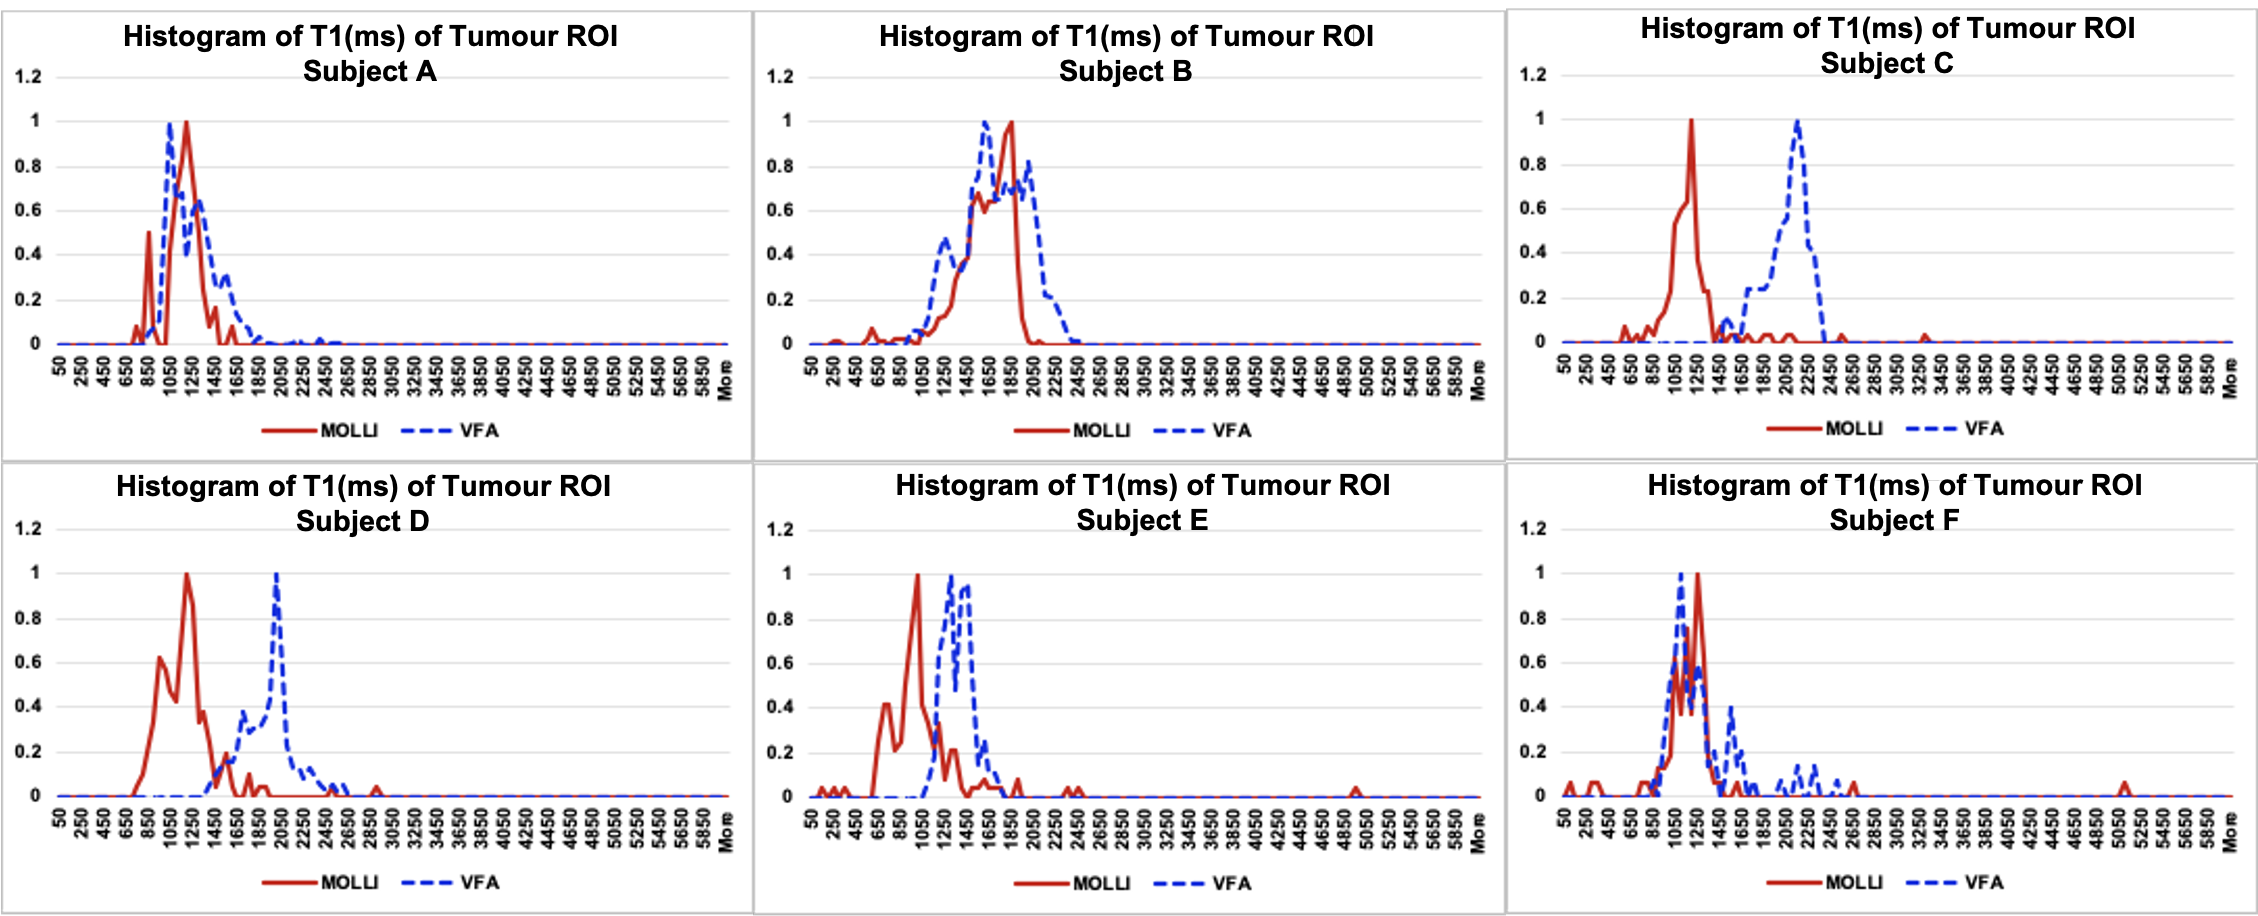
Histograms of T1 (ms) of the tumour ROI in the example VFA and MOLLI T1 maps in Figure 1 (still within the comparable slice).
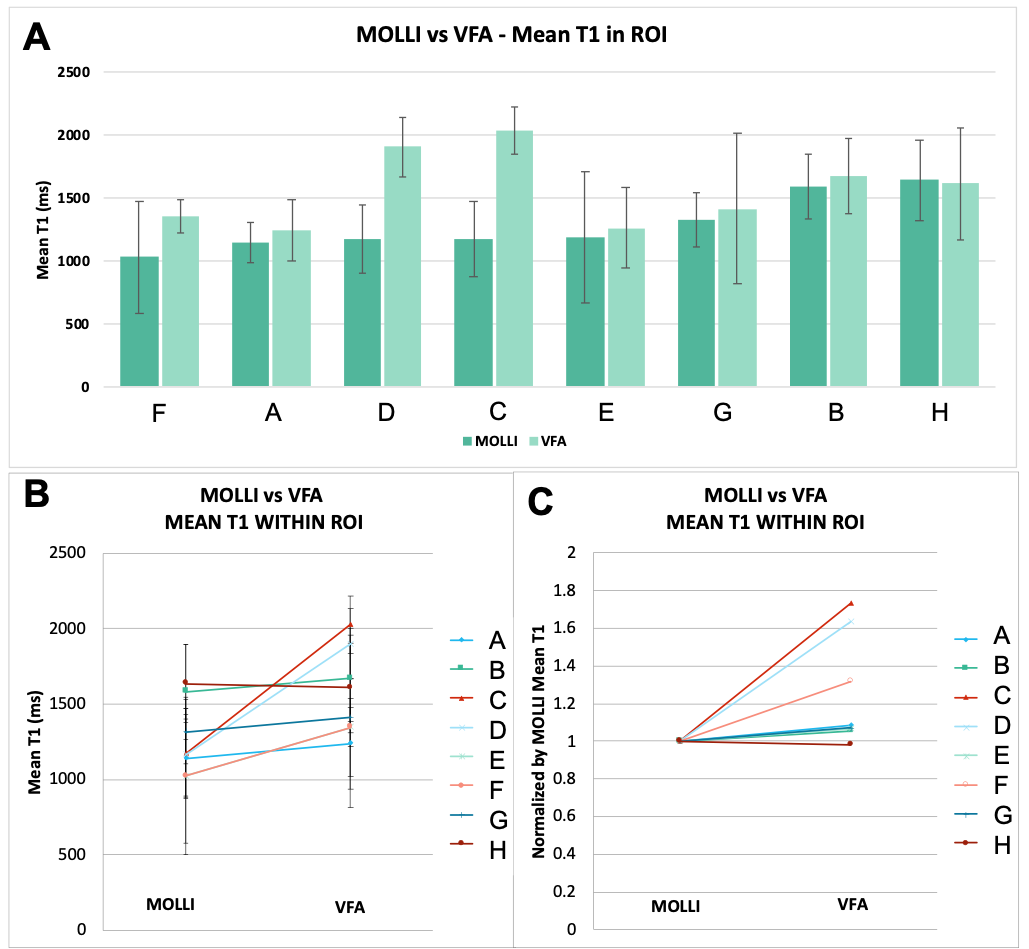
(A-B) The mean T1 in the tumour ROI of all subjects. The error bars represent the standard deviation of T1 values within the tumour ROI. (C) The mean VFA T1, normalized by the respective mean MOLLI T1 for each subject to illustrate the relative change in T1 clearly.
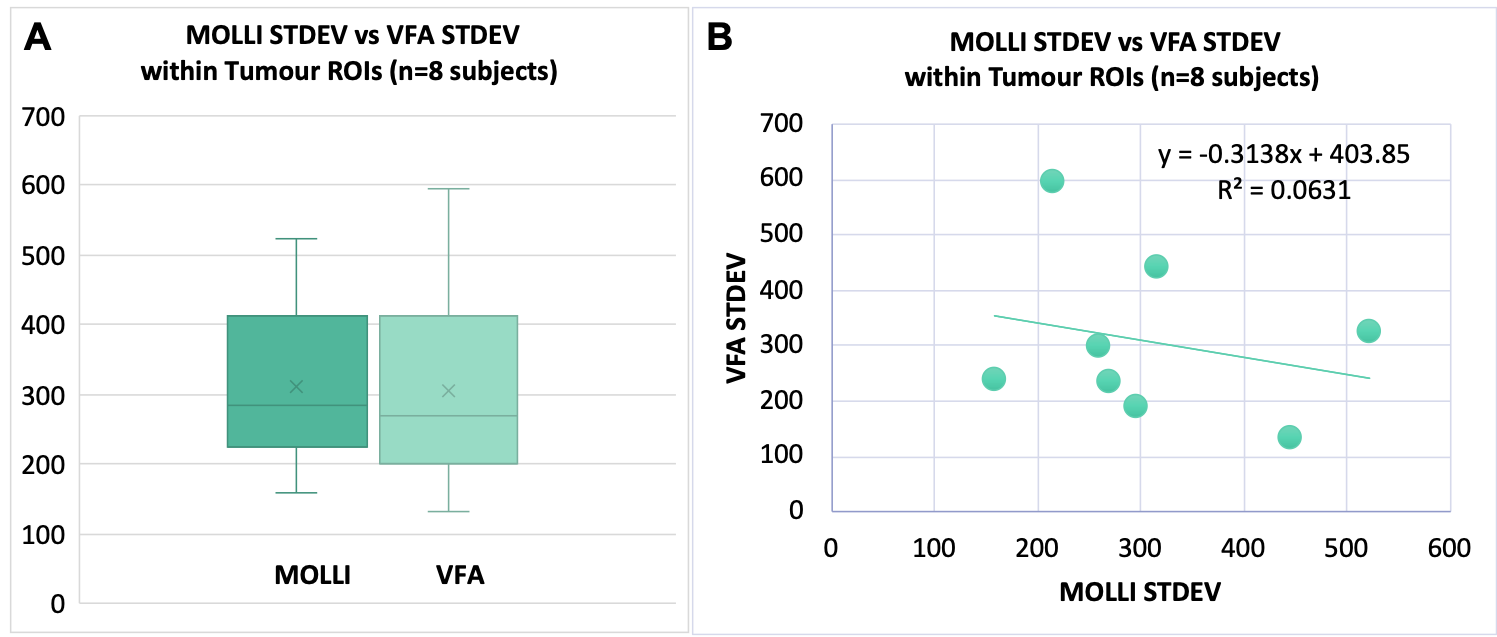
(A) Box plots of the standard deviation of T1 values within each tumour ROI (n=8) - no significant difference in the standard deviation seen within the tumour ROIs from the VFA method versus MOLLI (paired t-test, alpha=0.05, two-tailed p=0.95). (B) Scatter plot of the standard deviation of T1 values from VFA versus MOLLI in each patient tumour ROI. The standard deviation from VFA did not correlate with the standard deviation from MOLLI (linear regression, R2=0.06, Significance F=0.55).
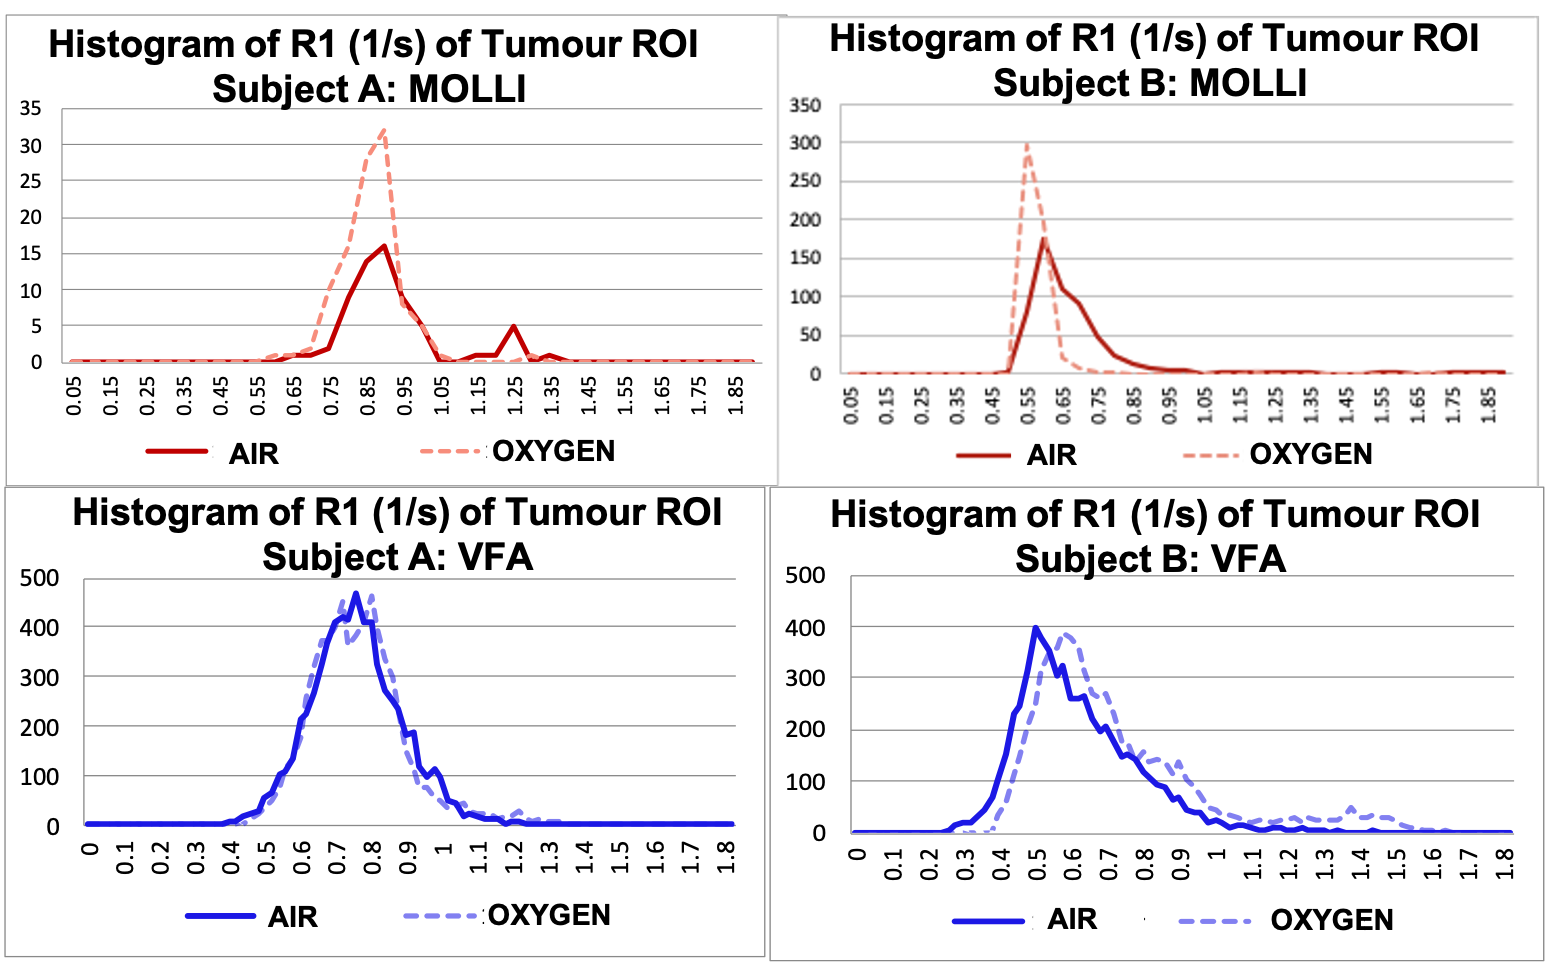
Histograms of R1 (1/s) of the tumour ROI while the patient was breathing air versus 100% oxygen using the data provided from the MOLLI T1 maps (top, red) and VFA T1 maps (bottom, blue).